Search Market Research Report

Discover Our Latest Reports
Discover Our Featured Reports
Discover Top Selling Reports

Ophthalmic Drugs Market Size, Share Global Analysis Report, 2021 - 2026

report img

Ophthalmic Drugs Market By Drug Class (Antiallergy, Anti-VEGF Agents, Anti-Inflammatory, Antiglaucoma, & Others), By Disease (Dry Eye, Eye Allergy, Glaucoma, Eye Infection, Retinal Disorders, Uveitis, & Others), By Dosage (Gels, Eye Solutions, Capsules & Tablets, Eye Drops, & Ointments), By Route of Administration (Topical, Local Ocular, & Systematic), By Product (Prescription Drugs & OTC), And By Regions - Global & Regional Industry Perspective, Comprehensive Analysis, and Forecast 2021 - 2026

Industry Insights

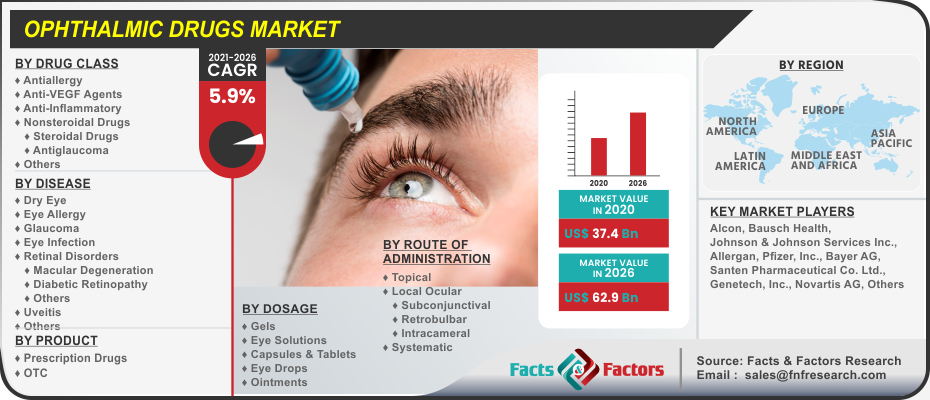
[197+ Pages Report] We at Facts & Factors have recently published a report titled “Global Ophthalmic Drugs Market” that encompasses the spectacle of the market in an analytical and comprehensive manner. In this study, the global ophthalmic drugs market is projected to value USD 62.9 Billion in the year 2026 from an initial value of USD 37.4 Billion in the year 2020 growing at a CAGR value of 5.9%.

logoMarket Overview

Ophthalmic is a branch of medicine and surgery that deals with the diagnosis and treatment of disorders relating to the eye. Professional service providers for the ophthalmic sector are known ophthalmologist and their credentials include a degree in medicine followed by five years of residency training of on-site. They often prescribe medications for treating eye disorders, implementing laser therapy measures, and performing surgeries whenever needed.

logoIndustry Growth Factors

The primary driving factors for the significant growth of the global ophthalmic drugs market during the advent of the forecast period are the rising prevalence of eye-related disorders such as presbyopia, macular degeneration, and diabetic retinopathy among the aging population coupled with the increasing introduction of ophthalmic devices equipped with advanced technologies to name a few. Additionally, the rising need for ophthalmic surgeries coupled with rising collaborations between the key market players will increase the footprint of the global ophthalmic drugs market during the forecast period. Moreover, rising instances of gene therapy for treating hereditary ophthalmic diseases coupled with an increase in the geriatric population will boost the growth of the global ophthalmic drugs market during the forecast period.

The global ophthalmic drugs market is driven by rising investments in R&D activities coupled with increasing initiatives undertaken by various government initiatives to name a few. Additionally, the surging demand for ophthalmic drugs coupled with rising instances of cataract, glaucoma, color blindness, diabetic macular edema, and CMV retinitis, to name a few. However, a lack of health coverage measures coupled with low consumer awareness about the wider range of ophthalmic diseases will decrease the market share of the global ophthalmic drugs market during the forecast period.

Ophthalmic Drugs Market

To know more about this report | Request Free Sample Copy

logoSegmentation Analysis

The global ophthalmic drugs market is segmented into drug class, disease type, dosage, route of administration, product, and region.

The global ophthalmic drugs market is divided into anti-allergy, anti-VEGF agents, anti-inflammatory, antiglaucoma, and others on the basis of drug class. The segment pertaining to anti-VEGF (vascular endothelial growth factors) is expected to witness the largest market share during the advent of the forecast period owing to strong commercial performances of the drug class coupled with the rising number of undergoing clinical studies for developing anti-inflammatory eye disorders to name a few. The global ophthalmic drugs market is categorized into the dry eye, eye allergy, glaucoma, eye infection, retinal disorders, uveitis, and others on the basis of disease. The segment pertaining to retinal disorders is expected to witness the largest market share during the advent of the forecast period owing to the presence of a stronger pipeline of products and increasing volumes coupled with rising cases of COVID-19 and COVID-19 related eye disorders to name a few.

Based on dosage, the global ophthalmic drugs market is fragmented into gels, eye solutions, capsules & tablets, eye drops, and ointments. The eye drops category is expected to witness the largest market share during the advent of the forecast period owing to ease of usage, higher patient compliance rate coupled with a lower and devastating impact for the treatment of eye disorders to name a few. The global ophthalmic drugs market is classified into topical, local ocular, and systematic on the basis of route of administration. The segment pertaining to topical is expected to occupy the largest market share during the advent of the forecast period owing to rising product launches of new products coupled with rising sales volumes in terms of retinal disorders to name a few. The global ophthalmic drugs market is bifurcated into prescription drugs and OTC on the basis of product. The segment pertaining to prescription drugs is expected to witness the largest market share during the advent of the forecast period owing to improving safety and efficacy profiles coupled with a lower price point to name a few.

logo Report Scope

Report Attribute

Details

Market Size in 2020

USD 37.4 Billion

Projected Market Size in 2026

USD 62.9 Billion

CAGR Growth Rate

5.9% CAGR

Base Year

2020

Forecast Years

2021-2026

Key Market Players

Alcon, Johnson & Johnson Services Inc., Bausch Health, Allergan, Pfizer, Inc., Bayer AG, Santen Pharmaceutical Co. Ltd., Genetech, Inc., Novartis AG, Regeneron, Merck & Co., Coherus Biosciences Inc., AbbVie Inc., F. Hoffmann-La Roche Ltd., Teva Pharmaceutical Industries Ltd., and Sun Pharmaceutical Industries Ltd., among others.

Key Segments

Drug Class, Disease, Dosage, Route of Administration, Product, and Region

Major Regions Covered

North America, Europe, Asia Pacific, Latin America, and Middle East & Africa

Purchase Options

Request customized purchase options to meet your research needs. Explore purchase options

logo Regional Analysis

North America is expected to witness the largest market share during the advent of the forecast period owing to the presence of a well-established healthcare infrastructure coupled with a higher rate of consumer awareness due to early adoption of the technology to name a few. Additionally, the presence of key market players in the region coupled with the rising number of middle-class households will increase the footprint of the ophthalmic drugs market during the forecast period. Asia-Pacific is expected to witness the fastest growing CAGR during the forecast period owing to a risen burden of ophthalmic disorders coupled with an increasing number of local and regional efforts to provide better quality products to name a few. Moreover, improving medical infrastructure coupled with the rising penetration of health insurance solutions will further push the existing boundaries of the ophthalmic drugs market in the region toward a higher growth share.

logo Competitive Players

The key market participants for the global ophthalmic drugs market are

  • Alcon
  • Johnson & Johnson Services Inc.
  • Bausch Health
  • Allergan
  • Pfizer Inc.
  • Bayer AG
  • Santen Pharmaceutical Co. Ltd.
  • Genetech Inc.
  • Novartis AG
  • Regeneron
  • Merck & Co.
  • Coherus Biosciences Inc.
  • AbbVie Inc.
  • F. Hoffmann-La Roche Ltd.
  • Teva Pharmaceutical Industries Ltd.
  • Sun Pharmaceutical Industries Ltd.

logo By Drug Class Segment Analysis

  • Antiallergy
  • Anti-VEGF Agents
  • Anti-Inflammatory
    • Nonsteroidal Drugs
    • Steroidal Drugs
  • Antiglaucoma
  • Others

logo By Disease Segment Analysis

  • Dry Eye
  • Eye Allergy
  • Glaucoma
  • Eye Infection
  • Retinal Disorders
    • Macular Degeneration
    • Diabetic Retinopathy
    • Others
  • Uveitis
  • Others

logo By Dosage Segment Analysis

  • Gels
  • Eye Solutions
  • Capsules & Tablets
  • Eye Drops
  • Ointments

logo By Route of Administration Segment Analysis

  • Topical
  • Local Ocular
    • Subconjunctival
    • Retrobulbar
    • Intracameral
  • Systematic

logo By Product Segment Analysis

  • Prescription Drugs
  • OTC

logo By Regional Segment Analysis

  • North America
    • U.S.
    • Canada
  • Europe
    • UK
    • France
    • Germany
    • Italy
    • Spain
    • Rest of Europe
  • Asia Pacific
    • China
    • Japan
    • India
    • South Korea
    • Southeast Asia
    • Rest of Asia Pacific
  • Latin America
    • Brazil
    • Mexico
    • Rest of Latin America
  • Middle East and Africa
    • GCC Countries
    • South Africa
    • Rest of MEA

Table of Content

  1. Chapter 1 Executive Summary
    1. 1.1. Introduction of Ophthalmic Drugs
    2. 1.2. Global Ophthalmic Drugs Market, 2019 & 2026 (USD Billion)
    3. 1.3. Global Ophthalmic Drugs Market, 2016 – 2026 (USD Billion)
    4. 1.4. Global Ophthalmic Drugs Market Absolute Revenue Opportunity, 2016 – 2026 (USD Billion)
    5. 1.5. Global Ophthalmic Drugs Market Incremental Revenue Opportunity, 2020 – 2026 (USD Billion)
  2. Chapter 2 Ophthalmic Drugs Market – Drug Class Analysis
    1. 2.1. Global Ophthalmic Drugs Market – Drug Class Overview
    2. 2.2. Global Ophthalmic Drugs Market Share, by Drug Class, 2019 & 2026 (USD Billion)
    3. 2.3. Antiallergy
      1. 2.3.1. Global Antiallergy Ophthalmic Drugs Market, 2016 – 2026 (USD Billion)
    4. 2.4. Anti-VEGF Agents
      1. 2.4.1. Global Anti-VEGF Agents Ophthalmic Drugs Market, 2016 – 2026 (USD Billion)
    5. 2.5. Anti-Inflammatory
      1. 2.5.1. Global Anti-Inflammatory Ophthalmic Drugs Market, 2016 – 2026 (USD Billion)
    6. 2.6. Antiglaucoma
      1. 2.6.1. Global Antiglaucoma Ophthalmic Drugs Market, 2016 – 2026 (USD Billion)
    7. 2.7. Others
      1. 2.7.1. Global Others Ophthalmic Drugs Market, 2016 – 2026 (USD Billion)
  3. Chapter 3 Ophthalmic Drugs Market – Disease Analysis
    1. 3.1. Global Ophthalmic Drugs Market – Disease Overview
    2. 3.2. Global Ophthalmic Drugs Market Share, by Disease, 2019 & 2026 (USD Billion)
    3. 3.3. Dry Eye
      1. 3.3.1. Global Dry Eye Ophthalmic Drugs Market, 2016 – 2026 (USD Billion)
    4. 3.4. Eye Allergy
      1. 3.4.1. Global Eye Allergy Ophthalmic Drugs Market, 2016 – 2026 (USD Billion)
    5. 3.5. Glaucoma
      1. 3.5.1. Global Glaucoma Ophthalmic Drugs Market, 2016 – 2026 (USD Billion)
    6. 3.6. Eye Infection
      1. 3.6.1. Global Eye Infection Ophthalmic Drugs Market, 2016 – 2026 (USD Billion)
    7. 3.7. Retinal Disorders
      1. 3.7.1. Global Retinal Disorders Ophthalmic Drugs Market, 2016 – 2026 (USD Billion)
    8. 3.8. Uveitis
      1. 3.8.1. Global Uveitis Ophthalmic Drugs Market, 2016 – 2026 (USD Billion)
    9. 3.9. Others
      1. 3.9.1. Global Others Ophthalmic Drugs Market, 2016 – 2026 (USD Billion)
  4. Chapter 4 Ophthalmic Drugs Market – Dosage Analysis
    1. 4.1. Global Ophthalmic Drugs Market – Dosage Overview
    2. 4.2. Global Ophthalmic Drugs Market Share, by Dosage, 2019 & 2026 (USD Billion)
    3. 4.3. Gels
      1. 4.3.1. Global Gels Ophthalmic Drugs Market, 2016 – 2026 (USD Billion)
    4. 4.4. Eye Solutions
      1. 4.4.1. Global Eye Solutions Ophthalmic Drugs Market, 2016 – 2026 (USD Billion)
    5. 4.5. Capsules & Tablets
      1. 4.5.1. Global Capsules & Tablets Ophthalmic Drugs Market, 2016 – 2026 (USD Billion)
    6. 4.6. Eye Drops
      1. 4.6.1. Global Eye Drops Ophthalmic Drugs Market, 2016 – 2026 (USD Billion)
    7. 4.7. Ointments
      1. 4.7.1. Global Ointments Ophthalmic Drugs Market, 2016 – 2026 (USD Billion)
  5. Chapter 5 Ophthalmic Drugs Market – Route of Administration Analysis
    1. 5.1. Global Ophthalmic Drugs Market – Route of Administration Overview
    2. 5.2. Global Ophthalmic Drugs Market Share, by Route of Administration, 2019 & 2026 (USD Billion)
    3. 5.3. Topical
      1. 5.3.1. Global Topical Ophthalmic Drugs Market, 2016 – 2026 (USD Billion)
    4. 5.4. Local Ocular
      1. 5.4.1. Global Local Ocular Ophthalmic Drugs Market, 2016 – 2026 (USD Billion)
    5. 5.5. Systematic
      1. 5.5.1. Global Systematic Ophthalmic Drugs Market, 2016 – 2026 (USD Billion)
  6. Chapter 6 Ophthalmic Drugs Market – Product Analysis
    1. 6.1. Global Ophthalmic Drugs Market – Product Overview
    2. 6.2. Global Ophthalmic Drugs Market Share, by Product, 2019 & 2026 (USD Billion)
    3. 6.3. Prescription Drugs
      1. 6.3.1. Global Prescription Drugs Ophthalmic Drugs Market, 2016 – 2026 (USD Billion)
    4. 6.4. OTC
      1. 6.4.1. Global OTC Ophthalmic Drugs Market, 2016 – 2026 (USD Billion)
  7. Chapter 7 Ophthalmic Drugs Market – Regional Analysis
    1. 7.1. Global Ophthalmic Drugs Market Regional Overview
    2. 7.2. Global Ophthalmic Drugs Market Share, by Region, 2019 & 2026 (USD Billion)
    3. 7.3. North America
      1. 7.3.1. North America Ophthalmic Drugs Market, 2016 – 2026 (USD Billion)
        1. 7.3.1.1. North America Ophthalmic Drugs Market, by Country, 2016 - 2026 (USD Billion)
      2. 7.3.2. North America Ophthalmic Drugs Market, by Drug Class, 2016 – 2026
        1. 7.3.2.1. North America Ophthalmic Drugs Market, by Drug Class, 2016 – 2026 (USD Billion)
      3. 7.3.3. North America Ophthalmic Drugs Market, by Disease, 2016 – 2026
        1. 7.3.3.1. North America Ophthalmic Drugs Market, by Disease, 2016 – 2026 (USD Billion)
      4. 7.3.4. North America Ophthalmic Drugs Market, by Dosage, 2016 – 2026
        1. 7.3.4.1. North America Ophthalmic Drugs Market, by Dosage, 2016 – 2026 (USD Billion)
      5. 7.3.5. North America Ophthalmic Drugs Market, by Route of Administration, 2016 – 2026
        1. 7.3.5.1. North America Ophthalmic Drugs Market, by Route of Administration, 2016 – 2026 (USD Billion)
      6. 7.3.6. North America Ophthalmic Drugs Market, by Product, 2016 – 2026
        1. 7.3.6.1. North America Ophthalmic Drugs Market, by Product, 2016 – 2026 (USD Billion)
      7. 7.3.7. U.S.
        1. 7.3.7.1. U.S. Ophthalmic Drugs Market, 2016 – 2026 (USD Billion)
      8. 7.3.8. Canada
        1. 7.3.8.1. Canada Ophthalmic Drugs Market, 2016 – 2026 (USD Billion)
    4. 7.4. Europe
      1. 7.4.1. Europe Ophthalmic Drugs Market, 2016 – 2026 (USD Billion)
        1. 7.4.1.1. Europe Ophthalmic Drugs Market, by Country, 2016 - 2026 (USD Billion)
      2. 7.4.2. Europe Ophthalmic Drugs Market, by Drug Class, 2016 – 2026
        1. 7.4.2.1. Europe Ophthalmic Drugs Market, by Drug Class, 2016 – 2026 (USD Billion)
      3. 7.4.3. Europe Ophthalmic Drugs Market, by Disease, 2016 – 2026
        1. 7.4.3.1. Europe Ophthalmic Drugs Market, by Disease, 2016 – 2026 (USD Billion)
      4. 7.4.4. Europe Ophthalmic Drugs Market, by Dosage, 2016 – 2026
        1. 7.4.4.1. Europe Ophthalmic Drugs Market, by Dosage, 2016 – 2026 (USD Billion)
      5. 7.4.5. Europe Ophthalmic Drugs Market, by Route of Administration, 2016 – 2026
        1. 7.4.5.1. Europe Ophthalmic Drugs Market, by Route of Administration, 2016 – 2026 (USD Billion)
      6. 7.4.6. Europe Ophthalmic Drugs Market, by Product, 2016 – 2026
        1. 7.4.6.1. Europe Ophthalmic Drugs Market, by Product, 2016 – 2026 (USD Billion)
      7. 7.4.7. Germany
        1. 7.4.7.1. Germany Ophthalmic Drugs Market, 2016 – 2026 (USD Billion)
      8. 7.4.8. France
        1. 7.4.8.1. France Ophthalmic Drugs Market, 2016 – 2026 (USD Billion)
      9. 7.4.9. U.K.
        1. 7.4.9.1. U.K. Ophthalmic Drugs Market, 2016 – 2026 (USD Billion)
      10. 7.4.10. Italy
        1. 7.4.10.1. Italy Ophthalmic Drugs Market, 2016 – 2026 (USD Billion)
      11. 7.4.11. Spain
        1. 7.4.11.1. Spain Ophthalmic Drugs Market, 2016 – 2026 (USD Billion)
      12. 7.4.12. Rest of Europe
        1. 7.4.12.1. Rest of Europe Ophthalmic Drugs Market, 2016 – 2026 (USD Billion)
    5. 7.5. Asia Pacific
      1. 7.5.1. Asia Pacific Ophthalmic Drugs Market, 2016 – 2026 (USD Billion)
        1. 7.5.1.1. Asia Pacific Ophthalmic Drugs Market, by Country, 2016 - 2026 (USD Billion)
      2. 7.5.2. Asia Pacific Ophthalmic Drugs Market, by Drug Class, 2016 – 2026
        1. 7.5.2.1. Asia Pacific Ophthalmic Drugs Market, by Drug Class, 2016 – 2026 (USD Billion)
      3. 7.5.3. Asia Pacific Ophthalmic Drugs Market, by Disease, 2016 – 2026
        1. 7.5.3.1. Asia Pacific Ophthalmic Drugs Market, by Disease, 2016 – 2026 (USD Billion)
      4. 7.5.4. Asia Pacific Ophthalmic Drugs Market, by Dosage, 2016 – 2026
        1. 7.5.4.1. Asia Pacific Ophthalmic Drugs Market, by Dosage, 2016 – 2026 (USD Billion)
      5. 7.5.5. Asia Pacific Ophthalmic Drugs Market, by Route of Administration, 2016 – 2026
        1. 7.5.5.1. Asia Pacific Ophthalmic Drugs Market, by Route of Administration, 2016 – 2026 (USD Billion)
      6. 7.5.6. Asia Pacific Ophthalmic Drugs Market, by Product, 2016 – 2026
        1. 7.5.6.1. Asia Pacific Ophthalmic Drugs Market, by Product, 2016 – 2026 (USD Billion)
      7. 7.5.7. China
        1. 7.5.7.1. China Ophthalmic Drugs Market, 2016 – 2026 (USD Billion)
      8. 7.5.8. Japan
        1. 7.5.8.1. Japan Ophthalmic Drugs Market, 2016 – 2026 (USD Billion)
      9. 7.5.9. India
        1. 7.5.9.1. India Ophthalmic Drugs Market, 2016 – 2026 (USD Billion)
      10. 7.5.10. South Korea
        1. 7.5.10.1. South Korea Ophthalmic Drugs Market, 2016 – 2026 (USD Billion)
      11. 7.5.11. South-East Asia
        1. 7.5.11.1. South-East Asia Ophthalmic Drugs Market, 2016 – 2026 (USD Billion)
      12. 7.5.12. Rest of Asia Pacific
        1. 7.5.12.1. Rest of Asia Pacific Ophthalmic Drugs Market, 2016 – 2026 (USD Billion)
    6. 7.6. Latin America
      1. 7.6.1. Latin America Ophthalmic Drugs Market, 2016 – 2026 (USD Billion)
        1. 7.6.1.1. Latin America Ophthalmic Drugs Market, by Country, 2016 - 2026 (USD Billion)
      2. 7.6.2. Latin America Ophthalmic Drugs Market, by Drug Class, 2016 – 2026
        1. 7.6.2.1. Latin America Ophthalmic Drugs Market, by Drug Class, 2016 – 2026 (USD Billion)
      3. 7.6.3. Latin America Ophthalmic Drugs Market, by Disease, 2016 – 2026
        1. 7.6.3.1. Latin America Ophthalmic Drugs Market, by Disease, 2016 – 2026 (USD Billion)
      4. 7.6.4. Latin America Ophthalmic Drugs Market, by Dosage, 2016 – 2026
        1. 7.6.4.1. Latin America Ophthalmic Drugs Market, by Dosage, 2016 – 2026 (USD Billion)
      5. 7.6.5. Latin America Ophthalmic Drugs Market, by Route of Administration, 2016 – 2026
        1. 7.6.5.1. Latin America Ophthalmic Drugs Market, by Route of Administration, 2016 – 2026 (USD Billion)
      6. 7.6.6. Latin America Ophthalmic Drugs Market, by Product, 2016 – 2026
        1. 7.6.6.1. Latin America Ophthalmic Drugs Market, by Product, 2016 – 2026 (USD Billion)
      7. 7.6.7. Brazil
        1. 7.6.7.1. Brazil Ophthalmic Drugs Market, 2016 – 2026 (USD Billion)
      8. 7.6.8. Mexico
        1. 7.6.8.1. Mexico Ophthalmic Drugs Market, 2016 – 2026 (USD Billion)
      9. 7.6.9. Rest of Latin America
        1. 7.6.9.1. Rest of Latin America Ophthalmic Drugs Market, 2016 – 2026 (USD Billion)
    7. 7.7. The Middle-East and Africa
      1. 7.7.1. The Middle-East and Africa Ophthalmic Drugs Market, 2016 – 2026 (USD Billion)
        1. 7.7.1.1. The Middle-East and Africa Ophthalmic Drugs Market, by Country, 2016 - 2026 (USD Billion)
      2. 7.7.2. The Middle-East and Africa Ophthalmic Drugs Market, by Drug Class, 2016 – 2026
        1. 7.7.2.1. The Middle-East and Africa Ophthalmic Drugs Market, by Drug Class, 2016 – 2026 (USD Billion)
      3. 7.7.3. The Middle-East and Africa Ophthalmic Drugs Market, by Disease, 2016 – 2026
        1. 7.7.3.1. The Middle-East and Africa Ophthalmic Drugs Market, by Disease, 2016 – 2026 (USD Billion)
      4. 7.7.4. The Middle-East and Africa Ophthalmic Drugs Market, by Dosage, 2016 – 2026
        1. 7.7.4.1. The Middle-East and Africa Ophthalmic Drugs Market, by Dosage, 2016 – 2026 (USD Billion)
      5. 7.7.5. The Middle-East and Africa Ophthalmic Drugs Market, by Route of Administration, 2016 – 2026
        1. 7.7.5.1. The Middle-East and Africa Ophthalmic Drugs Market, by Route of Administration, 2016 – 2026 (USD Billion)
      6. 7.7.6. The Middle-East and Africa Ophthalmic Drugs Market, by Product, 2016 – 2026
        1. 7.7.6.1. The Middle-East and Africa Ophthalmic Drugs Market, by Product, 2016 – 2026 (USD Billion)
      7. 7.7.7. GCC Countries
        1. 7.7.7.1. GCC Countries Ophthalmic Drugs Market, 2016 – 2026 (USD Billion)
      8. 7.7.8. South Africa
        1. 7.7.8.1. South Africa Ophthalmic Drugs Market, 2016 – 2026 (USD Billion)
      9. 7.7.9. Rest of Middle-East Africa
        1. 7.7.9.1. Rest of Middle-East Africa Ophthalmic Drugs Market, 2016 – 2026 (USD Billion)
  8. Chapter 8 Ophthalmic Drugs Market – Competitive Landscape
    1. 8.1. Competitor Market Share – Revenue
    2. 8.2. Market Concentration Rate Analysis, Top 3 and Top 5 Players
    3. 8.3. Strategic Developments
      1. 8.3.1. Acquisitions and Mergers
      2. 8.3.2. New Products
      3. 8.3.3. Research & Development Activities
  9. Chapter 9 Company Profiles
    1. 9.1. Alcon
      1. 9.1.1. Company Overview
      2. 9.1.2. Product/Service Portfolio
      3. 9.1.3. Alcon Sales, Revenue, and Gross Margin
      4. 9.1.4. Alcon Revenue and Growth Rate
      5. 9.1.5. Alcon Market Share
      6. 9.1.6. Recent Initiatives, Funding/VC Activities, and Technological Innovations
    2. 9.2. Johnson & Johnson Services Inc
      1. 9.2.1. Company Overview
      2. 9.2.2. Product/Service Portfolio
      3. 9.2.3. Johnson & Johnson Services Inc Sales, Revenue, and Gross Margin
      4. 9.2.4. Johnson & Johnson Services Inc Revenue and Growth Rate
      5. 9.2.5. Johnson & Johnson Services Inc Market Share
      6. 9.2.6. Recent Initiatives, Funding/VC Activities, and Technological Innovations
    3. 9.3. Bausch Health
      1. 9.3.1. Company Overview
      2. 9.3.2. Product/Service Portfolio
      3. 9.3.3. Bausch Health Sales, Revenue, and Gross Margin
      4. 9.3.4. Bausch Health Revenue and Growth Rate
      5. 9.3.5. Bausch Health Market Share
      6. 9.3.6. Recent Initiatives, Funding/VC Activities, and Technological Innovations
    4. 9.4. Allergan
      1. 9.4.1. Company Overview
      2. 9.4.2. Product/Service Portfolio
      3. 9.4.3. Allergan Sales, Revenue, and Gross Margin
      4. 9.4.4. Allergan Revenue and Growth Rate
      5. 9.4.5. Allergan Market Share
      6. 9.4.6. Recent Initiatives, Funding/VC Activities, and Technological Innovations
    5. 9.5. Pfizer Inc
      1. 9.5.1. Company Overview
      2. 9.5.2. Product/Service Portfolio
      3. 9.5.3. Pfizer Inc Sales, Revenue, and Gross Margin
      4. 9.5.4. Pfizer Inc Revenue and Growth Rate
      5. 9.5.5. Pfizer Inc Market Share
      6. 9.5.6. Recent Initiatives, Funding/VC Activities, and Technological Innovations
    6. 9.6. Bayer AG
      1. 9.6.1. Company Overview
      2. 9.6.2. Product/Service Portfolio
      3. 9.6.3. Bayer AG Sales, Revenue, and Gross Margin
      4. 9.6.4. Bayer AG Revenue and Growth Rate
      5. 9.6.5. Bayer AG Market Share
      6. 9.6.6. Recent Initiatives, Funding/VC Activities, and Technological Innovations
    7. 9.7. Santen Pharmaceutical Co. Ltd
      1. 9.7.1. Company Overview
      2. 9.7.2. Product/Service Portfolio
      3. 9.7.3. Santen Pharmaceutical Co. Ltd Sales, Revenue, and Gross Margin
      4. 9.7.4. Santen Pharmaceutical Co. Ltd Revenue and Growth Rate
      5. 9.7.5. Santen Pharmaceutical Co. Ltd Market Share
      6. 9.7.6. Recent Initiatives, Funding/VC Activities, and Technological Innovations
    8. 9.8. Genetech IncNovartis AG
      1. 9.8.1. Company Overview
      2. 9.8.2. Product/Service Portfolio
      3. 9.8.3. Genetech IncNovartis AG Sales, Revenue, and Gross Margin
      4. 9.8.4. Genetech IncNovartis AG Revenue and Growth Rate
      5. 9.8.5. Genetech IncNovartis AG Market Share
      6. 9.8.6. Recent Initiatives, Funding/VC Activities, and Technological Innovations
    9. 9.9. Regeneron
      1. 9.9.1. Company Overview
      2. 9.9.2. Product/Service Portfolio
      3. 9.9.3. Regeneron Sales, Revenue, and Gross Margin
      4. 9.9.4. Regeneron Revenue and Growth Rate
      5. 9.9.5. Regeneron Market Share
      6. 9.9.6. Recent Initiatives, Funding/VC Activities, and Technological Innovations
    10. 9.10. Merck & Co
      1. 9.10.1. Company Overview
      2. 9.10.2. Product/Service Portfolio
      3. 9.10.3. Merck & Co Sales, Revenue, and Gross Margin
      4. 9.10.4. Merck & Co Revenue and Growth Rate
      5. 9.10.5. Merck & Co Market Share
      6. 9.10.6. Recent Initiatives, Funding/VC Activities, and Technological Innovations
    11. 9.11. Coherus Biosciences Inc
      1. 9.11.1. Company Overview
      2. 9.11.2. Product/Service Portfolio
      3. 9.11.3. Coherus Biosciences Inc Sales, Revenue, and Gross Margin
      4. 9.11.4. Coherus Biosciences Inc Revenue and Growth Rate
      5. 9.11.5. Coherus Biosciences Inc Market Share
      6. 9.11.6. Recent Initiatives, Funding/VC Activities, and Technological Innovations
    12. 9.12. AbbVie Inc
      1. 9.12.1. Company Overview
      2. 9.12.2. Product/Service Portfolio
      3. 9.12.3. AbbVie Inc Sales, Revenue, and Gross Margin
      4. 9.12.4. AbbVie Inc Revenue and Growth Rate
      5. 9.12.5. AbbVie Inc Market Share
      6. 9.12.6. Recent Initiatives, Funding/VC Activities, and Technological Innovations
      7. 9.13. F. Hoffmann-La Roche Ltd
      8. 9.13.1. Company Overview
      9. 9.13.2. Product/Service Portfolio
        1. 9.13.3. F. Hoffmann-La Roche Ltd Sales, Revenue, and Gross Margin
        2. 9.13.4. F. Hoffmann-La Roche Ltd Revenue and Growth Rate
        3. 9.13.5. F. Hoffmann-La Roche Ltd Market Share
      10. 9.13.6. Recent Initiatives, Funding/VC Activities, and Technological Innovations
    13. 9.14. Teva Pharmaceutical Industries Ltd
      1. 9.14.1. Company Overview
      2. 9.14.2. Product/Service Portfolio
      3. 9.14.3. Teva Pharmaceutical Industries Ltd Sales, Revenue, and Gross Margin
      4. 9.14.4. Teva Pharmaceutical Industries Ltd Revenue and Growth Rate
      5. 9.14.5. Teva Pharmaceutical Industries Ltd Market Share
      6. 9.14.6. Recent Initiatives, Funding/VC Activities, and Technological Innovations
    14. 9.15. Sun Pharmaceutical Industries Ltd.
      1. 9.15.1. Company Overview
      2. 9.15.2. Product/Service Portfolio
      3. 9.15.3. Sun Pharmaceutical Industries Ltd. Sales, Revenue, and Gross Margin
      4. 9.15.4. Sun Pharmaceutical Industries Ltd. Revenue and Growth Rate
      5. 9.15.5. Sun Pharmaceutical Industries Ltd. Market Share
      6. 9.15.6. Recent Initiatives, Funding/VC Activities, and Technological Innovations
  10. Chapter 10 Ophthalmic Drugs — Industry Analysis
    1. 10.1. Introduction and Taxonomy
    2. 10.2. Ophthalmic Drugs Market – Key Trends
      1. 10.2.1. Market Drivers
      2. 10.2.2. Market Restraints
      3. 10.2.3. Market Opportunities
    3. 10.3. Value Chain Analysis
    4. 10.4. Key Mandates and Regulations
    5. 10.5. Technology Roadmap and Timeline
    6. 10.6. Ophthalmic Drugs Market – Attractiveness Analysis
      1. 10.6.1. By Drug Class
      2. 10.6.2. By Disease
      3. 10.6.3. By Dosage
      4. 10.6.4. By Route of Administration
      5. 10.6.5. By Product
      6. 10.6.6. By Region
  11. Chapter 11 Industrial Chain, Sourcing Strategy, and Downstream Buyers
    1. 11.1. Ophthalmic Drugs Industrial Chain Analysis
    2. 11.2. Downstream Buyers
    3. 11.3. Distributors/Traders List
  12. Chapter 12 Marketing Strategy Analysis
    1. 12.1. Marketing Channel
    2. 12.2. Direct Marketing
    3. 12.3. Indirect Marketing
    4. 12.4. Marketing Channel Development Trends
    5. 12.5. Economic/Political Environmental Change
  13. Chapter 13 Report Conclusion & Key Insights
    1. 13.1. Key Insights from Primary Interviews & Surveys Respondents
    2. 13.2. Key Takeaways from Analysts, Consultants, and Industry Leaders
  14. Chapter 14 Research Approach & Methodology
    1. 14.1. Report Description
    2. 14.2. Research Scope
    3. 14.3. Research Methodology
      1. 14.3.1. Secondary Research
      2. 14.3.2. Primary Research
      3. 14.3.3. Statistical Models
        1. 14.3.3.1. Company Share Analysis Model
        2. 14.3.3.2. Revenue Based Modeling
      4. 14.3.4. Research Limitations

      List of Figures

      Fig.1	Product Picture of Ophthalmic Drugs
      Fig.2	Global Ophthalmic Drugs Market, 2016 – 2026 (USD Billion)
      Fig.3	Global Ophthalmic Drugs Market Absolute Revenue Opportunity, 2016 – 2026 (USD Billion)
      Fig.4	Global Ophthalmic Drugs Market Incremental Revenue Opportunity, 2020 – 2026 (USD Billion)
      Fig.5	Global Ophthalmic Drugs Market Share, by Drug Class, 2019 & 2026 (USD Billion)
      Fig.6	Global Antiallergy  Ophthalmic Drugs Market, 2016 – 2026 (USD Billion)
      Fig.7	Global Anti-VEGF Agents  Ophthalmic Drugs Market, 2016 – 2026 (USD Billion)
      Fig.8	Global Anti-Inflammatory Ophthalmic Drugs Market, 2016 – 2026 (USD Billion)
      Fig.9	Global Antiglaucoma Ophthalmic Drugs Market, 2016 – 2026 (USD Billion)
      Fig.10	Global Others Ophthalmic Drugs Market, 2016 – 2026 (USD Billion)
      Fig.11	Global Ophthalmic Drugs Market Share, by Disease, 2019 & 2026 (USD Billion)
      Fig.12	Global Dry Eye  Ophthalmic Drugs Market, 2016 – 2026 (USD Billion)
      Fig.13	Global Eye Allergy  Ophthalmic Drugs Market, 2016 – 2026 (USD Billion)
      Fig.14	Global Glaucoma  Ophthalmic Drugs Market, 2016 – 2026 (USD Billion)
      Fig.15	Global Eye Infection  Ophthalmic Drugs Market, 2016 – 2026 (USD Billion)
      Fig.16	Global Retinal Disorders  Ophthalmic Drugs Market, 2016 – 2026 (USD Billion)
      Fig.17	Global Uveitis  Ophthalmic Drugs Market, 2016 – 2026 (USD Billion)
      Fig.18	Global Others Ophthalmic Drugs Market, 2016 – 2026 (USD Billion)
      Fig.19	Global Ophthalmic Drugs Market Share, by Dosage, 2019 & 2026 (USD Billion)
      Fig.20	Global Gels Ophthalmic Drugs Market, 2016 – 2026 (USD Billion)
      Fig.21	Global Eye Solutions  Ophthalmic Drugs Market, 2016 – 2026 (USD Billion)
      Fig.22	Global Capsules & Tablets  Ophthalmic Drugs Market, 2016 – 2026 (USD Billion)
      Fig.23	Global Eye Drops  Ophthalmic Drugs Market, 2016 – 2026 (USD Billion)
      Fig.24	Global Ointments Ophthalmic Drugs Market, 2016 – 2026 (USD Billion)
      Fig.25	Global Ophthalmic Drugs Market Share, by Route of Administration, 2019 & 2026 (USD Billion)
      Fig.26	Global Topical  Ophthalmic Drugs Market, 2016 – 2026 (USD Billion)
      Fig.27	Global Local Ocular Ophthalmic Drugs Market, 2016 – 2026 (USD Billion)
      Fig.28	Global Systematic Ophthalmic Drugs Market, 2016 – 2026 (USD Billion)
      Fig.29	Global Ophthalmic Drugs Market Share, by Product, 2019 & 2026 (USD Billion)
      Fig.30	Global Prescription Drugs  Ophthalmic Drugs Market, 2016 – 2026 (USD Billion)
      Fig.31	Global OTC Ophthalmic Drugs Market, 2016 – 2026 (USD Billion)
      Fig.32	Global Ophthalmic Drugs Market Share, by Region, 2019 & 2026 (USD Billion)
      Fig.33	North America Ophthalmic Drugs Market, 2016 – 2026 (USD Billion)
      Fig.34	U.S. Ophthalmic Drugs Market, 2016 – 2026 (USD Billion)
      Fig.35	Canada Ophthalmic Drugs Market, 2016 – 2026 (USD Billion)
      Fig.36	Europe Ophthalmic Drugs Market, 2016 – 2026 (USD Billion)
      Fig.37	Germany Ophthalmic Drugs Market, 2016 – 2026 (USD Billion)
      Fig.38	France Ophthalmic Drugs Market, 2016 – 2026 (USD Billion)
      Fig.39	U.K. Ophthalmic Drugs Market, 2016 – 2026 (USD Billion)
      Fig.40	Italy Ophthalmic Drugs Market, 2016 – 2026 (USD Billion)
      Fig.41	Spain Ophthalmic Drugs Market, 2016 – 2026 (USD Billion)
      Fig.42	Rest of Europe Ophthalmic Drugs Market, 2016 – 2026 (USD Billion)
      Fig.43	Asia Pacific Ophthalmic Drugs Market, 2016 – 2026 (USD Billion)
      Fig.44	China Ophthalmic Drugs Market, 2016 – 2026 (USD Billion)
      Fig.45	Japan Ophthalmic Drugs Market, 2016 – 2026 (USD Billion)
      Fig.46	India Ophthalmic Drugs Market, 2016 – 2026 (USD Billion)
      Fig.47	South  Korea Ophthalmic Drugs Market, 2016 – 2026 (USD Billion)
      Fig.48	South-East Asia Ophthalmic Drugs Market, 2016 – 2026 (USD Billion)
      Fig.49	Rest of Asia Pacific Ophthalmic Drugs Market, 2016 – 2026 (USD Billion)
      Fig.50	Latin America Ophthalmic Drugs Market, 2016 – 2026 (USD Billion)
      Fig.51	Brazil Ophthalmic Drugs Market, 2016 – 2026 (USD Billion)
      Fig.52	Mexico Ophthalmic Drugs Market, 2016 – 2026 (USD Billion)
      Fig.53	Rest of Latin America Ophthalmic Drugs Market, 2016 – 2026 (USD Billion)
      Fig.54	The Middle-East and Africa Ophthalmic Drugs Market, 2016 – 2026 (USD Billion)
      Fig.55	GCC Countries Ophthalmic Drugs Market, 2016 – 2026 (USD Billion)
      Fig.56	South Africa Ophthalmic Drugs Market, 2016 – 2026 (USD Billion)
      Fig.57	Rest of Middle-East Africa Ophthalmic Drugs Market, 2016 – 2026 (USD Billion)
      Fig.58	Competitor Market Share – Revenue
      Fig.59	Alcon Revenue and Growth Rate
      Fig.60	Alcon Market Share
      Fig.61	Johnson & Johnson Services Inc Revenue and Growth Rate
      Fig.62	Johnson & Johnson Services Inc Market Share
      Fig.63	Bausch Health Revenue and Growth Rate
      Fig.64	Bausch Health Market Share
      Fig.65	Allergan Revenue and Growth Rate
      Fig.66	Allergan Market Share
      Fig.67	Pfizer Inc Revenue and Growth Rate
      Fig.68	Pfizer Inc Market Share
      Fig.69	Bayer AG Revenue and Growth Rate
      Fig.70	Bayer AG Market Share
      Fig.71	Santen Pharmaceutical Co. Ltd Revenue and Growth Rate
      Fig.72	Santen Pharmaceutical Co. Ltd Market Share
      Fig.73	Genetech IncNovartis AG Revenue and Growth Rate
      Fig.74	Genetech IncNovartis AG Market Share
      Fig.75	Regeneron Revenue and Growth Rate
      Fig.76	Regeneron Market Share
      Fig.77	Merck & Co Revenue and Growth Rate
      Fig.78	Merck & Co Market Share
      Fig.79	Coherus Biosciences Inc Revenue and Growth Rate
      Fig.80	Coherus Biosciences Inc Market Share
      Fig.81	AbbVie Inc Revenue and Growth Rate
      Fig.82	AbbVie Inc Market Share
      Fig.83	F. Hoffmann-La Roche Ltd Revenue and Growth Rate
      Fig.84	F. Hoffmann-La Roche Ltd Market Share
      Fig.85	Teva Pharmaceutical Industries Ltd Revenue and Growth Rate
      Fig.86	Teva Pharmaceutical Industries Ltd Market Share
      Fig.87	Sun Pharmaceutical Industries Ltd. Revenue and Growth Rate
      Fig.88	Sun Pharmaceutical Industries Ltd. Market Share
      Fig.89	Market Dynamics
      Fig.90	Global Ophthalmic Drugs – Value Chain Analysis
      Fig.91	Key Mandates and Regulations
      Fig.92	Technology Roadmap and Timeline
      Fig.93	Market Attractiveness Analysis – By Drug Class
      Fig.94	Market Attractiveness Analysis – By Disease
      Fig.95	Market Attractiveness Analysis – By Dosage
      Fig.96	Market Attractiveness Analysis – By Route of Administration
      Fig.97	Market Attractiveness Analysis – By Product
      Fig.98	Market Attractiveness Analysis – By Region
      Fig.99	Ophthalmic Drugs Industrial Chain Analysis
      Fig.100	Market Channels
      Fig.101	Marketing Channel Development Trend
      Fig.102	Growth in World Gross Product, 2008-2018
      

      List of Tables

      Table 1	Global Ophthalmic Drugs Market, 2019 & 2026 (USD Billion)
      Table 2	Global Ophthalmic Drugs Market, by Drug Class, 2016 – 2026 (USD Billion)
      Table 3	Global Ophthalmic Drugs Market, by Disease, 2016 – 2026 (USD Billion)
      Table 4	Global Ophthalmic Drugs Market, by Dosage, 2016 – 2026 (USD Billion)
      Table 5	Global Ophthalmic Drugs Market, by Route of Administration, 2016 – 2026 (USD Billion)
      Table 6	Global Ophthalmic Drugs Market, by Product, 2016 – 2026 (USD Billion)
      Table 7	Global Ophthalmic Drugs Market, by Region, 2016 – 2026 (USD Billion)
      Table 8	North America Ophthalmic Drugs Market, by Country, 2016 – 2026 (USD Billion)
      Table 9	North America Ophthalmic Drugs Market, by Drug Class, 2016 – 2026 (USD Billion)
      Table 10 North America Ophthalmic Drugs Market, by Disease, 2016 – 2026 (USD Billion)
      Table 11 North America Ophthalmic Drugs Market, by Dosage, 2016 – 2026 (USD Billion)
      Table 12 North America Ophthalmic Drugs Market, by Route of Administration, 2016 – 2026 (USD Billion)
      Table 13 North America Ophthalmic Drugs Market, by Product, 2016 – 2026 (USD Billion)
      Table 14 Europe Ophthalmic Drugs Market, by Country, 2016 – 2026 (USD Billion)
      Table 15 Europe Ophthalmic Drugs Market, by Drug Class, 2016 – 2026 (USD Billion)
      Table 16 Europe Ophthalmic Drugs Market, by Disease, 2016 – 2026 (USD Billion)
      Table 17 Europe Ophthalmic Drugs Market, by Dosage, 2016 – 2026 (USD Billion)
      Table 18 Europe Ophthalmic Drugs Market, by Route of Administration, 2016 – 2026 (USD Billion)
      Table 19 Europe Ophthalmic Drugs Market, by Product, 2016 – 2026 (USD Billion)
      Table 20 Asia Pacific Ophthalmic Drugs Market, by Country, 2016 – 2026 (USD Billion)
      Table 21 Asia Pacific Ophthalmic Drugs Market, by Drug Class, 2016 – 2026 (USD Billion)
      Table 22 Asia Pacific Ophthalmic Drugs Market, by Disease, 2016 – 2026 (USD Billion)
      Table 23 Asia Pacific Ophthalmic Drugs Market, by Dosage, 2016 – 2026 (USD Billion)
      Table 24 Asia Pacific Ophthalmic Drugs Market, by Route of Administration, 2016 – 2026 (USD Billion)
      Table 25 Asia Pacific Ophthalmic Drugs Market, by Product, 2016 – 2026 (USD Billion)
      Table 26 Latin America Ophthalmic Drugs Market, by Country, 2016 – 2026 (USD Billion)
      Table 27 Latin America Ophthalmic Drugs Market, by Drug Class, 2016 – 2026 (USD Billion)
      Table 28 Latin America Ophthalmic Drugs Market, by Disease, 2016 – 2026 (USD Billion)
      Table 29 Latin America Ophthalmic Drugs Market, by Dosage, 2016 – 2026 (USD Billion)
      Table 30 Latin America Ophthalmic Drugs Market, by Route of Administration, 2016 – 2026 (USD Billion)
      Table 31 Latin America Ophthalmic Drugs Market, by Product, 2016 – 2026 (USD Billion)
      Table 32 The Middle-East and Africa Ophthalmic Drugs Market, by Country, 2016 – 2026 (USD Billion)
      Table 33 The Middle-East and Africa Ophthalmic Drugs Market, by Drug Class, 2016 – 2026 (USD Billion)
      Table 34 The Middle-East and Africa Ophthalmic Drugs Market, by Disease, 2016 – 2026 (USD Billion)
      Table 35 The Middle-East and Africa Ophthalmic Drugs Market, by Dosage, 2016 – 2026 (USD Billion)
      Table 36 The Middle-East and Africa Ophthalmic Drugs Market, by Route of Administration, 2016 – 2026 (USD Billion)
      Table 37 The Middle-East and Africa Ophthalmic Drugs Market, by Product, 2016 – 2026 (USD Billion)
      Table 38 Global Ophthalmic Drugs Market - Company Revenue Analysis, 2016 – 2019 (USD Billion)
      Table 39 Global Ophthalmic Drugs Market - Company Revenue Share Analysis, 2016 – 2019 (%)
      Table 40 Acquisitions and Mergers
      Table 41 Market Drivers – Impact Analysis
      Table 42 Market Restraints
      Table 43 Market Opportunities
      Table 44 Major Buyers of Ophthalmic Drugs
      Table 45 Distributors/Traders of Ophthalmic Drugs by Region
      

Industry Major Market Players

  • Alcon
  • Johnson & Johnson Services Inc.
  • Bausch Health
  • Allergan
  • Pfizer Inc.
  • Bayer AG
  • Santen Pharmaceutical Co. Ltd.
  • Genetech Inc.
  • Novartis AG
  • Regeneron
  • Merck & Co.
  • Coherus Biosciences Inc.
  • AbbVie Inc.
  • F. Hoffmann-La Roche Ltd.
  • Teva Pharmaceutical Industries Ltd.
  • Sun Pharmaceutical Industries Ltd.