Search Market Research Report

Discover Our Latest Reports
Discover Our Featured Reports
Discover Top Selling Reports

Online Travel Agency Market Size, Share Global Analysis Report, 2020–2026

report img

Online Travel Agency Market By Type (B2B, B2C) and By Application (Vacation, Hotel, Travel and Other segments): Global Industry Perspective, Comprehensive Analysis, and Forecast 2020–2026

Industry Insights

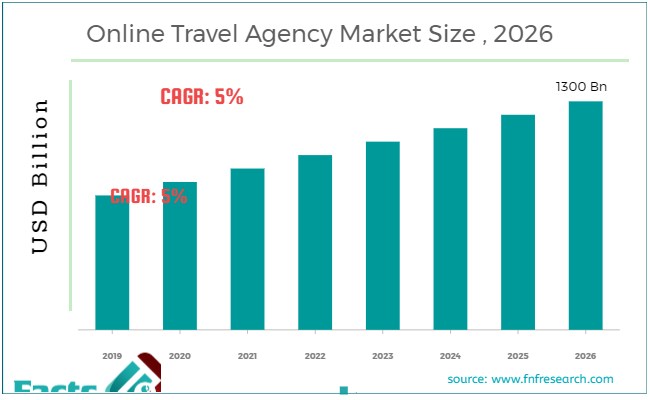
According to the report published by Facts & Factors, the global Online Travel Agency Market size was worth around USD 830 million in 2019 and is predicted to grow around USD 1300 million by 2026 with a compound annual growth rate (CAGR) of roughly 5% between 2020 and 2026. The report analyzes the global Online Travel Agency Market drivers, restraints/challenges, and the effect they have on the demands during the projection period. In addition, the report explores emerging opportunities in the Online Travel Agency Market.

Online Travel Agency Market

To know more about this report | Request Free Sample Copy

The report includes the global and regional outlook as well as a review of the online travel agency industry. The research shows statistical data from 2016 to 2019, along with a revenue-based (USD trillion) projection from 2020 to 2026. Additionally, the market growth drivers, opportunities, limitations, and trends are also included in the Online Travel Agency Market report.

We have included industry analysis models in our report and extensively demonstrated the key business strategies and competitive landscape of the Online Travel Agency market in our study.

Our study also includes an analysis of Porter’s Five Forces framework for understanding the competitive strategies used by market competitors. It also encompasses PESTLE analysis and SWOT analysis.

logoKey Insights from Primary Research

  • As per our primary respondents, the global online travel agency market is set to grow annually at a rate of around 5%.
  • It was established through primary research that the global online travel agency market was valued at around USD 830 billion in 2019.
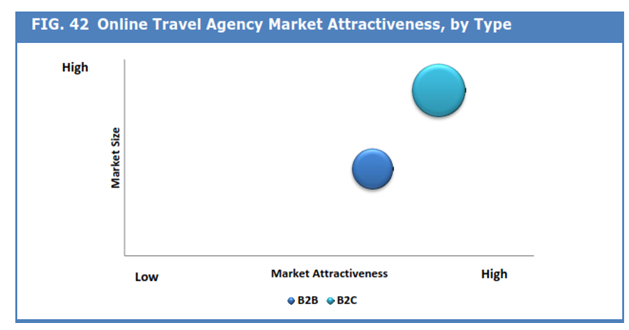
  • The “B2C” category, on the basis of type segmentation, was the leading revenue-generating category accounting for around 64% share, in 2019.
  • On the basis of application segmentation, the “Hotel” category held the leading share around 41%, in 2019.

logoKey Recommendations from Analysts

  • As per our analysis, prices of the online travel agency and its derivatives vary in each region and hence similar revenue ratio does not follow for each main region.
  • The growing technologies like Artificial Intelligence; Machine learning can be used as the biggest opportunity for the travel industry for data gathering and analysis.
  • Our analysts have identified “B2C” and “Hotel” categories as the leading investment pockets for the Global online travel agency market in terms of type and application segmentation respectively.

logoMarket Attractiveness – By Type

Global Online Travel Agency Market

To know more about this report | Request Free Sample Copy

The report also offers an in-depth analysis of the market share of each industry player and gives an outline of the market position of key players in the Online Travel Agency Market. Moreover, the study offers wide coverage of key strategic improvements witnessed in the market such as acquisitions & mergers, new product launches, agreements, partnerships, collaborations & joint ventures, R&D activities, and geographical expansion of key players of the Online Travel Agency Market.

The study provides a definitive view of the demand for online travel agencies by segmenting the market for online travel agencies dependent on size, service, and regions. Both markets were evaluated on the basis of current and future developments, and the demand is forecast from 2020 through 2026. The regional segmentation includes the current and forecast demand for North America, Europe, Asia Pacific, Latin America, and the Middle East and Africa.

The use of smartphones and the rise in disposable income is the trending factor for this market. Apparently, easy cancellation, personalized deals, and on-call customer service have accelerated the industry. The Online Travel Agency Market is segmented based on Type and Application. Type-wise, the market is classified into B2B and B2C. In terms of application, the market segment is sectored into Vacation, Hotel, Travel and Other segments.

logoReport Scope

Report Attribute

Details

Market Size in 2019

USD 830 Billion

Projected Market Size in 2026

USD 1300 Billion

CAGR Growth Rate

5% CAGR

Base Year

2019

Forecast Years

2020-2026

Key Market Players

TBO, Trip.com group limited, Alibaba group holding limited, Tuniu corporation, Tongcheng-Elong holdings limited, Hays travel limited, Bookings holdings Inc., Qunar, Airbnb Inc., Shanghai Lvmama Xniglv International Travel Agency, Mafengwo, Expedia Group, Inc., Trip advisor Inc., and others.

Key Segment

By Type , Application, and Region

Major Regions Covered

North America, Europe, Asia Pacific, Latin America, and the Middle East &, Africa

Purchase Options

Request customized purchase options to meet your research needs. Explore purchase options

logoKey players operating in the Online Travel Agency industry are

  •  TBO,Trip.com group limited
  • Alibaba group holding limited
  • Tuniu corporation
  • Tongcheng-Elong holdings limited
  • Hays travel limited
  • Bookings Holdings Inc.
  • Qunar
  • Airbnb Inc.
  • Shanghai Lvmama Xniglv International Travel Agency
  • Mafengwo
  • Expedia Group Inc.
  • Trip advisor Inc.

This report segments the Online Travel Agency  market as follows:

logo By Type Segment Analysis

  • B2B
  • B2C

logo By Application Segment Analysis

  •  Vacation
  • Hotel
  • Travel
  • Other segments

logoGlobal Online Travel Agency  Market: Regional Segment Analysis

  • North America
    • U.S.
    • Canada
  • Europe
    • Germany
    • France
    • UK
    • Italy
    • Spain
    • Rest of Europe
  • Asia Pacific
    • China
    • Japan
    • India
    • South Korea
    • South-East Asia
    • Rest of Asia Pacific
  • Latin America
    • Brazil
    • Mexico
    • Rest of Latin America
  • The Middle-East and Africa
    • GCC Countries
    • South Africa
    • Rest of Middle-East Africa

logoKey Pointers Addressed by the Report

  • Historical data and forecast analysis of the market
  • Drivers and Restraints affecting market dynamics
  • Exhaustive analysis about the future market trends
  • Comprehensive information about the leading market segments and region
  • Strategic developments made by the competitive players and in-depth analysis about its impact on market growth

Table of Content

  1. CHAPTER 1. Executive Summary
  2. CHAPTER 2. Online Travel Agency market – Type Analysis
    1. 2.1. Global Online Travel Agency Market – Type Overview
    2. 2.2. Global Online Travel Agency Market Share, by Type , 2018 & 2025 (USD Billion)
    3. 2.3. B2B
      1. 2.3.1. Global B2B Online Travel Agency Market, 2016-2026 (USD Billion)
    4. 2.4. B2C
      1. 2.4.1. Global B2C Online Travel Agency Market, 2016-2026 (USD Billion)
  3. CHAPTER 3. Online Travel Agency market – Application Analysis
    1. 3.1. Global Online Travel Agency Market – Application Overview
    2. 3.2. Global Online Travel Agency Market Share, by Application , 2018 & 2025 (USD Billion)
    3. 3.3. Vacation
      1. 3.3.1. Global Vacation Online Travel Agency Market, 2016-2026 (USD Billion)
    4. 3.4. Hotel
      1. 3.4.1. Global Hotel Online Travel Agency Market, 2016-2026 (USD Billion)
    5. 3.5. Travel
      1. 3.5.1. Global Travel Online Travel Agency Market, 2016-2026 (USD Billion)
    6. 3.6. Other
      1. 3.6.1. Global Other Online Travel Agency Market, 2016-2026 (USD Billion)
  4. CHAPTER 4. Online Travel Agency market – Regional Analysis
    1. 4.1. Global Online Travel Agency Market Regional Overview
    2. 4.2. Global Online Travel Agency Market Share, by Region, 2018 & 2025 (Value)
    3. 4.3. North America
      1. 4.3.1. North America Online Travel Agency Market size and forecast, 2016-2026
      2. 4.3.2. North America Online Travel Agency Market, by Country, 2018 & 2025 (USD Billion)
      3. 4.3.3. North America Online Travel Agency Market, by Type , 2016-2026
        1. 4.3.3.1. North America Online Travel Agency Market, by Type , 2016-2026 (USD Billion)
      4. 4.3.4. North America Online Travel Agency Market, by Application , 2016-2026
        1. 4.3.4.1. North America Online Travel Agency Market, by Application , 2016-2026 (USD Billion)
      5. 4.3.5. U.S.
        1. 4.3.5.1. U.S. Market size and forecast, 2016-2026 (USD Billion)
      6. 4.3.6. Canada
        1. 4.3.6.1. Canada Market size and forecast, 2016-2026 (USD Billion)
    4. 4.4. Europe
      1. 4.4.1. Europe Online Travel Agency Market size and forecast, 2016-2026
      2. 4.4.2. Europe Online Travel Agency Market, by Country, 2018 & 2025 (USD Billion)
      3. 4.4.3. Europe Online Travel Agency Market, by Type , 2016-2026
        1. 4.4.3.1. Europe Online Travel Agency Market, by Type , 2016-2026 (USD Billion)
      4. 4.4.4. Europe Online Travel Agency Market, by Application , 2016-2026
        1. 4.4.4.1. Europe Online Travel Agency Market, by Application , 2016-2026 (USD Billion)
      5. 4.4.5. Germany
        1. 4.4.5.1. Germany Market size and forecast, 2016-2026 (USD Billion)
      6. 4.4.6. France
        1. 4.4.6.1. France Market size and forecast, 2016-2026 (USD Billion)
      7. 4.4.7. U.K.
        1. 4.4.7.1. U.K. Market size and forecast, 2016-2026 (USD Billion)
      8. 4.4.8. Italy
        1. 4.4.8.1. Italy Market size and forecast, 2016-2026 (USD Billion)
      9. 4.4.9. Spain
        1. 4.4.9.1. Spain Market size and forecast, 2016-2026 (USD Billion)
      10. 4.4.10. Rest of Europe
        1. 4.4.10.1. Rest of Europe Market size and forecast, 2016-2026 (USD Billion)
    5. 4.5. Asia Pacific
      1. 4.5.1. Asia Pacific Online Travel Agency Market size and forecast, 2016-2026
      2. 4.5.2. Asia Pacific Online Travel Agency Market, by Country, 2018 & 2025 (USD Billion)
      3. 4.5.3. Asia Pacific Online Travel Agency Market, by Type , 2016-2026
        1. 4.5.3.1. Asia Pacific Online Travel Agency Market, by Type , 2016-2026 (USD Billion)
      4. 4.5.4. Asia Pacific Online Travel Agency Market, by Application , 2016-2026
        1. 4.5.4.1. Asia Pacific Online Travel Agency Market, by Application , 2016-2026 (USD Billion)
      5. 4.5.5. China
        1. 4.5.5.1. China Market size and forecast, 2016-2026 (USD Billion)
      6. 4.5.6. Japan
        1. 4.5.6.1. Japan Market size and forecast, 2016-2026 (USD Billion)
      7. 4.5.7. India
        1. 4.5.7.1. India Market size and forecast, 2016-2026 (USD Billion)
      8. 4.5.8. South Korea
        1. 4.5.8.1. South Korea Market size and forecast, 2016-2026 (USD Billion)
      9. 4.5.9. South-East Asia
        1. 4.5.9.1. South-East Asia Market size and forecast, 2016-2026 (USD Billion)
      10. 4.5.10. Rest of Asia Pacific
        1. 4.5.10.1. Rest of Asia Pacific Market size and forecast, 2016-2026 (USD Billion)
    6. 4.6. Latin America
      1. 4.6.1. Latin America Online Travel Agency Market size and forecast, 2016-2026
      2. 4.6.2. Latin America Online Travel Agency Market, by Country, 2018 & 2025 (USD Billion)
      3. 4.6.3. Latin America Online Travel Agency Market, by Type , 2016-2026
        1. 4.6.3.1. Latin America Online Travel Agency Market, by Type , 2016-2026 (USD Billion)
      4. 4.6.4. Latin America Online Travel Agency Market, by Application , 2016-2026
        1. 4.6.4.1. Latin America Online Travel Agency Market, by Application , 2016-2026 (USD Billion)
      5. 4.6.5. Brazil
        1. 4.6.5.1. Brazil Market size and forecast, 2016-2026 (USD Billion)
      6. 4.6.6. Mexico
        1. 4.6.6.1. Mexico Market size and forecast, 2016-2026 (USD Billion)
      7. 4.6.7. Rest of Latin America
        1. 4.6.7.1. Rest of Latin America Market size and forecast, 2016-2026 (USD Billion)
    7. 4.7. The Middle-East and Africa
      1. 4.7.1. The Middle-East and Africa Online Travel Agency Market size and forecast, 2016-2026
      2. 4.7.2. The Middle-East and Africa Online Travel Agency Market, by Country, 2018 & 2025 (USD Billion)
      3. 4.7.3. The Middle-East and Africa Online Travel Agency Market, by Type , 2016-2026
        1. 4.7.3.1. The Middle-East and Africa Online Travel Agency Market, by Type , 2016-2026 (USD Billion)
      4. 4.7.4. The Middle-East and Africa Online Travel Agency Market, by Application , 2016-2026
        1. 4.7.4.1. The Middle-East and Africa Online Travel Agency Market, by Application , 2016-2026 (USD Billion)
      5. 4.7.5. GCC Countries
        1. 4.7.5.1. GCC Countries Market size and forecast, 2016-2026 (USD Billion)
      6. 4.7.6. South Africa
        1. 4.7.6.1. South Africa Market size and forecast, 2016-2026 (USD Billion)
      7. 4.7.7. Rest of Middle-East Africa
        1. 4.7.7.1. Rest of Middle-East Africa Market size and forecast, 2016-2026 (USD Billion)
  5. CHAPTER 5. Online Travel Agency market – Competitive Landscape
    1. 5.1. Competitor Market Share – Revenue
    2. 5.2. Market Concentration Rate Analysis, Top 3 and Top 5 Players
    3. 5.3. Strategic Development
      1. 5.3.1. Acquisitions and Mergers
      2. 5.3.2. New Products
      3. 5.3.3. Research & Development Activities
  6. CHAPTER 6. Company Profiles
    1. 6.1. TBO
      1. 6.1.1. Company Overview
      2. 6.1.2. TBO Revenue and Gross Margin
      3. 6.1.3. Product portfolio
      4. 6.1.4. Recent initiatives
      5. 6.2. Trip.com group limited
      6. 6.2.1. Company Overview
        1. 6.2.2. Trip.com group limited Revenue and Gross Margin
      7. 6.2.3. Product portfolio
      8. 6.2.4. Recent initiatives
    2. 6.3. Alibaba group holding limited
      1. 6.3.1. Company Overview
      2. 6.3.2. Alibaba group holding limited Revenue and Gross Margin
      3. 6.3.3. Product portfolio
      4. 6.3.4. Recent initiatives
    3. 6.4. Tuniu corporation
      1. 6.4.1. Company Overview
      2. 6.4.2. Tuniu corporation Revenue and Gross Margin
      3. 6.4.3. Product portfolio
      4. 6.4.4. Recent initiatives
    4. 6.5. Tongcheng-Elong holdings limited
      1. 6.5.1. Company Overview
      2. 6.5.2. Tongcheng-Elong holdings limited Revenue and Gross Margin
      3. 6.5.3. Product portfolio
      4. 6.5.4. Recent initiatives
    5. 6.6. Hays travel limited
      1. 6.6.1. Company Overview
      2. 6.6.2. Hays travel limited Revenue and Gross Margin
      3. 6.6.3. Product portfolio
      4. 6.6.4. Recent initiatives
    6. 6.7. Bookings Holdings Inc
      1. 6.7.1. Company Overview
      2. 6.7.2. Bookings Holdings Inc Revenue and Gross Margin
      3. 6.7.3. Product portfolio
      4. 6.7.4. Recent initiatives
    7. 6.8. Qunar
      1. 6.8.1. Company Overview
      2. 6.8.2. Qunar Revenue and Gross Margin
      3. 6.8.3. Product portfolio
      4. 6.8.4. Recent initiatives
    8. 6.9. Airbnb Inc
      1. 6.9.1. Company Overview
      2. 6.9.2. Airbnb Inc Revenue and Gross Margin
      3. 6.9.3. Product portfolio
      4. 6.9.4. Recent initiatives
    9. 6.10. Shanghai Lvmama Xniglv International Travel Agency
      1. 6.10.1. Company Overview
      2. 6.10.2. Shanghai Lvmama Xniglv International Travel Agency Revenue and Gross Margin
      3. 6.10.3. Product portfolio
      4. 6.10.4. Recent initiatives
    10. 6.11. Mafengwo
      1. 6.11.1. Company Overview
      2. 6.11.2. Mafengwo Revenue and Gross Margin
      3. 6.11.3. Product portfolio
      4. 6.11.4. Recent initiatives
    11. 6.12. Expedia Group Inc
      1. 6.12.1. Company Overview
      2. 6.12.2. Expedia Group Inc Revenue and Gross Margin
      3. 6.12.3. Product portfolio
      4. 6.12.4. Recent initiatives
    12. 6.13. Trip advisor Inc.
      1. 6.13.1. Company Overview
      2. 6.13.2. Trip advisor Inc. Revenue and Gross Margin
      3. 6.13.3. Product portfolio
      4. 6.13.4. Recent initiatives
  7. CHAPTER 7. Online Travel Agency — Industry Analysis
    1. 7.1. Online Travel Agency Market – Key Trends
      1. 7.1.1. Market Drivers
      2. 7.1.2. Market Restraints
      3. 7.1.3. Market Opportunities
    2. 7.2. Value Chain Analysis
    3. 7.3. Technology Roadmap and Timeline
    4. 7.4. Online Travel Agency Market – Attractiveness Analysis
      1. 7.4.1. By Type
      2. 7.4.2. By Application
      3. 7.4.3. By Region
  8. CHAPTER 8. Marketing Strategy Analysis, Distributors
    1. 8.1. Marketing Channel
    2. 8.2. Direct Marketing
    3. 8.3. Indirect Marketing
    4. 8.4. Marketing Channel Development Trend
    5. 8.5. Economic/Political Environmental Change
  9. CHAPTER 9. Report Conclusion
  10. CHAPTER 10. Research Approach & Methodology
    1. 10.1. Report Description
    2. 10.2. Research Scope
    3. 10.3. Research Methodology
      1. 10.3.1. Secondary Research
      2. 10.3.2. Primary Research
      3. 10.3.3. Models
        1. 10.3.3.1. Company Share Analysis Model
        2. 10.3.3.2. Revenue Based Modeling
        3. 10.3.3.3. Research Limitations

        List of Figures

        FIG. 1    Global Online Travel Agency  Market, 2016-2026 (USD Billion)
        FIG. 2    Global Online Travel Agency  Market Share, by Type, 2018 & 2025 (USD Billion)
        FIG. 3    Global B2B Online Travel Agency  Market, 2016-2026 (USD Billion)
        FIG. 4    Global B2C Online Travel Agency  Market, 2016-2026 (USD Billion)
        FIG. 5    Global Online Travel Agency  Market Share, by Application, 2018 & 2025 (USD Billion)
        FIG. 6    Global Vacation Online Travel Agency  Market, 2016-2026 (USD Billion)
        FIG. 7    Global Hotel Online Travel Agency  Market, 2016-2026 (USD Billion)
        FIG. 8    Global Travel  Online Travel Agency  Market, 2016-2026 (USD Billion)
        FIG. 9    Global Other  Online Travel Agency  Market, 2016-2026 (USD Billion)
        FIG. 10    Global Online Travel Agency  Market Share, by Region, 2018 & 2025
        FIG. 11    North America Online Travel Agency  Market, 2016-2026
        FIG. 12    U.S. Online Travel Agency  Market, 2016-2026
        FIG. 13    Canada Online Travel Agency  Market, 2016-2026
        FIG. 14    Europe Online Travel Agency  Market, 2016-2026
        FIG. 15    Germany Online Travel Agency  Market, 2016-2026
        FIG. 16    France Online Travel Agency  Market, 2016-2026
        FIG. 17    U.K. Online Travel Agency  Market, 2016-2026
        FIG. 18    Italy Online Travel Agency  Market, 2016-2026
        FIG. 19    Spain Online Travel Agency  Market, 2016-2026
        FIG. 20    Rest of Europe Online Travel Agency  Market, 2016-2026
        FIG. 21    Asia Pacific Online Travel Agency  Market, 2016-2026
        FIG. 22    China Online Travel Agency  Market, 2016-2026
        FIG. 23    Japan Online Travel Agency  Market, 2016-2026
        FIG. 24    India Online Travel Agency  Market, 2016-2026
        FIG. 25    South  Korea Online Travel Agency  Market, 2016-2026
        FIG. 26    South-East Asia Online Travel Agency  Market, 2016-2026
        FIG. 27    Rest of Asia Pacific Online Travel Agency  Market, 2016-2026
        FIG. 28    Latin America Online Travel Agency  Market, 2016-2026
        FIG. 29    Brazil Online Travel Agency  Market, 2016-2026
        FIG. 30    Mexico Online Travel Agency  Market, 2016-2026
        FIG. 31    Rest of Latin America Online Travel Agency  Market, 2016-2026
        FIG. 32    The Middle-East and Africa Online Travel Agency  Market, 2016-2026
        FIG. 33    GCC Countries Online Travel Agency  Market, 2016-2026
        FIG. 34    South Africa Online Travel Agency  Market, 2016-2026
        FIG. 35    Rest of Middle-East Africa Online Travel Agency  Market, 2016-2026
        FIG. 36    Competitor Market Share – Revenue
        FIG. 37    TBO Revenue and Growth Rate
        FIG. 38    TBO Market Share
        FIG. 39    Trip.com group limited Revenue and Growth Rate
        FIG. 40    Trip.com group limited Market Share
        FIG. 41    Alibaba group holding limited Revenue and Growth Rate
        FIG. 42    Alibaba group holding limited Market Share
        FIG. 43    Tuniu corporation Revenue and Growth Rate
        FIG. 44    Tuniu corporation Market Share
        FIG. 45    Tongcheng-Elong holdings limited Revenue and Growth Rate
        FIG. 46    Tongcheng-Elong holdings limited Market Share
        FIG. 47    Hays travel limited Revenue and Growth Rate
        FIG. 48    Hays travel limited Market Share
        FIG. 49    Bookings Holdings Inc Revenue and Growth Rate
        FIG. 50    Bookings Holdings Inc Market Share
        FIG. 51    Qunar Revenue and Growth Rate
        FIG. 52    Qunar Market Share
        FIG. 53    Airbnb Inc Revenue and Growth Rate
        FIG. 54    Airbnb Inc Market Share
        FIG. 55    Shanghai Lvmama Xniglv International Travel Agency Revenue and Growth Rate
        FIG. 56    Shanghai Lvmama Xniglv International Travel Agency Market Share
        FIG. 57    Mafengwo Revenue and Growth Rate
        FIG. 58    Mafengwo Market Share
        FIG. 59    Expedia Group Inc Revenue and Growth Rate
        FIG. 60    Expedia Group Inc Market Share
        FIG. 61    Trip advisor Inc. Revenue and Growth Rate
        FIG. 62    Trip advisor Inc. Market Share
        FIG. 63    Market Dynamics
        FIG. 64    Global Online Travel Agency  – Value Chain Analysis
        FIG. 65    Technology Roadmap and Timeline
        FIG. 66    Market Attractiveness Analysis – By Type
        FIG. 67    Market Attractiveness Analysis – By Application
        FIG. 68    Market Attractiveness Analysis – By Region
        FIG. 69    Market Channel
        FIG. 70    Marketing Channel Development Trend
        FIG. 71    Growth in World Gross Product, 2008-2018


        List of Tables

        TABLE 1    Global Online Travel Agency  Market, 2018 & 2025 (USD Billion)
        TABLE 2    Global Online Travel Agency  market, by Type, 2016-2026 (USD Billion)
        TABLE 3    Global Online Travel Agency  market, by Application, 2016-2026 (USD Billion)
        TABLE 4    Global Online Travel Agency  market, by Region, 2016-2026 (USD Billion)
        TABLE 5    North America Online Travel Agency  Market, by Type, 2016-2026 (USD Billion)
        TABLE 6    North America Online Travel Agency  Market, by Application, 2016-2026 (USD Billion)
        TABLE 7    Europe Online Travel Agency  Market, by Type, 2016-2026 (USD Billion)
        TABLE 8    Europe Online Travel Agency  Market, by Application, 2016-2026 (USD Billion)
        TABLE 9    Asia Pacific Online Travel Agency  Market, by Type, 2016-2026 (USD Billion)
        TABLE 10    Asia Pacific Online Travel Agency  Market, by Application, 2016-2026 (USD Billion)
        TABLE 11    Latin America Online Travel Agency  Market, by Type, 2016-2026 (USD Billion)
        TABLE 12    Latin America Online Travel Agency  Market, by Application, 2016-2026 (USD Billion)
        TABLE 13    The Middle-East and Africa Online Travel Agency  Market, by Type, 2016-2026 (USD Billion)
        TABLE 14    The Middle-East and Africa Online Travel Agency  Market, by Application, 2016-2026 (USD Billion)
        TABLE 15    Global Online Travel Agency  Market - Company Revenue Analysis 2016-2019 (USD Billion)
        TABLE 16    Global Online Travel Agency  Market - Company Revenue Share Analysis 2016-2019(%)
        TABLE 17    Acquisitions and Mergers
        TABLE 18    New Product/Service Launch
        TABLE 19    Research & Development Activities
        TABLE 20    Market Drivers
        TABLE 21    Market Restraints
        TABLE 22    Market Opportunities

Industry Major Market Players

  •  TBO,Trip.com group limited
  • Alibaba group holding limited
  • Tuniu corporation
  • Tongcheng-Elong holdings limited
  • Hays travel limited
  • Bookings Holdings Inc.
  • Qunar
  • Airbnb Inc.
  • Shanghai Lvmama Xniglv International Travel Agency
  • Mafengwo
  • Expedia Group Inc.
  • Trip advisor Inc.