Search Market Research Report

Discover Our Latest Reports
Discover Our Featured Reports
Discover Top Selling Reports

Omega 3 Fatty Acid Market Size, Share Global Analysis Report, 2019–2026

report img

Omega 3 Fatty Acid Market By Type Analysis (Alpha-Linolenic Acid, Eicosapentaenoic Acid, and Docosahexaenoic Acid), By Application Analysis (Infant formula, Pharmaceuticals, Clinical Nutrition, Food and Beverage, Dietary Supplements, and Pet food), By Source Analysis (Fish Oil, Algal Oil, and Plant Oil), and By Region (North America, Europe, Asia Pacific, Latin America, and Middle East & Africa): Global Industry Perspective, Market Size, Statistical Research, Market Intelligence, Comprehensive Analysis, Historical Trends, and Forecast 2019–2026

Industry Insights

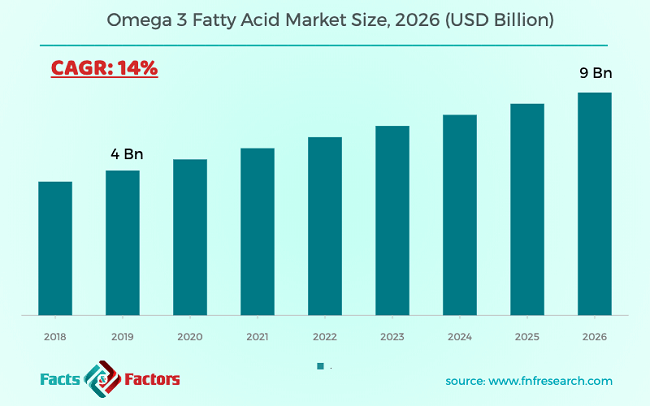
[178+ Pages Report] According to the report published by Facts Factors, the global omega 3 fatty acid market size was worth around USD 4 billion in 2019 and is predicted to grow to around USD 9 billion by 2026 with a compound annual growth rate (CAGR) of roughly 14% between 2020 and 2026. The report analyzes the global omega 3 fatty acid market drivers, restraints/challenges, and the effect they have on the demands during the projection period. In addition, the report explores emerging opportunities in the omega 3 fatty acid market.

Omega 3 Fatty Acid Market

To know more about this report | Request Free Sample Copy

This professional and specialized report study examines the technical and business perspective of the omega 3 fatty acid industry. The report provides a historical analysis of the industry as well as the projected trends expected to be witnessed in the omega 3 fatty acid market. The report study analyzes the market statistics at the global as well as the regional levels to gain an in-depth perspective of the overall omega 3 fatty acid market.

The historical insights are provided from 2016 to 2019 and projected trends are provided from 2020 to 2026. The quantitative data is provided in terms of both volume (Metric Tons) and value (USD Million) for 2016 – 2026. The qualitative data is reinforced by analyzing and providing numerous market dynamics (directly or indirectly affecting the industry) such as growth drivers, restraints, challenges, and opportunities.

We have included various industry analysis models in our report and extensively demonstrated the key business strategies and competitive landscape of the omega 3 Fatty Acid market in our study. Our study also includes an analysis of Porter’s Five Forces framework for understanding the competitive strategies adopted by various stakeholders involved in the entire value chain of the Omega 3 fatty acid market. It also encompasses PESTLE analysis and SWOT analysis.


logoKey Insights from Primary Research

  • According to interview with industry participants, the omega 3 fatty acid market is anticipated to expand at a significant rate over the forecast period i.e. a compound annual growth rate of around 14% by 2026 end over 2019 market value
  • Fish oil segment has a dominant share in the global market. This owing to the high content of the omega 3 fatty acid in the fatty fish like salmon and anchovy
  • Plant oil stands second on the basis of market share, attributed to increasing popularity for the vegan products
  • BASF SE, Cargill Incorporated, Royal DSM, and Omega Protein Corporation are some of the major market players across the globe

logoKey Recommendations from Analysts

  • As per our analyst, the omega 3 fatty acid market is fragmented in nature. There are multiple companies operating at the domestic and local level.
  • Among the application segment, the pharmaceutical segment accounts for around 27% value share in 2019
  • Dietary Supplements account for dominant market share coupled with a high growth rate over the forecast period. This is owing to the increasing health awareness and popularity for the nutraceuticals among the consumers
  • At present, the average price of the omega 3 fatty acid is around USD 23 thousand per metric ton
  • In terms of sales volume, the global market is anticipated to grow at around 11% over the forecast period

logoGlobal Omega 3 Fatty Acid Market Company Share Analysis, 2019

Omega 3 Fatty Acid Market

To know more about this report | Request Free Sample Copy


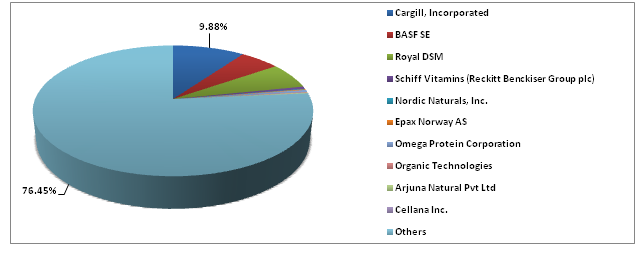
The report also offers an in-depth analysis of the market shares of each industry player and gives an outline of the market position of key players in the omega 3 fatty acid market. Moreover, the study offers wide coverage of key strategic advances witnessed in the market such as new product launches, acquisitions & mergers, collaborations & joint ventures, funding & VC activities, agreements, partnerships, R&D activities, and regional expansion of key players of the omega 3 fatty acid market.

The research study provides a critical assessment of the omega 3 fatty acid industry by logically segmenting the market on the basis of type, application, source, and regions. Based on the past, present, and future trends, all the segments were analyzed from the bottom up, and the market sizes have been estimated from 2020 to 2026.

Increasing consumer awareness regarding health benefits for omega 3 fatty acids is anticipated to strengthen the global market over the forecast period. Increasing application finding new markets and an increase in application profiling are some of the important factors enhancing the growth of the market across the globe.

logoReport Scope

Report Attribute

Details

Market Size in 2019

USD 4 Billion

Projected Market Size in 2026

USD 9 Billion

CAGR Growth Rate

14% CAGR

Base Year

2019

Forecast Years

2020-2026

Key Market Players

Cargill Incorporated, BASF SE, Royal DSM, Schiff Vitamins (Reckitt Benckiser Group PLC), Nordic Naturals, Inc., Epax Norway AS, Omega Protein Corporation, Organic Technologies, Arjuna Natural Pvt. Ltd., Cellana Inc., and others. The prominent market players in the market are focused on key trends such as Go-To-Market Strategy, Merger & Acquisitions and Partnerships/JVs Feasibility, and New Product/Service Launch and Expansion., and Others

Key Segment

By Type , Application, Source, and Region

Major Regions Covered

North America, Europe, Asia Pacific, Latin America, and the Middle East & Africa

Purchase Options

Request customized purchase options to meet your research needs.Explore purchase options

The Omega 3 fatty acid market is segmented based on type, application, and source. Based on type segmentation, the market is classified into alpha-linolenic acid, eicosapentaenoic acid, and docosahexaenoic acid. Based on the application the Omega 3 fatty acid market is classified as infant formula, pharmaceuticals, clinical nutrition, food and beverage, dietary supplements, and pet food.

By Source, the Omega 3 fatty acid market split into fish oil, algal oil, and plant oil. In the end, the Omega 3 fatty acid market analysis is split into five major regions including North America, Europe, Asia Pacific, Latin America, and Middle East & Africa.

logoSome of the leading players in the global market include

  •  Cargill Incorporated
  •  BASF SE
  •  Royal DSM
  •  Schiff Vitamins (Reckitt Benckiser Group PLC)
  •  Nordic Naturals Inc.
  •  Epax Norway AS
  •  Omega Protein Corporation
  •  Organic Technologies
  •  Arjuna Natural Pvt. Ltd.
  •  Cellana Inc.

This report segments the Global Omega 3 Fatty Acid market as follows:

logoBy Type Analysis

  • ALA (Alpha-Linolenic Acid)
  • EPA (Eicosapentaenoic Acid)
  • DHA (Docosahexaenoic Acid)

logoBy Application Analysis

  • Infant formula
  • Pharmaceuticals
  • Clinical Nutrition
  • Food and Beverage
  • Dietary Supplements
  • Pet food

logoBy Source Analysis

  • Fish Oil
  • Algal Oil
  • Plant Oil

logoBy Region

  • North America
    • The U.S.
    • Canada
  • Europe
    • Germany
    • The UK
    • France
    • Spain
    • Italy
    • Rest of Europe
  • Asia Pacific
    • China
    • Japan
    • India
    • South Korea
    • Southeast Asia
    • Rest of Asia Pacific
  • Latin America
    • Brazil
    • Mexico
    • Rest of Latin America
  • Middle East & Africa
    • GCC
    • South Africa
    • Rest of Middle East & Africa

logoKEY BUSINESS POINTERS ADDRESSED & FOREMOST REASONS TO PROCURE THE REPORT:

  • Statistical Analysis of the Past, Current, and Future Trends of the Industry with Validated Market Sizes Data
  • Direct and Indirect Rationales Impacting the Industry
  • In-depth and Micro Analysis of Viable Segments and Sub-segments
  • Companies and Vendors Market Share, Competitive Landscape, and Player Positioning Analysis
  • Demand Side (Consumption) and Supply Side (Production) Perspective and Analysis wherever applicable
  • Key Buyers and End-Users Analysis
  • Value Chain and Manufacturing Cost Structure Analysis wherever relevant
  • Key Marketing Strategies as well as Key Sales Channels adopted in the market
  • Investment Opportunity Analysis & Patents Analysis wherever feasible
  • Technological Road Map & Technical Analysis
  • Robust Research Methodology comprising dynamic mix (65%~35%) of Extensive Primary Research (primary interviews, ad-hoc surveys, questionnaires) and Protracted Secondary Research (proprietary in-house database, paid external databases, publically available validated sources)

Table of Content

  1. CHAPTER 1. Executive Summary
  2. CHAPTER 2. Omega 3 Fatty Acid market – Type Analysis
    1. 2.1. Global Omega 3 Fatty Acid Market – Type Overview
    2. 2.2. Global Omega 3 Fatty Acid Market Share, by Type, 2019 & 2026 (USD Million)
    3. 2.3. Global Omega 3 Fatty Acid Market share, by Type, 2019 & 2026 (Metric Tons)
    4. 2.4. ALA
      1. 2.4.1. Global ALA Omega 3 Fatty Acid Market, 2016-2026 (USD Million)
      2. 2.4.2. Global ALA Omega 3 Fatty Acid Market, 2016-2026 (Metric Tons)
    5. 2.5. EPA
      1. 2.5.1. Global EPA Omega 3 Fatty Acid Market, 2016-2026 (USD Million)
      2. 2.5.2. Global EPA Omega 3 Fatty Acid Market, 2016-2026 (Metric Tons)
    6. 2.6. DHA
      1. 2.6.1. Global DHA Omega 3 Fatty Acid Market, 2016-2026 (USD Million)
      2. 2.6.2. Global DHA Omega 3 Fatty Acid Market, 2016-2026 (Metric Tons)
  3. CHAPTER 3. Omega 3 Fatty Acid market – Application Analysis
    1. 3.1. Global Omega 3 Fatty Acid Market – Application Overview
    2. 3.2. Global Omega 3 Fatty Acid Market Share, by Application, 2019 & 2026 (USD Million)
    3. 3.3. Global Omega 3 Fatty Acid Market share, by Application, 2019 & 2026 (Metric Tons)
    4. 3.4. Infant Formula
      1. 3.4.1. Global Infant Formula Omega 3 Fatty Acid Market, 2016-2026 (USD Million)
      2. 3.4.2. Global Infant Formula Omega 3 Fatty Acid Market, 2016-2026 (Metric Tons)
    5. 3.5. Pharmaceuticals
      1. 3.5.1. Global Pharmaceuticals Omega 3 Fatty Acid Market, 2016-2026 (USD Million)
      2. 3.5.2. Global Pharmaceuticals Omega 3 Fatty Acid Market, 2016-2026 (Metric Tons)
    6. 3.6. Clinical Nutrition
      1. 3.6.1. Global Clinical Nutrition Omega 3 Fatty Acid Market, 2016-2026 (USD Million)
      2. 3.6.2. Global Clinical Nutrition Omega 3 Fatty Acid Market, 2016-2026 (Metric Tons)
    7. 3.7. Food and Beverage
      1. 3.7.1. Global Food and Beverage Omega 3 Fatty Acid Market, 2016-2026 (USD Million)
      2. 3.7.2. Global Food and Beverage Omega 3 Fatty Acid Market, 2016-2026 (Metric Tons)
    8. 3.8. Dietary Supplements
      1. 3.8.1. Global Dietary Supplements Omega 3 Fatty Acid Market, 2016-2026 (USD Million)
      2. 3.8.2. Global Dietary Supplements Omega 3 Fatty Acid Market, 2016-2026 (Metric Tons)
    9. 3.9. Pet Food
      1. 3.9.1. Global Pet Food Omega 3 Fatty Acid Market, 2016-2026 (USD Million)
      2. 3.9.2. Global Pet Food Omega 3 Fatty Acid Market, 2016-2026 (Metric Tons)
  4. CHAPTER 4. Omega 3 Fatty Acid market – Source Analysis
    1. 4.1. Global Omega 3 Fatty Acid Market – Source Overview
    2. 4.2. Global Omega 3 Fatty Acid Market Share, by Source, 2019 & 2026 (USD Million)
    3. 4.3. Global Omega 3 Fatty Acid Market share, by Source, 2019 & 2026 (Metric Tons)
    4. 4.4. Fish Oil
      1. 4.4.1. Global Fish Oil Omega 3 Fatty Acid Market, 2016-2026 (USD Million)
      2. 4.4.2. Global Fish Oil Omega 3 Fatty Acid Market, 2016-2026 (Metric Tons)
    5. 4.5. Algal Oil
      1. 4.5.1. Global Algal Oil Omega 3 Fatty Acid Market, 2016-2026 (USD Million)
      2. 4.5.2. Global Algal Oil Omega 3 Fatty Acid Market, 2016-2026 (Metric Tons)
    6. 4.6. Plant Oil
      1. 4.6.1. Global Plant Oil Omega 3 Fatty Acid Market, 2016-2026 (USD Million)
      2. 4.6.2. Global Plant Oil Omega 3 Fatty Acid Market, 2016-2026 (Metric Tons)
  5. CHAPTER 5. Omega 3 Fatty Acid market – Regional Analysis
    1. 5.1. Global Omega 3 Fatty Acid Market Regional Overview
    2. 5.2. Global Omega 3 Fatty Acid Market Share, by Region, 2019 & 2026 (Value)
    3. 5.3. Global Omega 3 Fatty Acid Market Share, by Region, 2019 & 2026 (Volume)
    4. 5.4. North America
      1. 5.4.1. North America Omega 3 Fatty Acid Market size and forecast, 2016-2026
      2. 5.4.2. North America Omega 3 Fatty Acid Market, by Country, 2018 - 2025 (USD Million)
      3. 5.4.3. North America Market size and forecast, 2016-2026 (Metric Tons)
      4. 5.4.4. North America Omega 3 Fatty Acid Market, by Country, 2018 - 2025 (Metric Tons)
      5. 5.4.5. North America Omega 3 Fatty Acid Market, by Type, 2016-2026
      6. 5.4.6. North America Omega 3 Fatty Acid Market, by Application, 2016-2026
      7. 5.4.7. North America Omega 3 Fatty Acid Market, by Source, 2016-2026
      8. 5.4.8. U.S.
      9. 5.4.9. Canada
    5. 5.5. Europe
      1. 5.5.1. Europe Omega 3 Fatty Acid Market size and forecast, 2016-2026
      2. 5.5.2. Europe Omega 3 Fatty Acid Market, by Country, 2018 - 2025 (USD Million)
      3. 5.5.3. Europe Market size and forecast, 2016-2026 (Metric Tons)
      4. 5.5.4. Europe Omega 3 Fatty Acid Market, by Country, 2018 - 2025 (Metric Tons)
      5. 5.5.5. Europe Omega 3 Fatty Acid Market, by Type, 2016-2026
      6. 5.5.6. Europe Omega 3 Fatty Acid Market, by Application, 2016-2026
      7. 5.5.7. Europe Omega 3 Fatty Acid Market, by Source, 2016-2026
      8. 5.5.8. Germany
      9. 5.5.9. France
      10. 5.5.10. U.K.
      11. 5.5.11. Italy
      12. 5.5.12. Spain
      13. 5.5.13. Rest of Europe
    6. 5.6. Asia Pacific
      1. 5.6.1. Asia Pacific Omega 3 Fatty Acid Market size and forecast, 2016-2026
      2. 5.6.2. Asia Pacific Omega 3 Fatty Acid Market, by Country, 2018 - 2025 (USD Million)
      3. 5.6.3. Asia Pacific Market size and forecast, 2016-2026 (Metric Tons)
      4. 5.6.4. Asia Pacific Omega 3 Fatty Acid Market, by Country, 2018 - 2025 (Metric Tons)
      5. 5.6.5. Asia Pacific Omega 3 Fatty Acid Market, by Type, 2016-2026
      6. 5.6.6. Asia Pacific Omega 3 Fatty Acid Market, by Application, 2016-2026
      7. 5.6.7. Asia Pacific Omega 3 Fatty Acid Market, by Source, 2016-2026
      8. 5.6.8. China
      9. 5.6.9. Japan
      10. 5.6.10. India
      11. 5.6.11. South Korea
      12. 5.6.12. South-East Asia
      13. 5.6.13. Rest of Asia Pacific
    7. 5.7. Latin America
      1. 5.7.1. Latin America Omega 3 Fatty Acid Market size and forecast, 2016-2026
      2. 5.7.2. Latin America Omega 3 Fatty Acid Market, by Country, 2018 - 2025 (USD Million)
      3. 5.7.3. Latin America Market size and forecast, 2016-2026 (Metric Tons)
      4. 5.7.4. Latin America Omega 3 Fatty Acid Market, by Country, 2018 - 2025 (Metric Tons)
      5. 5.7.5. Latin America Omega 3 Fatty Acid Market, by Type, 2016-2026
      6. 5.7.6. Latin America Omega 3 Fatty Acid Market, by Application, 2016-2026
      7. 5.7.7. Latin America Omega 3 Fatty Acid Market, by Source, 2016-2026
      8. 5.7.8. Brazil
      9. 5.7.9. Mexico
      10. 5.7.10. Rest of Latin America
    8. 5.8. The Middle-East and Africa
      1. 5.8.1. The Middle-East and Africa Omega 3 Fatty Acid Market size and forecast, 2016-2026
      2. 5.8.2. The Middle-East and Africa Omega 3 Fatty Acid Market, by Country, 2018 - 2025 (USD Million)
      3. 5.8.3. The Middle-East and Africa Market size and forecast, 2016-2026 (Metric Tons)
      4. 5.8.4. The Middle-East and Africa Omega 3 Fatty Acid Market, by Country, 2018 - 2025 (Metric Tons)
      5. 5.8.5. The Middle-East and Africa Omega 3 Fatty Acid Market, by Type, 2016-2026
      6. 5.8.6. The Middle-East and Africa Omega 3 Fatty Acid Market, by Application, 2016-2026
      7. 5.8.7. The Middle-East and Africa Omega 3 Fatty Acid Market, by Source, 2016-2026
      8. 5.8.8. GCC Countries
      9. 5.8.9. South Africa
      10. 5.8.10. Rest of Middle-East Africa
  6. CHAPTER 6. Omega 3 Fatty Acid Production, Consumption, Export, Import by Regions
    1. 6.1. Global Omega 3 Fatty Acid Production and Consumption, 2016-2026 (Metric Tons)
    2. 6.2. Global Import and Export Analysis, by Region
  7. CHAPTER 7. Omega 3 Fatty Acid market – Competitive Landscape
    1. 7.1. Competitor Market Share – Revenue
    2. 7.2. Market Concentration Rate Analysis, Top 3 and Top 5 Players
    3. 7.3. Competitor Market Share – Volume
    4. 7.4. Strategic Development
      1. 7.4.1. Acquisitions and Mergers
      2. 7.4.2. New Products
      3. 7.4.3. Research & Development Activities
  8. CHAPTER 8. Company Profiles
    1. 8.1. Cargill, Incorporated
      1. 8.1.1. Company Overview
      2. 8.1.2. Cargill, Incorporated Sales, Revenue, Price, and Gross Margin
      3. 8.1.3. Product portfolio
      4. 8.1.4. Recent initiatives
    2. 8.2. BASF SE
      1. 8.2.1. Company Overview
      2. 8.2.2. BASF SE Sales, Revenue, Price, and Gross Margin
      3. 8.2.3. Product portfolio
      4. 8.2.4. Recent initiatives
    3. 8.3. Royal DSM
      1. 8.3.1. Company Overview
      2. 8.3.2. Royal DSM Sales, Revenue, Price, and Gross Margin
      3. 8.3.3. Product portfolio
      4. 8.3.4. Recent initiatives
    4. 8.4. Schiff Vitamins (Reckitt Benckiser Group plc)
      1. 8.4.1. Company Overview
      2. 8.4.2. Schiff Vitamins (Reckitt Benckiser Group plc) Sales, Revenue, Price, and Gross Margin
      3. 8.4.3. Product portfolio
      4. 8.4.4. Recent initiatives
    5. 8.5. Nordic Naturals, Inc.
      1. 8.5.1. Company Overview
      2. 8.5.2. Nordic Naturals, Inc. Sales, Revenue, Price, and Gross Margin
      3. 8.5.3. Product portfolio
      4. 8.5.4. Recent initiatives
    6. 8.6. Epax Norway AS
      1. 8.6.1. Company Overview
      2. 8.6.2. Epax Norway AS Sales, Revenue, Price, and Gross Margin
      3. 8.6.3. Product portfolio
      4. 8.6.4. Recent initiatives
    7. 8.7. Omega Protein Corporation
      1. 8.7.1. Company Overview
      2. 8.7.2. Omega Protein Corporation Sales, Revenue, Price, and Gross Margin
      3. 8.7.3. Product portfolio
      4. 8.7.4. Recent initiatives
    8. 8.8. Organic Technologies
      1. 8.8.1. Company Overview
      2. 8.8.2. Organic Technologies Sales, Revenue, Price, and Gross Margin
      3. 8.8.3. Product portfolio
      4. 8.8.4. Recent initiatives
    9. 8.9. Arjuna Natural Pvt Ltd
      1. 8.9.1. Company Overview
      2. 8.9.2. Arjuna Natural Pvt Ltd Sales, Revenue, Price, and Gross Margin
      3. 8.9.3. Product portfolio
      4. 8.9.4. Recent initiatives
    10. 8.10. Cellana Inc.
      1. 8.10.1. Company Overview
      2. 8.10.2. Cellana Inc. Sales, Revenue, Price, and Gross Margin
      3. 8.10.3. Product portfolio
      4. 8.10.4. Recent initiatives
    11. 8.11. Others
      1. 8.11.1. Company Overview
      2. 8.11.2. Others Sales, Revenue, Price, and Gross Margin
      3. 8.11.3. Product portfolio
      4. 8.11.4. Recent initiatives
  9. CHAPTER 9. Omega 3 Fatty Acid — Industry Analysis
    1. 9.1. Introduction and Taxonomy
    2. 9.2. Omega 3 Fatty Acid Market – Key Trends
      1. 9.2.1. Market Drivers
      2. 9.2.2. Market Restraints
      3. 9.2.3. Market Opportunities
    3. 9.3. Value Chain Analysis
    4. 9.4. Key Mandates and Regulations
    5. 9.5. Technology Roadmap and Timeline
    6. 9.6. Omega 3 Fatty Acid market – Attractiveness Analysis
      1. 9.6.1. By Type
      2. 9.6.2. By Application
      3. 9.6.3. By Source
      4. 9.6.4. By Region
  10. CHAPTER 10. Raw Material analysis
    1. 10.1. Omega 3 Fatty Acid Key Raw Material Analysis
      1. 10.1.1. Key Raw Materials
      2. 10.1.2. Price Trend of Key Raw Materials
    2. 10.2. Key Suppliers of Raw Materials
    3. 10.3. Proportion of Manufacturing Cost Structure
      1. 10.3.1. Raw Materials
      2. 10.3.2. Labor Cost
    4. 10.4. Manufacturing Expenses Analysis of Omega 3 Fatty Acid
  11. CHAPTER 11. Industrial Chain, Sourcing Strategy and Downstream Buyers
    1. 11.1. Omega 3 Fatty Acid Industrial Chain Analysis
    2. 11.2. Upstream Raw Materials Sourcing
      1. 11.2.1. Risk Mitigation:
      2. 11.2.2. Supplier Relationships:
      3. 11.2.3. Business Processes:
      4. 11.2.4. Securing the Product:
    3. 11.3. Raw Materials Sources of Omega 3 Fatty Acid Major Manufacturers in 2016
    4. 11.4. Downstream Buyers
    5. 11.5. Distributors/Traders List
  12. CHAPTER 12. Marketing Strategy Analysis, Distributors
    1. 12.1. Marketing Channel
    2. 12.2. Direct Marketing
    3. 12.3. Indirect Marketing
    4. 12.4. Marketing Channel Development Trend
    5. 12.5. Economic/Political Environmental Change
  13. CHAPTER 13. Report Conclusion
  14. CHAPTER 14. Research Approach & Methodology
    1. 14.1. Report Description
    2. 14.2. Research Scope
    3. 14.3. Research Methodology
      1. 14.3.1. Secondary Research
      2. 14.3.2. Primary Research
      3. 14.3.3. Models

      List of Figures

      FIG. 1 Global Omega 3 Fatty Acid Market, 2016-2026 (USD Million)
      FIG. 2 Global Omega 3 Fatty Acid Market Share, by Type, 2019 & 2026 (USD Million)
      FIG. 3 Global Omega 3 Fatty Acid Market share, by Type, 2019 & 2026 (Metric Tons)
      FIG. 4 Global ALA Omega 3 Fatty Acid Market, 2016-2026 (USD Million)
      FIG. 5 Global ALA Omega 3 Fatty Acid  Market, 2016-2026 (Metric Tons)
      FIG. 6 Global EPA Omega 3 Fatty Acid Market, 2016-2026 (USD Million)
      FIG. 7 Global EPA Omega 3 Fatty Acid  Market, 2016-2026 (Metric Tons)
      FIG. 8 Global DHA Omega 3 Fatty Acid Market, 2016-2026 (USD Million)
      FIG. 9 Global DHA Omega 3 Fatty Acid  Market, 2016-2026 (Metric Tons)
      FIG. 10 Global Omega 3 Fatty Acid Market Share, by Application, 2019 & 2026 (USD Million)
      FIG. 11 Global Omega 3 Fatty Acid Market share, by Application, 2019 & 2026 (Metric Tons)
      FIG. 12 Global Infant Formula Omega 3 Fatty Acid Market, 2016-2026 (USD Million)
      FIG. 13 Global Infant Formula Omega 3 Fatty Acid  Market, 2016-2026 (Metric Tons)
      FIG. 14 Global Pharmaceuticals Omega 3 Fatty Acid Market, 2016-2026 (USD Million)
      FIG. 15 Global Pharmaceuticals Omega 3 Fatty Acid  Market, 2016-2026 (Metric Tons)
      FIG. 16 Global Clinical Nutrition Omega 3 Fatty Acid Market, 2016-2026 (USD Million)
      FIG. 17 Global Clinical Nutrition Omega 3 Fatty Acid  Market, 2016-2026 (Metric Tons)
      FIG. 18 Global Food and Beverage Omega 3 Fatty Acid Market, 2016-2026 (USD Million)
      FIG. 19 Global Food and Beverage Omega 3 Fatty Acid  Market, 2016-2026 (Metric Tons)
      FIG. 20 Global Dietary Supplements Omega 3 Fatty Acid Market, 2016-2026 (USD Million)
      FIG. 21 Global Dietary Supplements Omega 3 Fatty Acid  Market, 2016-2026 (Metric Tons)
      FIG. 22 Global Pet Food Omega 3 Fatty Acid Market, 2016-2026 (USD Million)
      FIG. 23 Global Pet Food Omega 3 Fatty Acid  Market, 2016-2026 (Metric Tons)
      FIG. 24 Global Omega 3 Fatty Acid Market Share, by Source, 2019 & 2026 (USD Million)
      FIG. 25 Global Omega 3 Fatty Acid Market share, by Source, 2019 & 2026 (Metric Tons)
      FIG. 26 Global Fish Oil Omega 3 Fatty Acid Market, 2016-2026 (USD Million)
      FIG. 27 Global Fish Oil Omega 3 Fatty Acid  Market, 2016-2026 (Metric Tons)
      FIG. 28 Global Algal Oil Omega 3 Fatty Acid Market, 2016-2026 (USD Million)
      FIG. 29 Global Algal Oil Omega 3 Fatty Acid  Market, 2016-2026 (Metric Tons)
      FIG. 30 Global Plant Oil Omega 3 Fatty Acid Market, 2016-2026 (USD Million)
      FIG. 31 Global Plant Oil Omega 3 Fatty Acid  Market, 2016-2026 (Metric Tons)
      FIG. 42 Global Omega 3 Fatty Acid Market Share, by Region, 2019 & 2026
      FIG. 43 Global Omega 3 Fatty Acid Market Share, by Region, 2019 & 2026
      FIG. 44 North America Omega 3 Fatty Acid Market, 2016-2026
      FIG. 45 North America Omega 3 Fatty Acid  Market, 2016-2026 (Metric Tons)
      FIG. 46 U.S. Omega 3 Fatty Acid Market, 2016-2026
      FIG. 47 U.S. Omega 3 Fatty Acid  Market, 2016-2026 (Metric Tons)
      FIG. 48 Canada Omega 3 Fatty Acid Market, 2016-2026
      FIG. 49 Canada Omega 3 Fatty Acid  Market, 2016-2026 (Metric Tons)
      FIG. 50 Europe Omega 3 Fatty Acid Market, 2016-2026
      FIG. 51 Europe Omega 3 Fatty Acid  Market, 2016-2026 (Metric Tons)
      FIG. 52 Germany Omega 3 Fatty Acid Market, 2016-2026
      FIG. 53 Germany Omega 3 Fatty Acid  Market, 2016-2026 (Metric Tons)
      FIG. 54 France Omega 3 Fatty Acid Market, 2016-2026
      FIG. 55 France Omega 3 Fatty Acid  Market, 2016-2026 (Metric Tons)
      FIG. 56 U.K. Omega 3 Fatty Acid Market, 2016-2026
      FIG. 57 U.K. Omega 3 Fatty Acid  Market, 2016-2026 (Metric Tons)
      FIG. 58 Italy Omega 3 Fatty Acid Market, 2016-2026
      FIG. 59 Italy Omega 3 Fatty Acid  Market, 2016-2026 (Metric Tons)
      FIG. 60 Spain Omega 3 Fatty Acid Market, 2016-2026
      FIG. 61 Spain Omega 3 Fatty Acid  Market, 2016-2026 (Metric Tons)
      FIG. 62 Rest of Europe Omega 3 Fatty Acid Market, 2016-2026
      FIG. 63 Rest of Europe Omega 3 Fatty Acid  Market, 2016-2026 (Metric Tons)
      FIG. 64 Asia Pacific Omega 3 Fatty Acid Market, 2016-2026
      FIG. 65 Asia Pacific Omega 3 Fatty Acid  Market, 2016-2026 (Metric Tons)
      FIG. 66 China Omega 3 Fatty Acid Market, 2016-2026
      FIG. 67 China Omega 3 Fatty Acid  Market, 2016-2026 (Metric Tons)
      FIG. 68 Japan Omega 3 Fatty Acid Market, 2016-2026
      FIG. 69 Japan Omega 3 Fatty Acid  Market, 2016-2026 (Metric Tons)
      FIG. 70 India Omega 3 Fatty Acid Market, 2016-2026
      FIG. 71 India Omega 3 Fatty Acid  Market, 2016-2026 (Metric Tons)
      FIG. 72 South  Korea Omega 3 Fatty Acid Market, 2016-2026
      FIG. 73 South  Korea Omega 3 Fatty Acid  Market, 2016-2026 (Metric Tons)
      FIG. 74 South-East Asia Omega 3 Fatty Acid Market, 2016-2026
      FIG. 75 South-East Asia Omega 3 Fatty Acid  Market, 2016-2026 (Metric Tons)
      FIG. 76 Rest of Asia Pacific Omega 3 Fatty Acid Market, 2016-2026
      FIG. 77 Rest of Asia Pacific Omega 3 Fatty Acid  Market, 2016-2026 (Metric Tons)
      FIG. 78 Latin America Omega 3 Fatty Acid Market, 2016-2026
      FIG. 79 Latin America Omega 3 Fatty Acid  Market, 2016-2026 (Metric Tons)
      FIG. 80 Brazil Omega 3 Fatty Acid Market, 2016-2026
      FIG. 81 Brazil Omega 3 Fatty Acid  Market, 2016-2026 (Metric Tons)
      FIG. 82 Mexico Omega 3 Fatty Acid Market, 2016-2026
      FIG. 83 Mexico Omega 3 Fatty Acid  Market, 2016-2026 (Metric Tons)
      FIG. 84 Rest of Latin America Omega 3 Fatty Acid Market, 2016-2026
      FIG. 85 Rest of Latin America Omega 3 Fatty Acid  Market, 2016-2026 (Metric Tons)
      FIG. 86 The Middle-East and Africa Omega 3 Fatty Acid Market, 2016-2026
      FIG. 87 The Middle-East and Africa Omega 3 Fatty Acid  Market, 2016-2026 (Metric Tons)
      FIG. 88 GCC Countries Omega 3 Fatty Acid Market, 2016-2026
      FIG. 89 GCC Countries Omega 3 Fatty Acid  Market, 2016-2026 (Metric Tons)
      FIG. 90 South Africa Omega 3 Fatty Acid Market, 2016-2026
      FIG. 91 South Africa Omega 3 Fatty Acid  Market, 2016-2026 (Metric Tons)
      FIG. 92 Rest of Middle-East Africa Omega 3 Fatty Acid Market, 2016-2026
      FIG. 93 Rest of Middle-East Africa Omega 3 Fatty Acid  Market, 2016-2026 (Metric Tons)
      FIG. 94 Global Omega 3 Fatty Acid Production and Consumption, 2016-2026 (Metric Tons)
      FIG. 95 North America Omega 3 Fatty Acid Production and Consumption, 2016-2026 (Metric Tons)
      FIG. 96 Europe Omega 3 Fatty Acid Production and Consumption, 2016-2026 (Metric Tons)
      FIG. 97 Asia Pacific Omega 3 Fatty Acid Production and Consumption, 2016-2026 (Metric Tons)
      FIG. 98 Latin America Omega 3 Fatty Acid Production and Consumption, 2016-2026 (Metric Tons)
      FIG. 99 Middle East and Africa Omega 3 Fatty Acid Production and Consumption, 2016-2026 (Metric Tons)
      FIG. 100 Competitor Market Share – Revenue
      FIG. 101 Competitor Market Share – Volume
      FIG. 102 Cargill, Incorporated Revenue and Growth Rate
      FIG. 103 Cargill, Incorporated Market Share
      FIG. 104 BASF SE Revenue and Growth Rate
      FIG. 105 BASF SE Market Share
      FIG. 106 Royal DSM Revenue and Growth Rate
      FIG. 107 Royal DSM Market Share
      FIG. 108 Schiff Vitamins (Reckitt Benckiser Group plc) Revenue and Growth Rate
      FIG. 109 Schiff Vitamins (Reckitt Benckiser Group plc) Market Share
      FIG. 110 Nordic Naturals, Inc. Revenue and Growth Rate
      FIG. 111 Nordic Naturals, Inc. Market Share
      FIG. 112 Epax Norway AS Revenue and Growth Rate
      FIG. 113 Epax Norway AS Market Share
      FIG. 114 Omega Protein Corporation Revenue and Growth Rate
      FIG. 115 Omega Protein Corporation Market Share
      FIG. 116 Organic Technologies Revenue and Growth Rate
      FIG. 117 Organic Technologies Market Share
      FIG. 118 Arjuna Natural Pvt Ltd Revenue and Growth Rate
      FIG. 119 Arjuna Natural Pvt Ltd Market Share
      FIG. 120 Cellana Inc. Revenue and Growth Rate
      FIG. 121 Cellana Inc. Market Share
      FIG. 122 Others Revenue and Growth Rate
      FIG. 123 Others Market Share
      FIG. 124 Market Dynamics
      FIG. 125 Global Omega 3 Fatty Acid – Value Chain Analysis
      FIG. 126 Key Mandates and Regulations
      FIG. 127 Technology Roadmap and Timeline
      FIG. 128 Market Attractiveness Analysis – By Type
      FIG. 129 Market Attractiveness Analysis – By Application
      FIG. 130 Market Attractiveness Analysis – By Source
      FIG. 131 Market Attractiveness Analysis – By Region
      FIG. 132 Manufacturing Cost Structure of Omega 3 Fatty Acid
      FIG. 133 Omega 3 Fatty Acid Industrial Chain Analysis
      FIG. 134 Market Channel
      FIG. 135 Marketing Channel Development Trend
      FIG. 136 Growth in World Gross Product, 2008-2018

      List of Tables

      TABLE 1 Global Omega 3 Fatty Acid market, 2019 & 2026 (USD Million)
      TABLE 2 Global Omega 3 Fatty Acid market, by Type, 2016-2026 (USD Million)
      TABLE 3 Global Omega 3 Fatty Acid market, by Type, 2016-2026 (Metric Tons)
      TABLE 4 Global Omega 3 Fatty Acid market, by Application, 2016-2026 (USD Million)
      TABLE 5 Global Omega 3 Fatty Acid market, by Application, 2016-2026 (Metric Tons)
      TABLE 6 Global Omega 3 Fatty Acid market, by Source, 2016-2026 (USD Million)
      TABLE 7 Global Omega 3 Fatty Acid market, by Source, 2016-2026 (Metric Tons)
      TABLE 8 Global Omega 3 Fatty Acid market, by region, 2016-2026 (USD Million)
      TABLE 9 Global Omega 3 Fatty Acid market, by region, 2016-2026 (Metric Tons)
      TABLE 10 North America Omega 3 Fatty Acid Market, by Type, 2016-2026 (USD Million)
      TABLE 11 North America Omega 3 Fatty Acid Market, by Type, 2016-2026 (Metric Tons)
      TABLE 12 North America Omega 3 Fatty Acid Market, by Application, 2016-2026 (USD Million)
      TABLE 13 North America Omega 3 Fatty Acid Market, by Application, 2016-2026 (Metric Tons)
      TABLE 14 North America Omega 3 Fatty Acid Market, by Source, 2016-2026 (USD Million)
      TABLE 15 North America Omega 3 Fatty Acid Market, by Source, 2016-2026 (Metric Tons)
      TABLE 16 Europe Omega 3 Fatty Acid Market, by Type, 2016-2026 (USD Million)
      TABLE 17 Europe Omega 3 Fatty Acid Market, by Type, 2016-2026 (Metric Tons)
      TABLE 18 Europe Omega 3 Fatty Acid Market, by Application, 2016-2026 (USD Million)
      TABLE 19 Europe Omega 3 Fatty Acid Market, by Application, 2016-2026 (Metric Tons)
      TABLE 20 Europe Omega 3 Fatty Acid Market, by Source, 2016-2026 (USD Million)
      TABLE 21 Europe Omega 3 Fatty Acid Market, by Source, 2016-2026 (Metric Tons)
      TABLE 22 Asia Pacific Omega 3 Fatty Acid Market, by Type, 2016-2026 (USD Million)
      TABLE 23 Asia Pacific Omega 3 Fatty Acid Market, by Type, 2016-2026 (Metric Tons)
      TABLE 24 Asia Pacific Omega 3 Fatty Acid Market, by Application, 2016-2026 (USD Million)
      TABLE 25 Asia Pacific Omega 3 Fatty Acid Market, by Application, 2016-2026 (Metric Tons)
      TABLE 26 Asia Pacific Omega 3 Fatty Acid Market, by Source, 2016-2026 (USD Million)
      TABLE 27 Asia Pacific Omega 3 Fatty Acid Market, by Source, 2016-2026 (Metric Tons)
      TABLE 28 Latin America Omega 3 Fatty Acid Market, by Type, 2016-2026 (USD Million)
      TABLE 29 Latin America Omega 3 Fatty Acid Market, by Type, 2016-2026 (Metric Tons)
      TABLE 30 Latin America Omega 3 Fatty Acid Market, by Application, 2016-2026 (USD Million)
      TABLE 31 Latin America Omega 3 Fatty Acid Market, by Application, 2016-2026 (Metric Tons)
      TABLE 32 Latin America Omega 3 Fatty Acid Market, by Source, 2016-2026 (USD Million)
      TABLE 33 Latin America Omega 3 Fatty Acid Market, by Source, 2016-2026 (Metric Tons)
      TABLE 34 The Middle-East and Africa Omega 3 Fatty Acid Market, by Type, 2016-2026 (USD Million)
      TABLE 35 The Middle-East and Africa Omega 3 Fatty Acid Market, by Type, 2016-2026 (Metric Tons)
      TABLE 36 The Middle-East and Africa Omega 3 Fatty Acid Market, by Application, 2016-2026 (USD Million)
      TABLE 37 The Middle-East and Africa Omega 3 Fatty Acid Market, by Application, 2016-2026 (Metric Tons)
      TABLE 38 The Middle-East and Africa Omega 3 Fatty Acid Market, by Source, 2016-2026 (USD Million)
      TABLE 39 The Middle-East and Africa Omega 3 Fatty Acid Market, by Source, 2016-2026 (Metric Tons)
      TABLE 40 North America Omega 3 Fatty Acid Production, Consumption, Export, Import, 2015-2019
      TABLE 41 Europe Omega 3 Fatty Acid Production, Consumption, Export, Import, 2015-2019
      TABLE 42 Asia Pacific Omega 3 Fatty Acid Production, Consumption, Export, Import, 2015-2019
      TABLE 43 Latin America Omega 3 Fatty Acid Production, Consumption, Export, Import, 2015-2019
      TABLE 44 Middle East & Africa Omega 3 Fatty Acid Production, Consumption, Export, Import, 2015-2019
      TABLE 45 Global Omega 3 Fatty Acid Market - Company Revenue Analysis 2015-2019 (USD Million)
      TABLE 46 Global Omega 3 Fatty Acid Market - Company Revenue Share Analysis 2015-2019(%)
      TABLE 47 Global Omega 3 Fatty Acid Market - Company Volume Analysis 2015-2019 (Metric Tons)
      TABLE 48 Global Omega 3 Fatty Acid Market - Company Volume Share Analysis 2015-2019(%)
      TABLE 49 Acquisitions and Mergers
      TABLE 50 New Product/Service Launch
      TABLE 51 Research & Development Activities
      TABLE 52 Market Drivers
      TABLE 53 Market Restraints
      TABLE 54 Market Opportunities
      TABLE 55 Production Base and Market Concentration Rate of Raw Material
      TABLE 56 Key Suppliers of Raw Materials
      TABLE 57 Raw Materials Sources of Omega 3 Fatty Acid Major Manufacturers in 2016
      TABLE 58 Major Buyers of Omega 3 Fatty Acid
      TABLE 59 Distributors/Traders of Omega 3 Fatty Acid by Region
      

Industry Major Market Players

  •  Cargill Incorporated
  •  BASF SE
  •  Royal DSM
  •  Schiff Vitamins (Reckitt Benckiser Group PLC)
  •  Nordic Naturals Inc.
  •  Epax Norway AS
  •  Omega Protein Corporation
  •  Organic Technologies
  •  Arjuna Natural Pvt. Ltd.
  •  Cellana Inc.