Search Market Research Report

Discover Our Latest Reports
Discover Our Featured Reports
Discover Top Selling Reports

Oligonucleotide Market Size, Share Global Analysis Report, 2021 - 2026

report img

Oligonucleotide Market By Product (Oligonucleotide-Based Drugs, Synthesized Oligonucleotide, Reagents, &Equipment), By Application (Research Application & Diagnostic Applications), By End-User (Hospitals, Pharmaceutical & Biological Companies, Diagnostics Laboratories, Contact Manufacturing Organization (CMOs), & Contract Research Organizations (CROs)), And By Regions - Global & Regional Industry Perspective, Comprehensive Analysis, and Forecast 2021 - 2026

Industry Insights

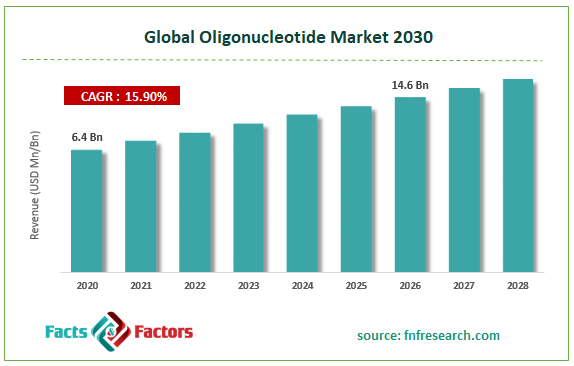
[169+ Pages Report] The report titled “Global Oligonucleotide Market” published by Facts & Factors encompasses the spectacle of the market in an analytical and comprehensive manner. We at Facts & Factors estimate that the global Oligonucleotide Market will be valued at USD 14.6 Billion in the year 2026 from an initial value of USD 6.4 Billion in the year 2020 at a CAGR value of 15.9%.

Global Oligonucleotide Market Size

To know more about this report | Request Free Sample Copy

logoMarket Overview

Oligonucleotide are a form of shorter versions of DNA or RNA molecules and have a wider aspect of applications in the field of genetic testing, research, and forensics to name a few. Oligonucleotide are usually produced in laboratory-based settings by a solid-phase chemical synthesis process and these smaller bits of nucleic acids can be further modified as a single-stranded molecule with any user-specified sequence. These are extremely pivotal for factors pertaining to artificial gene synthesis, polymerase chain reaction (PCR), DNA sequencing, and molecular cloning.

logoIndustry Growth Factors

The primary driving factors for the significant growth of the global oligonucleotide market can be attributed to the rising use of synthesized oligos in therapeutic application coupled with an increasing focus on personalized medicine to name a few. Additionally, increasing government funding in the field of oligonucleotide coupled with the advent of the COVID-19 pandemic is expected to increase the footprint of the global oligonucleotide market during the forecast period. Rising technological advances coupled with increasing synthetic biology and genome-based projects are expected to boost the global oligonucleotide market during the forecast period.

The global oligonucleotide market is expected to be driven by the increased focus of pharmaceutical and biotechnological companies coupled with increasing applications of synthesized oligonucleotide in the field of molecular diagnostics and clinical solutions to name a few. Factors pertaining to developing highly efficient testing kits and treatment measures and vaccine production are expected to boost the global oligonucleotide market during the forecast period. However, the increasing number of complexities associated with therapeutics oligonucleotide and challenging delivery of consumables is expected to hinder the growth of the global oligonucleotide market to a certain extent.

logoSegmentation Analysis

The global oligonucleotide market is segmented into product, application, end-user, and regions.
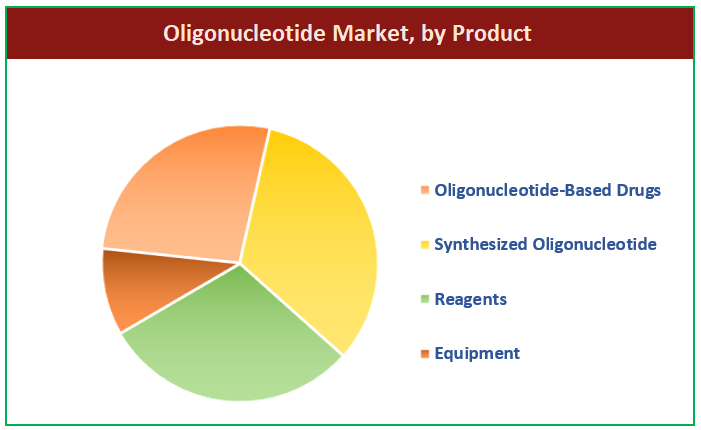
On the basis of product, the global oligonucleotide market is divided into oligonucleotide-based drugs, synthesized oligonucleotide, reagents, and equipment. The oligonucleotide-based drugs segment is expected to witness the largest market share during the advent of the forecast owing to increasing usage of FDA-approved drugs coupled with a rich clinical pipeline of oligonucleotide-based products to name a few. On the basis of application, the global oligonucleotide market can be broken down into research applications and diagnostic applications. The segment pertaining to research application is expected to witness the largest market share during the advent of the forecast owing to increasing usage of oligos as therapeutic agents coupled with increasing integration of the latter into neurological, infectious, and rare diagnostics disorders to name a few. On the basis of end-user, the global oligonucleotide market is fragmented into hospitals, pharmaceutical & biological companies, diagnostics laboratories, contract manufacturing organizations (CMOs), and contract research organizations (CROs). The hospital's category is expected to occupy the largest market share during the advent of the forecast owing to the increasing number of patient and inpatient visits to hospitals coupled with the increasing demand for oligonucleotide drugs owing to the rising number of patients suffering from rare disorders, neurological disorders, and infectious diseases.

logo Report Scope

Report Attribute

Details

Market Size in 2020

USD 6.4 Billion

Projected Market Size in 2026

USD 14.6 Billion

CAGR Growth Rate

15.9% CAGR

Base Year

2020

Forecast Years

2021-2026

Key Market Players

Danaher Corporation, Thermo Fischer Scientific, Inc., Merck KGaA, LGC Limited, Maravai Life Sciences, Biogen, Inc., SareptaTherapeutics, Inc., Alnylam Pharmaceuticals, Inc., Eurofins Corporation, Ionis Pharmaceuticals, Inc., Kaneka Corporation, Agilent Technologies, Inc., and G.E Healthcare, among others

Key Segments

Products, Applications, End-Users, and Region

Major Regions Covered

North America, Europe, Asia Pacific, Latin America, and Middle East & Africa

Purchase Options

Request customized purchase options to meet your research needs. Explore purchase options

logo Regional Analysis

North America is expected to witness the largest market share during the advent of the forecast owing to increasing contribution in theR&D activities of life sciences coupled with rising focus on improving safety and quality of healthcare services to name a few. Additionally, increasing demand from consumers associated with personalized therapeutics coupled with the rising number of key market participants in the region is expected to increase the footprint of the oligonucleotide market during the forecast period. Moreover, the rising number of COVID-19 cases during the peak of the pandemic period coupled with sedentary lifestyle changes is expected to open new revenue opportunities for the oligonucleotide market during the forecast period. The rise in population associated with genetic epidemiology of multifactorial disorders coupled with favorable government policies is expected to boost the oligonucleotide market in the region for a larger consumer base.

logo Competitive Players

The key market participants for the global oligonucleotide market are:

  • Danaher Corporation
  • Thermo Fischer Scientific Inc.
  • Merck KGaA
  • LGC Limited
  • Maravai Life Sciences
  • Biogen Inc.
  • SareptaTherapeutics Inc.
  • Alnylam Pharmaceuticals Inc.
  • Eurofins Corporation
  • Ionis Pharmaceuticals Inc.
  • Kaneka Corporation
  • Agilent Technologies Inc.
  • G.E Healthcare

logo By Product Segment Analysis

  • Oligonucleotide-Based Drugs
  • Synthesized Oligonucleotide
  • Reagents
  • Equipment

logo By Application Segment Analysis

  • Research Application
    • PCR
    • Sequencing
    • Others
  • Diagnostic Applications

logo By End-User Segment Analysis

  • Hospitals
  • Pharmaceutical & Biological Companies
  • Diagnostics Laboratories
  • Contact Manufacturing Organization (CMOs)
  • Contract Research Organizations (CROs)

Table of Content

  1. Chapter 1 Executive Summary
    1. 1.1. Introduction of Oligonucleotide
    2. 1.2. Global Oligonucleotide Market, 2019 & 2026 (USD Billion)
    3. 1.3. Global Oligonucleotide Market, 2016 – 2026 (USD Billion)
    4. 1.4. Global Oligonucleotide Market Absolute Revenue Opportunity, 2016 – 2026 (USD Billion)
    5. 1.5. Global Oligonucleotide Market Incremental Revenue Opportunity, 2020 – 2026 (USD Billion)
  2. Chapter 2 Oligonucleotide Market – Product Analysis
    1. 2.1. Global Oligonucleotide Market – Product Overview
    2. 2.2. Global Oligonucleotide Market Share, by Product, 2019 & 2026 (USD Billion)
    3. 2.3. Oligonucleotide-Based Drugs
      1. 2.3.1. Global Oligonucleotide-Based Drugs Oligonucleotide Market, 2016 – 2026 (USD Billion)
    4. 2.4. Synthesized Oligonucleotide
      1. 2.4.1. Global Synthesized Oligonucleotide Oligonucleotide Market, 2016 – 2026 (USD Billion)
    5. 2.5. Reagents
      1. 2.5.1. Global Reagents Oligonucleotide Market, 2016 – 2026 (USD Billion)
    6. 2.6. Equipment
      1. 2.6.1. Global Equipment Oligonucleotide Market, 2016 – 2026 (USD Billion)
  3. Chapter 3 Oligonucleotide Market – Application Analysis
    1. 3.1. Global Oligonucleotide Market – Application Overview
    2. 3.2. Global Oligonucleotide Market Share, by Application, 2019 & 2026 (USD Billion)
    3. 3.3. Research Application
      1. 3.3.1. Global Research Application Oligonucleotide Market, 2016 – 2026 (USD Billion)
    4. 3.4. Diagnostic Applications
      1. 3.4.1. Global Diagnostic Applications Oligonucleotide Market, 2016 – 2026 (USD Billion)
  4. Chapter 4 Oligonucleotide Market – End-User Analysis
    1. 4.1. Global Oligonucleotide Market – End-User Overview
    2. 4.2. Global Oligonucleotide Market Share, by End-User, 2019 & 2026 (USD Billion)
    3. 4.3. Hospitals
      1. 4.3.1. Global Hospitals Oligonucleotide Market, 2016 – 2026 (USD Billion)
    4. 4.4. Pharmaceutical & Biological Companies
      1. 4.4.1. Global Pharmaceutical & Biological Companies Oligonucleotide Market, 2016 – 2026 (USD Billion)
    5. 4.5. Diagnostics Laboratories
      1. 4.5.1. Global Diagnostics Laboratories Oligonucleotide Market, 2016 – 2026 (USD Billion)
    6. 4.6. Contact Manufacturing Organization (CMOs)
      1. 4.6.1. Global Contact Manufacturing Organization (CMOs) Oligonucleotide Market, 2016 – 2026 (USD Billion)
    7. 4.7. Contract Research Organizations (CROs)
      1. 4.7.1. Global Contract Research Organizations (CROs) Oligonucleotide Market, 2016 – 2026 (USD Billion)
  5. Chapter 5 Oligonucleotide Market – Regional Analysis
    1. 5.1. Global Oligonucleotide Market Regional Overview
    2. 5.2. Global Oligonucleotide Market Share, by Region, 2019 & 2026 (USD Billion)
    3. 5.3. North America
      1. 5.3.1. North America Oligonucleotide Market, 2016 – 2026 (USD Billion)
        1. 5.3.1.1. North America Oligonucleotide Market, by Country, 2016 - 2026 (USD Billion)
      2. 5.3.2. North America Oligonucleotide Market, by Product, 2016 – 2026
        1. 5.3.2.1. North America Oligonucleotide Market, by Product, 2016 – 2026 (USD Billion)
      3. 5.3.3. North America Oligonucleotide Market, by Application, 2016 – 2026
        1. 5.3.3.1. North America Oligonucleotide Market, by Application, 2016 – 2026 (USD Billion)
      4. 5.3.4. North America Oligonucleotide Market, by End-User, 2016 – 2026
        1. 5.3.4.1. North America Oligonucleotide Market, by End-User, 2016 – 2026 (USD Billion)
      5. 5.3.5. U.S.
        1. 5.3.5.1. U.S. Oligonucleotide Market, 2016 – 2026 (USD Billion)
      6. 5.3.6. Canada
        1. 5.3.6.1. Canada Oligonucleotide Market, 2016 – 2026 (USD Billion)
    4. 5.4. Europe
      1. 5.4.1. Europe Oligonucleotide Market, 2016 – 2026 (USD Billion)
        1. 5.4.1.1. Europe Oligonucleotide Market, by Country, 2016 - 2026 (USD Billion)
      2. 5.4.2. Europe Oligonucleotide Market, by Product, 2016 – 2026
        1. 5.4.2.1. Europe Oligonucleotide Market, by Product, 2016 – 2026 (USD Billion)
      3. 5.4.3. Europe Oligonucleotide Market, by Application, 2016 – 2026
        1. 5.4.3.1. Europe Oligonucleotide Market, by Application, 2016 – 2026 (USD Billion)
      4. 5.4.4. Europe Oligonucleotide Market, by End-User, 2016 – 2026
        1. 5.4.4.1. Europe Oligonucleotide Market, by End-User, 2016 – 2026 (USD Billion)
      5. 5.4.5. Germany
        1. 5.4.5.1. Germany Oligonucleotide Market, 2016 – 2026 (USD Billion)
      6. 5.4.6. France
        1. 5.4.6.1. France Oligonucleotide Market, 2016 – 2026 (USD Billion)
      7. 5.4.7. U.K.
        1. 5.4.7.1. U.K. Oligonucleotide Market, 2016 – 2026 (USD Billion)
      8. 5.4.8. Italy
        1. 5.4.8.1. Italy Oligonucleotide Market, 2016 – 2026 (USD Billion)
      9. 5.4.9. Spain
        1. 5.4.9.1. Spain Oligonucleotide Market, 2016 – 2026 (USD Billion)
      10. 5.4.10. Rest of Europe
        1. 5.4.10.1. Rest of Europe Oligonucleotide Market, 2016 – 2026 (USD Billion)
    5. 5.5. Asia Pacific
      1. 5.5.1. Asia Pacific Oligonucleotide Market, 2016 – 2026 (USD Billion)
        1. 5.5.1.1. Asia Pacific Oligonucleotide Market, by Country, 2016 - 2026 (USD Billion)
      2. 5.5.2. Asia Pacific Oligonucleotide Market, by Product, 2016 – 2026
        1. 5.5.2.1. Asia Pacific Oligonucleotide Market, by Product, 2016 – 2026 (USD Billion)
      3. 5.5.3. Asia Pacific Oligonucleotide Market, by Application, 2016 – 2026
        1. 5.5.3.1. Asia Pacific Oligonucleotide Market, by Application, 2016 – 2026 (USD Billion)
      4. 5.5.4. Asia Pacific Oligonucleotide Market, by End-User, 2016 – 2026
        1. 5.5.4.1. Asia Pacific Oligonucleotide Market, by End-User, 2016 – 2026 (USD Billion)
      5. 5.5.5. China
        1. 5.5.5.1. China Oligonucleotide Market, 2016 – 2026 (USD Billion)
      6. 5.5.6. Japan
        1. 5.5.6.1. Japan Oligonucleotide Market, 2016 – 2026 (USD Billion)
      7. 5.5.7. India
        1. 5.5.7.1. India Oligonucleotide Market, 2016 – 2026 (USD Billion)
      8. 5.5.8. South Korea
        1. 5.5.8.1. South Korea Oligonucleotide Market, 2016 – 2026 (USD Billion)
      9. 5.5.9. South-East Asia
        1. 5.5.9.1. South-East Asia Oligonucleotide Market, 2016 – 2026 (USD Billion)
      10. 5.5.10. Rest of Asia Pacific
        1. 5.5.10.1. Rest of Asia Pacific Oligonucleotide Market, 2016 – 2026 (USD Billion)
    6. 5.6. Latin America
      1. 5.6.1. Latin America Oligonucleotide Market, 2016 – 2026 (USD Billion)
        1. 5.6.1.1. Latin America Oligonucleotide Market, by Country, 2016 - 2026 (USD Billion)
      2. 5.6.2. Latin America Oligonucleotide Market, by Product, 2016 – 2026
        1. 5.6.2.1. Latin America Oligonucleotide Market, by Product, 2016 – 2026 (USD Billion)
      3. 5.6.3. Latin America Oligonucleotide Market, by Application, 2016 – 2026
        1. 5.6.3.1. Latin America Oligonucleotide Market, by Application, 2016 – 2026 (USD Billion)
      4. 5.6.4. Latin America Oligonucleotide Market, by End-User, 2016 – 2026
        1. 5.6.4.1. Latin America Oligonucleotide Market, by End-User, 2016 – 2026 (USD Billion)
      5. 5.6.5. Brazil
        1. 5.6.5.1. Brazil Oligonucleotide Market, 2016 – 2026 (USD Billion)
      6. 5.6.6. Mexico
        1. 5.6.6.1. Mexico Oligonucleotide Market, 2016 – 2026 (USD Billion)
      7. 5.6.7. Rest of Latin America
        1. 5.6.7.1. Rest of Latin America Oligonucleotide Market, 2016 – 2026 (USD Billion)
    7. 5.7. The Middle-East and Africa
      1. 5.7.1. The Middle-East and Africa Oligonucleotide Market, 2016 – 2026 (USD Billion)
        1. 5.7.1.1. The Middle-East and Africa Oligonucleotide Market, by Country, 2016 - 2026 (USD Billion)
      2. 5.7.2. The Middle-East and Africa Oligonucleotide Market, by Product, 2016 – 2026
        1. 5.7.2.1. The Middle-East and Africa Oligonucleotide Market, by Product, 2016 – 2026 (USD Billion)
      3. 5.7.3. The Middle-East and Africa Oligonucleotide Market, by Application, 2016 – 2026
        1. 5.7.3.1. The Middle-East and Africa Oligonucleotide Market, by Application, 2016 – 2026 (USD Billion)
      4. 5.7.4. The Middle-East and Africa Oligonucleotide Market, by End-User, 2016 – 2026
        1. 5.7.4.1. The Middle-East and Africa Oligonucleotide Market, by End-User, 2016 – 2026 (USD Billion)
      5. 5.7.5. GCC Countries
        1. 5.7.5.1. GCC Countries Oligonucleotide Market, 2016 – 2026 (USD Billion)
      6. 5.7.6. South Africa
        1. 5.7.6.1. South Africa Oligonucleotide Market, 2016 – 2026 (USD Billion)
      7. 5.7.7. Rest of Middle-East Africa
        1. 5.7.7.1. Rest of Middle-East Africa Oligonucleotide Market, 2016 – 2026 (USD Billion)
  6. Chapter 6 Oligonucleotide Market – Competitive Landscape
    1. 6.1. Competitor Market Share – Revenue
    2. 6.2. Market Concentration Rate Analysis, Top 3 and Top 5 Players
    3. 6.3. Strategic Developments
      1. 6.3.1. Acquisitions and Mergers
      2. 6.3.2. New Products
      3. 6.3.3. Research & Development Activities
  7. Chapter 7 Company Profiles
    1. 7.1. Danaher Corporation
      1. 7.1.1. Company Overview
      2. 7.1.2. Product/Service Portfolio
      3. 7.1.3. Danaher Corporation Sales, Revenue, and Gross Margin
      4. 7.1.4. Danaher Corporation Revenue and Growth Rate
      5. 7.1.5. Danaher Corporation Market Share
      6. 7.1.6. Recent Initiatives, Funding/VC Activities, and Technological Innovations
    2. 7.2. Thermo Fischer Scientific Inc
      1. 7.2.1. Company Overview
      2. 7.2.2. Product/Service Portfolio
      3. 7.2.3. Thermo Fischer Scientific Inc Sales, Revenue, and Gross Margin
      4. 7.2.4. Thermo Fischer Scientific Inc Revenue and Growth Rate
      5. 7.2.5. Thermo Fischer Scientific Inc Market Share
      6. 7.2.6. Recent Initiatives, Funding/VC Activities, and Technological Innovations
    3. 7.3. Merck KGaA
      1. 7.3.1. Company Overview
      2. 7.3.2. Product/Service Portfolio
      3. 7.3.3. Merck KGaA Sales, Revenue, and Gross Margin
      4. 7.3.4. Merck KGaA Revenue and Growth Rate
      5. 7.3.5. Merck KGaA Market Share
      6. 7.3.6. Recent Initiatives, Funding/VC Activities, and Technological Innovations
    4. 7.4. LGC Limited
      1. 7.4.1. Company Overview
      2. 7.4.2. Product/Service Portfolio
      3. 7.4.3. LGC Limited Sales, Revenue, and Gross Margin
      4. 7.4.4. LGC Limited Revenue and Growth Rate
      5. 7.4.5. LGC Limited Market Share
      6. 7.4.6. Recent Initiatives, Funding/VC Activities, and Technological Innovations
    5. 7.5. Maravai Life Science
      1. 7.5.1. Company Overview
      2. 7.5.2. Product/Service Portfolio
      3. 7.5.3. Maravai Life Science Sales, Revenue, and Gross Margin
      4. 7.5.4. Maravai Life Science Revenue and Growth Rate
      5. 7.5.5. Maravai Life Science Market Share
      6. 7.5.6. Recent Initiatives, Funding/VC Activities, and Technological Innovations
    6. 7.6. Biogen Inc
      1. 7.6.1. Company Overview
      2. 7.6.2. Product/Service Portfolio
      3. 7.6.3. Biogen Inc Sales, Revenue, and Gross Margin
      4. 7.6.4. Biogen Inc Revenue and Growth Rate
      5. 7.6.5. Biogen Inc Market Share
      6. 7.6.6. Recent Initiatives, Funding/VC Activities, and Technological Innovations
    7. 7.7. Sarepta Therapeutics Inc
      1. 7.7.1. Company Overview
      2. 7.7.2. Product/Service Portfolio
      3. 7.7.3. Sarepta Therapeutics Inc Sales, Revenue, and Gross Margin
      4. 7.7.4. Sarepta Therapeutics Inc Revenue and Growth Rate
      5. 7.7.5. Sarepta Therapeutics Inc Market Share
      6. 7.7.6. Recent Initiatives, Funding/VC Activities, and Technological Innovations
    8. 7.8. Alnylam Pharmaceuticals Inc
      1. 7.8.1. Company Overview
      2. 7.8.2. Product/Service Portfolio
      3. 7.8.3. Alnylam Pharmaceuticals Inc Sales, Revenue, and Gross Margin
      4. 7.8.4. Alnylam Pharmaceuticals Inc Revenue and Growth Rate
      5. 7.8.5. Alnylam Pharmaceuticals Inc Market Share
      6. 7.8.6. Recent Initiatives, Funding/VC Activities, and Technological Innovations
    9. 7.9. Eurofins Corporation
      1. 7.9.1. Company Overview
      2. 7.9.2. Product/Service Portfolio
      3. 7.9.3. Eurofins Corporation Sales, Revenue, and Gross Margin
      4. 7.9.4. Eurofins Corporation Revenue and Growth Rate
      5. 7.9.5. Eurofins Corporation Market Share
      6. 7.9.6. Recent Initiatives, Funding/VC Activities, and Technological Innovations
    10. 7.10. Ionis Pharmaceuticals Inc
      1. 7.10.1. Company Overview
      2. 7.10.2. Product/Service Portfolio
      3. 7.10.3. Ionis Pharmaceuticals Inc Sales, Revenue, and Gross Margin
      4. 7.10.4. Ionis Pharmaceuticals Inc Revenue and Growth Rate
      5. 7.10.5. Ionis Pharmaceuticals Inc Market Share
      6. 7.10.6. Recent Initiatives, Funding/VC Activities, and Technological Innovations
    11. 7.11. Kaneka Corporation
      1. 7.11.1. Company Overview
      2. 7.11.2. Product/Service Portfolio
      3. 7.11.3. Kaneka Corporation Sales, Revenue, and Gross Margin
      4. 7.11.4. Kaneka Corporation Revenue and Growth Rate
      5. 7.11.5. Kaneka Corporation Market Share
      6. 7.11.6. Recent Initiatives, Funding/VC Activities, and Technological Innovations
    12. 7.12. Agilent Technologies Inc
      1. 7.12.1. Company Overview
      2. 7.12.2. Product/Service Portfolio
      3. 7.12.3. Agilent Technologies Inc Sales, Revenue, and Gross Margin
      4. 7.12.4. Agilent Technologies Inc Revenue and Growth Rate
      5. 7.12.5. Agilent Technologies Inc Market Share
      6. 7.12.6. Recent Initiatives, Funding/VC Activities, and Technological Innovations
      7. 7.13. G.E Healthcare
      8. 7.13.1. Company Overview
      9. 7.13.2. Product/Service Portfolio
        1. 7.13.3. G.E Healthcare Sales, Revenue, and Gross Margin
        2. 7.13.4. G.E Healthcare Revenue and Growth Rate
        3. 7.13.5. G.E Healthcare Market Share
      10. 7.13.6. Recent Initiatives, Funding/VC Activities, and Technological Innovations
  8. Chapter 8 Oligonucleotide — Industry Analysis
    1. 8.1. Introduction and Taxonomy
    2. 8.2. Oligonucleotide Market – Key Trends
      1. 8.2.1. Market Drivers
      2. 8.2.2. Market Restraints
      3. 8.2.3. Market Opportunities
    3. 8.3. Value Chain Analysis
    4. 8.4. Key Mandates and Regulations
    5. 8.5. Technology Roadmap and Timeline
    6. 8.6. Oligonucleotide Market – Attractiveness Analysis
      1. 8.6.1. By Product
      2. 8.6.2. By Application
      3. 8.6.3. By End-User
      4. 8.6.4. By Region
  9. Chapter 9 Industrial Chain, Sourcing Strategy, and Downstream Buyers
    1. 9.1. Oligonucleotide Industrial Chain Analysis
    2. 9.2. Downstream Buyers
    3. 9.3. Distributors/Traders List
  10. Chapter 10 Marketing Strategy Analysis
    1. 10.1. Marketing Channel
    2. 10.2. Direct Marketing
    3. 10.3. Indirect Marketing
    4. 10.4. Marketing Channel Development Trends
    5. 10.5. Economic/Political Environmental Change
  11. Chapter 11 Report Conclusion & Key Insights
    1. 11.1. Key Insights from Primary Interviews & Surveys Respondents
    2. 11.2. Key Takeaways from Analysts, Consultants, and Industry Leaders
  12. Chapter 12 Research Approach & Methodology
    1. 12.1. Report Description
    2. 12.2. Research Scope
    3. 12.3. Research Methodology
      1. 12.3.1. Secondary Research
      2. 12.3.2. Primary Research
      3. 12.3.3. Statistical Models
        1. 12.3.3.1. Company Share Analysis Model
        2. 12.3.3.2. Revenue Based Modeling
      4. 12.3.4. Research Limitations

      List of Figures

      Fig.1	Product Picture of Oligonucleotide
      Fig.2	Global Oligonucleotide  Market, 2016 – 2026 (USD Billion)
      Fig.3	Global Oligonucleotide  Market Absolute Revenue Opportunity, 2016 – 2026 (USD Billion)
      Fig.4	Global Oligonucleotide  Market Incremental Revenue Opportunity, 2020 – 2026 (USD Billion)
      Fig.5	Global Oligonucleotide  Market Share, by Product, 2019 & 2026 (USD Billion)
      Fig.6	Global Oligonucleotide-Based Drugs  Oligonucleotide  Market, 2016 – 2026 (USD Billion)
      Fig.7	Global Synthesized Oligonucleotide Oligonucleotide  Market, 2016 – 2026 (USD Billion)
      Fig.8	Global Reagents Oligonucleotide  Market, 2016 – 2026 (USD Billion)
      Fig.9	Global Equipment Oligonucleotide  Market, 2016 – 2026 (USD Billion)
      Fig.10	Global Oligonucleotide  Market Share, by Application, 2019 & 2026 (USD Billion)
      Fig.11	Global Research Application  Oligonucleotide  Market, 2016 – 2026 (USD Billion)
      Fig.12	Global Diagnostic Applications Oligonucleotide  Market, 2016 – 2026 (USD Billion)
      Fig.13	Global Oligonucleotide  Market Share, by End-User, 2019 & 2026 (USD Billion)
      Fig.14	Global Hospitals  Oligonucleotide  Market, 2016 – 2026 (USD Billion)
      Fig.15	Global Pharmaceutical & Biological Companies  Oligonucleotide  Market, 2016 – 2026 (USD Billion)
      Fig.16	Global Diagnostics Laboratories Oligonucleotide  Market, 2016 – 2026 (USD Billion)
      Fig.17	Global Contact Manufacturing Organization (CMOs)  Oligonucleotide  Market, 2016 – 2026 (USD Billion)
      Fig.18	Global Contract Research Organizations (CROs) Oligonucleotide  Market, 2016 – 2026 (USD Billion)
      Fig.19	Global Oligonucleotide  Market Share, by Region, 2019 & 2026 (USD Billion)
      Fig.20	North America Oligonucleotide  Market, 2016 – 2026 (USD Billion)
      Fig.21	U.S. Oligonucleotide  Market, 2016 – 2026 (USD Billion)
      Fig.22	Canada Oligonucleotide  Market, 2016 – 2026 (USD Billion)
      Fig.23	Europe Oligonucleotide  Market, 2016 – 2026 (USD Billion)
      Fig.24	Germany Oligonucleotide  Market, 2016 – 2026 (USD Billion)
      Fig.25	France Oligonucleotide  Market, 2016 – 2026 (USD Billion)
      Fig.26	U.K. Oligonucleotide  Market, 2016 – 2026 (USD Billion)
      Fig.27	Italy Oligonucleotide  Market, 2016 – 2026 (USD Billion)
      Fig.28	Spain Oligonucleotide  Market, 2016 – 2026 (USD Billion)
      Fig.29	Rest of Europe Oligonucleotide  Market, 2016 – 2026 (USD Billion)
      Fig.30	Asia Pacific Oligonucleotide  Market, 2016 – 2026 (USD Billion)
      Fig.31	China Oligonucleotide  Market, 2016 – 2026 (USD Billion)
      Fig.32	Japan Oligonucleotide  Market, 2016 – 2026 (USD Billion)
      Fig.33	India Oligonucleotide  Market, 2016 – 2026 (USD Billion)
      Fig.34	South  Korea Oligonucleotide  Market, 2016 – 2026 (USD Billion)
      Fig.35	South-East Asia Oligonucleotide  Market, 2016 – 2026 (USD Billion)
      Fig.36	Rest of Asia Pacific Oligonucleotide  Market, 2016 – 2026 (USD Billion)
      Fig.37	Latin America Oligonucleotide  Market, 2016 – 2026 (USD Billion)
      Fig.38	Brazil Oligonucleotide  Market, 2016 – 2026 (USD Billion)
      Fig.39	Mexico Oligonucleotide  Market, 2016 – 2026 (USD Billion)
      Fig.40	Rest of Latin America Oligonucleotide  Market, 2016 – 2026 (USD Billion)
      Fig.41	The Middle-East and Africa Oligonucleotide  Market, 2016 – 2026 (USD Billion)
      Fig.42	GCC Countries Oligonucleotide  Market, 2016 – 2026 (USD Billion)
      Fig.43	South Africa Oligonucleotide  Market, 2016 – 2026 (USD Billion)
      Fig.44	Rest of Middle-East Africa Oligonucleotide  Market, 2016 – 2026 (USD Billion)
      Fig.45	Competitor Market Share – Revenue
      Fig.46	Danaher Corporation Revenue and Growth Rate
      Fig.47	Danaher Corporation Market Share
      Fig.48	Thermo Fischer Scientific Inc Revenue and Growth Rate
      Fig.49	Thermo Fischer Scientific Inc Market Share
      Fig.50	Merck KGaA Revenue and Growth Rate
      Fig.51	Merck KGaA Market Share
      Fig.52	LGC Limited Revenue and Growth Rate
      Fig.53	LGC Limited Market Share
      Fig.54	Maravai Life Science Revenue and Growth Rate
      Fig.55	Maravai Life Science Market Share
      Fig.56	Biogen Inc Revenue and Growth Rate
      Fig.57	Biogen Inc Market Share
      Fig.58	Sarepta Therapeutics Inc Revenue and Growth Rate
      Fig.59	Sarepta Therapeutics Inc Market Share
      Fig.60	Alnylam Pharmaceuticals Inc Revenue and Growth Rate
      Fig.61	Alnylam Pharmaceuticals Inc Market Share
      Fig.62	Eurofins Corporation Revenue and Growth Rate
      Fig.63	Eurofins Corporation Market Share
      Fig.64	Ionis Pharmaceuticals Inc Revenue and Growth Rate
      Fig.65	Ionis Pharmaceuticals Inc Market Share
      Fig.66	Kaneka Corporation Revenue and Growth Rate
      Fig.67	Kaneka Corporation Market Share
      Fig.68	Agilent Technologies Inc Revenue and Growth Rate
      Fig.69	Agilent Technologies Inc Market Share
      Fig.70	G.E Healthcare Revenue and Growth Rate
      Fig.71	G.E Healthcare Market Share
      Fig.72	Market Dynamics
      Fig.73	Global Oligonucleotide  – Value Chain Analysis
      Fig.74	Key Mandates and Regulations
      Fig.75	Technology Roadmap and Timeline
      Fig.76	Market Attractiveness Analysis – By Product
      Fig.77	Market Attractiveness Analysis – By Application
      Fig.78	Market Attractiveness Analysis – By End-User
      Fig.79	Market Attractiveness Analysis – By Region
      Fig.80	Oligonucleotide  Industrial Chain Analysis
      Fig.81	Market Channels
      Fig.82	Marketing Channel Development Trend
      Fig.83	Growth in World Gross Product, 2008-2018
      

      List of Tables

      Table 1	Global Oligonucleotide  Market, 2019 & 2026 (USD Billion)
      Table 2	Global Oligonucleotide  Market, by Product, 2016 – 2026 (USD Billion)
      Table 3	Global Oligonucleotide  Market, by Application, 2016 – 2026 (USD Billion)
      Table 4	Global Oligonucleotide  Market, by End-User, 2016 – 2026 (USD Billion)
      Table 5	Global Oligonucleotide  Market, by Region, 2016 – 2026 (USD Billion)
      Table 6	North America Oligonucleotide  Market, by Country, 2016 – 2026 (USD Billion)
      Table 7	North America Oligonucleotide  Market, by Product, 2016 – 2026 (USD Billion)
      Table 8	North America Oligonucleotide  Market, by Application, 2016 – 2026 (USD Billion)
      Table 9	North America Oligonucleotide  Market, by End-User, 2016 – 2026 (USD Billion)
      Table 10 Europe Oligonucleotide  Market, by Country, 2016 – 2026 (USD Billion)
      Table 11 Europe Oligonucleotide  Market, by Product, 2016 – 2026 (USD Billion)
      Table 12 Europe Oligonucleotide  Market, by Application, 2016 – 2026 (USD Billion)
      Table 13 Europe Oligonucleotide  Market, by End-User, 2016 – 2026 (USD Billion)
      Table 14 Asia Pacific Oligonucleotide  Market, by Country, 2016 – 2026 (USD Billion)
      Table 15 Asia Pacific Oligonucleotide  Market, by Product, 2016 – 2026 (USD Billion)
      Table 16 Asia Pacific Oligonucleotide  Market, by Application, 2016 – 2026 (USD Billion)
      Table 17 Asia Pacific Oligonucleotide  Market, by End-User, 2016 – 2026 (USD Billion)
      Table 18 Latin America Oligonucleotide  Market, by Country, 2016 – 2026 (USD Billion)
      Table 19 Latin America Oligonucleotide  Market, by Product, 2016 – 2026 (USD Billion)
      Table 20 Latin America Oligonucleotide  Market, by Application, 2016 – 2026 (USD Billion)
      Table 21 Latin America Oligonucleotide  Market, by End-User, 2016 – 2026 (USD Billion)
      Table 22 The Middle-East and Africa Oligonucleotide  Market, by Country, 2016 – 2026 (USD Billion)
      Table 23 The Middle-East and Africa Oligonucleotide  Market, by Product, 2016 – 2026 (USD Billion)
      Table 24 The Middle-East and Africa Oligonucleotide  Market, by Application, 2016 – 2026 (USD Billion)
      Table 25 The Middle-East and Africa Oligonucleotide  Market, by End-User, 2016 – 2026 (USD Billion)
      Table 26 Global Oligonucleotide  Market - Company Revenue Analysis, 2016 – 2019 (USD Billion)
      Table 27 Global Oligonucleotide  Market - Company Revenue Share Analysis, 2016 – 2019 (%)
      Table 28 Acquisitions and Mergers
      Table 29 Market Drivers – Impact Analysis
      Table 30 Market Restraints
      Table 31 Market Opportunities
      Table 32 Major Buyers of Oligonucleotide
      Table 33 Distributors/Traders of Oligonucleotide  by Region
      

Industry Major Market Players

  • Danaher Corporation
  • Thermo Fischer Scientific Inc.
  • Merck KGaA
  • LGC Limited
  • Maravai Life Sciences
  • Biogen Inc.
  • SareptaTherapeutics Inc.
  • Alnylam Pharmaceuticals Inc.
  • Eurofins Corporation
  • Ionis Pharmaceuticals Inc.
  • Kaneka Corporation
  • Agilent Technologies Inc.
  • G.E Healthcare