Chapter 1 Executive Summary
1.1. Introduction of Next Generation Sequencing (NGS)
1.2. Global Next Generation Sequencing (NGS) Market, 2019 & 2026 (USD Million)
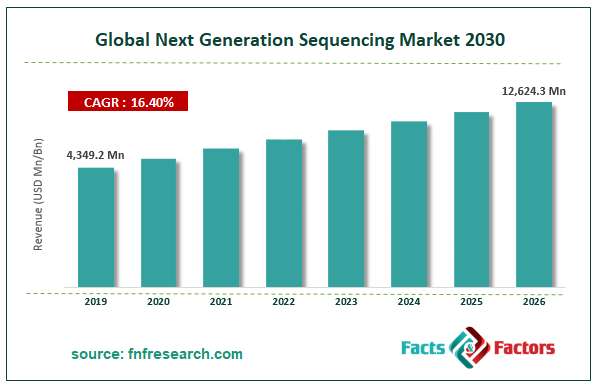
1.3. Global Next Generation Sequencing (NGS) Market, 2016 – 2026 (USD Million)
1.4. Global Next Generation Sequencing (NGS) Market Absolute Revenue Opportunity, 2016 – 2026 (USD Million)
1.5. Global Next Generation Sequencing (NGS) Market Incremental Revenue Opportunity, 2020 – 2026 (USD Million)
1.6. COVID-19 Impacts on Next Generation Sequencing Market
1.6.1. COVID-19 Impact on the Players
1.6.2. Business Strategies and Recommendations
Chapter 2 Next Generation Sequencing (NGS) Market – Application Analysis
2.1. Global Next Generation Sequencing (NGS) Market – Application Overview
2.2. Global Next Generation Sequencing (NGS) Market Share, by Application, 2019 & 2026 (USD Million)
2.3. Oncology
2.3.1. Global Oncology Next Generation Sequencing (NGS) Market, 2016 – 2026 (USD Million)
2.4. Clinical Investigation
2.4.1. Global Clinical Investigation Next Generation Sequencing (NGS) Market, 2016 – 2026 (USD Million)
2.5. Reproductive Health
2.5.1. Global Reproductive Health Next Generation Sequencing (NGS) Market, 2016 – 2026 (USD Million)
2.6. Metagenomics, Epidemiology & Drug Development
2.6.1. Global Metagenomics, Epidemiology & Drug Development Next Generation Sequencing (NGS) Market, 2016 – 2026 (USD Million)
2.7. HLA Typing/Immune System Monitoring
2.7.1. Global HLA Typing/Immune System Monitoring Next Generation Sequencing (NGS) Market, 2016 – 2026 (USD Million)
2.8. Consumer Genomics
2.8.1. Global Consumer Genomics Next Generation Sequencing (NGS) Market, 2016 – 2026 (USD Million)
2.9. Agrigenomics & Forensics
2.9.1. Global Agrigenomics & Forensics Next Generation Sequencing (NGS) Market, 2016 – 2026 (USD Million)
Chapter 3 Next Generation Sequencing (NGS) Market – Technology Analysis
3.1. Global Next Generation Sequencing (NGS) Market – Technology Overview
3.2. Global Next Generation Sequencing (NGS) Market Share, by Technology, 2019 & 2026 (USD Million)
3.3. Whole Genome Sequencing
3.3.1. Global Whole Genome Sequencing Next Generation Sequencing (NGS) Market, 2016 – 2026 (USD Million)
3.4. Whole Exome Sequencing
3.4.1. Global Whole Exome Sequencing Next Generation Sequencing (NGS) Market, 2016 – 2026 (USD Million)
3.5. Targeted Sequencing & Resequencing
3.5.1. Global Targeted Sequencing & Resequencing Next Generation Sequencing (NGS) Market, 2016 – 2026 (USD Million)
Chapter 4 Next Generation Sequencing (NGS) Market – End-Use Analysis
4.1. Global Next Generation Sequencing (NGS) Market – End-Use Overview
4.2. Global Next Generation Sequencing (NGS) Market Share, by End-Use, 2019 & 2026 (USD Million)
4.3. Academic Research
4.3.1. Global Academic Research Next Generation Sequencing (NGS) Market, 2016 – 2026 (USD Million)
4.4. Clinical Research
4.4.1. Global Clinical Research Next Generation Sequencing (NGS) Market, 2016 – 2026 (USD Million)
4.5. Hospitals & Clinics
4.5.1. Global Hospitals & Clinics Next Generation Sequencing (NGS) Market, 2016 – 2026 (USD Million)
4.6. Pharma & Biotech Entities
4.6.1. Global Pharma & Biotech Entities Next Generation Sequencing (NGS) Market, 2016 – 2026 (USD Million)
4.7. Other users
4.7.1. Global Other users Next Generation Sequencing (NGS) Market, 2016 – 2026 (USD Million)
Chapter 5 Next Generation Sequencing (NGS) Market – Regional Analysis
5.1. Global Next Generation Sequencing (NGS) Market Regional Overview
5.2. Global Next Generation Sequencing (NGS) Market Share, by Region, 2019 & 2026 (USD Million)
5.3. North America
5.3.1. North America Next Generation Sequencing (NGS) Market, 2016 – 2026 (USD Million)
5.3.1.1. North America Next Generation Sequencing (NGS) Market, by Country, 2016 - 2026 (USD Million)
5.3.2. North America Next Generation Sequencing (NGS) Market, by Application, 2016 – 2026
5.3.2.1. North America Next Generation Sequencing (NGS) Market, by Application, 2016 – 2026 (USD Million)
5.3.3. North America Next Generation Sequencing (NGS) Market, by Technology, 2016 – 2026
5.3.3.1. North America Next Generation Sequencing (NGS) Market, by Technology, 2016 – 2026 (USD Million)
5.3.4. North America Next Generation Sequencing (NGS) Market, by End-Use, 2016 – 2026
5.3.4.1. North America Next Generation Sequencing (NGS) Market, by End-Use, 2016 – 2026 (USD Million)
5.3.5. U.S.
5.3.5.1. U.S. Next Generation Sequencing (NGS) Market, 2016 – 2026 (USD Million)
5.3.6. Canada
5.3.6.1. Canada Next Generation Sequencing (NGS) Market, 2016 – 2026 (USD Million)
5.4. Europe
5.4.1. Europe Next Generation Sequencing (NGS) Market, 2016 – 2026 (USD Million)
5.4.1.1. Europe Next Generation Sequencing (NGS) Market, by Country, 2016 - 2026 (USD Million)
5.4.2. Europe Next Generation Sequencing (NGS) Market, by Application, 2016 – 2026
5.4.2.1. Europe Next Generation Sequencing (NGS) Market, by Application, 2016 – 2026 (USD Million)
5.4.3. Europe Next Generation Sequencing (NGS) Market, by Technology, 2016 – 2026
5.4.3.1. Europe Next Generation Sequencing (NGS) Market, by Technology, 2016 – 2026 (USD Million)
5.4.4. Europe Next Generation Sequencing (NGS) Market, by End-Use, 2016 – 2026
5.4.4.1. Europe Next Generation Sequencing (NGS) Market, by End-Use, 2016 – 2026 (USD Million)
5.4.5. Germany
5.4.5.1. Germany Next Generation Sequencing (NGS) Market, 2016 – 2026 (USD Million)
5.4.6. France
5.4.6.1. France Next Generation Sequencing (NGS) Market, 2016 – 2026 (USD Million)
5.4.7. U.K.
5.4.7.1. U.K. Next Generation Sequencing (NGS) Market, 2016 – 2026 (USD Million)
5.4.8. Italy
5.4.8.1. Italy Next Generation Sequencing (NGS) Market, 2016 – 2026 (USD Million)
5.4.9. Spain
5.4.9.1. Spain Next Generation Sequencing (NGS) Market, 2016 – 2026 (USD Million)
5.4.10. Rest of Europe
5.4.10.1. Rest of Europe Next Generation Sequencing (NGS) Market, 2016 – 2026 (USD Million)
5.5. Asia Pacific
5.5.1. Asia Pacific Next Generation Sequencing (NGS) Market, 2016 – 2026 (USD Million)
5.5.1.1. Asia Pacific Next Generation Sequencing (NGS) Market, by Country, 2016 - 2026 (USD Million)
5.5.2. Asia Pacific Next Generation Sequencing (NGS) Market, by Application, 2016 – 2026
5.5.2.1. Asia Pacific Next Generation Sequencing (NGS) Market, by Application, 2016 – 2026 (USD Million)
5.5.3. Asia Pacific Next Generation Sequencing (NGS) Market, by Technology, 2016 – 2026
5.5.3.1. Asia Pacific Next Generation Sequencing (NGS) Market, by Technology, 2016 – 2026 (USD Million)
5.5.4. Asia Pacific Next Generation Sequencing (NGS) Market, by End-Use, 2016 – 2026
5.5.4.1. Asia Pacific Next Generation Sequencing (NGS) Market, by End-Use, 2016 – 2026 (USD Million)
5.5.5. China
5.5.5.1. China Next Generation Sequencing (NGS) Market, 2016 – 2026 (USD Million)
5.5.6. Japan
5.5.6.1. Japan Next Generation Sequencing (NGS) Market, 2016 – 2026 (USD Million)
5.5.7. India
5.5.7.1. India Next Generation Sequencing (NGS) Market, 2016 – 2026 (USD Million)
5.5.8. South Korea
5.5.8.1. South Korea Next Generation Sequencing (NGS) Market, 2016 – 2026 (USD Million)
5.5.9. South-East Asia
5.5.9.1. South-East Asia Next Generation Sequencing (NGS) Market, 2016 – 2026 (USD Million)
5.5.10. Rest of Asia Pacific
5.5.10.1. Rest of Asia Pacific Next Generation Sequencing (NGS) Market, 2016 – 2026 (USD Million)
5.6. Latin America
5.6.1. Latin America Next Generation Sequencing (NGS) Market, 2016 – 2026 (USD Million)
5.6.1.1. Latin America Next Generation Sequencing (NGS) Market, by Country, 2016 - 2026 (USD Million)
5.6.2. Latin America Next Generation Sequencing (NGS) Market, by Application, 2016 – 2026
5.6.2.1. Latin America Next Generation Sequencing (NGS) Market, by Application, 2016 – 2026 (USD Million)
5.6.3. Latin America Next Generation Sequencing (NGS) Market, by Technology, 2016 – 2026
5.6.3.1. Latin America Next Generation Sequencing (NGS) Market, by Technology, 2016 – 2026 (USD Million)
5.6.4. Latin America Next Generation Sequencing (NGS) Market, by End-Use, 2016 – 2026
5.6.4.1. Latin America Next Generation Sequencing (NGS) Market, by End-Use, 2016 – 2026 (USD Million)
5.6.5. Brazil
5.6.5.1. Brazil Next Generation Sequencing (NGS) Market, 2016 – 2026 (USD Million)
5.6.6. Mexico
5.6.6.1. Mexico Next Generation Sequencing (NGS) Market, 2016 – 2026 (USD Million)
5.6.7. Rest of Latin America
5.6.7.1. Rest of Latin America Next Generation Sequencing (NGS) Market, 2016 – 2026 (USD Million)
5.7. The Middle-East and Africa
5.7.1. The Middle-East and Africa Next Generation Sequencing (NGS) Market, 2016 – 2026 (USD Million)
5.7.1.1. The Middle-East and Africa Next Generation Sequencing (NGS) Market, by Country, 2016 - 2026 (USD Million)
5.7.2. The Middle-East and Africa Next Generation Sequencing (NGS) Market, by Application, 2016 – 2026
5.7.2.1. The Middle-East and Africa Next Generation Sequencing (NGS) Market, by Application, 2016 – 2026 (USD Million)
5.7.3. The Middle-East and Africa Next Generation Sequencing (NGS) Market, by Technology, 2016 – 2026
5.7.3.1. The Middle-East and Africa Next Generation Sequencing (NGS) Market, by Technology, 2016 – 2026 (USD Million)
5.7.4. The Middle-East and Africa Next Generation Sequencing (NGS) Market, by End-Use, 2016 – 2026
5.7.4.1. The Middle-East and Africa Next Generation Sequencing (NGS) Market, by End-Use, 2016 – 2026 (USD Million)
5.7.5. GCC Countries
5.7.5.1. GCC Countries Next Generation Sequencing (NGS) Market, 2016 – 2026 (USD Million)
5.7.6. South Africa
5.7.6.1. South Africa Next Generation Sequencing (NGS) Market, 2016 – 2026 (USD Million)
5.7.7. Rest of Middle-East Africa
5.7.7.1. Rest of Middle-East Africa Next Generation Sequencing (NGS) Market, 2016 – 2026 (USD Million)
Chapter 6 Next Generation Sequencing (NGS) Market – Competitive Landscape
6.1. Competitor Market Share – Revenue
6.2. Market Concentration Rate Analysis, Top 3 and Top 5 Players
6.3. Strategic Developments
6.3.1. Acquisitions and Mergers
6.3.2. New Products
6.3.3. Research & Development Activities
Chapter 7 Company Profiles
7.1. Genomatix GmbH
7.1.1. Company Overview
7.1.2. Product/Service Portfolio
7.1.3. Genomatix GmbH Sales, Revenue, and Gross Margin
7.1.4. Genomatix GmbH Revenue and Growth Rate
7.1.5. Genomatix GmbH Market Share
7.1.6. Recent Initiatives, Funding/VC Activities, and Technological Innovations
7.2. PierianDx
7.2.1. Company Overview
7.2.2. Product/Service Portfolio
7.2.3. PierianDx Sales, Revenue, and Gross Margin
7.2.4. PierianDx Revenue and Growth Rate
7.2.5. PierianDx Market Share
7.2.6. Recent Initiatives, Funding/VC Activities, and Technological Innovations
7.3. DNASTAR, Inc.
7.3.1. Company Overview
7.3.2. Product/Service Portfolio
7.3.3. DNASTAR, Inc. Sales, Revenue, and Gross Margin
7.3.4. DNASTAR, Inc. Revenue and Growth Rate
7.3.5. DNASTAR, Inc. Market Share
7.3.6. Recent Initiatives, Funding/VC Activities, and Technological Innovations
7.4. Illumina
7.4.1. Company Overview
7.4.2. Product/Service Portfolio
7.4.3. Illumina Sales, Revenue, and Gross Margin
7.4.4. Illumina Revenue and Growth Rate
7.4.5. Illumina Market Share
7.4.6. Recent Initiatives, Funding/VC Activities, and Technological Innovations
7.5. QIAGEN
7.5.1. Company Overview
7.5.2. Product/Service Portfolio
7.5.3. QIAGEN Sales, Revenue, and Gross Margin
7.5.4. QIAGEN Revenue and Growth Rate
7.5.5. QIAGEN Market Share
7.5.6. Recent Initiatives, Funding/VC Activities, and Technological Innovations
7.6. Thermo Fisher Scientific, Inc.
7.6.1. Company Overview
7.6.2. Product/Service Portfolio
7.6.3. Thermo Fisher Scientific, Inc. Sales, Revenue, and Gross Margin
7.6.4. Thermo Fisher Scientific, Inc. Revenue and Growth Rate
7.6.5. Thermo Fisher Scientific, Inc. Market Share
7.6.6. Recent Initiatives, Funding/VC Activities, and Technological Innovations
7.7. F. Hoffman-La Roche Ltd.
7.7.1. Company Overview
7.7.2. Product/Service Portfolio
7.7.3. F. Hoffman-La Roche Ltd. Sales, Revenue, and Gross Margin
7.7.4. F. Hoffman-La Roche Ltd. Revenue and Growth Rate
7.7.5. F. Hoffman-La Roche Ltd. Market Share
7.7.6. Recent Initiatives, Funding/VC Activities, and Technological Innovations
7.8. Oxford Nanopore Technologies
7.8.1. Company Overview
7.8.2. Product/Service Portfolio
7.8.3. Oxford Nanopore Technologies Sales, Revenue, and Gross Margin
7.8.4. Oxford Nanopore Technologies Revenue and Growth Rate
7.8.5. Oxford Nanopore Technologies Market Share
7.8.6. Recent Initiatives, Funding/VC Activities, and Technological Innovations
7.9. Eurofins GATC Biotech GmbH
7.9.1. Company Overview
7.9.2. Product/Service Portfolio
7.9.3. Eurofins GATC Biotech GmbH Sales, Revenue, and Gross Margin
7.9.4. Eurofins GATC Biotech GmbH Revenue and Growth Rate
7.9.5. Eurofins GATC Biotech GmbH Market Share
7.9.6. Recent Initiatives, Funding/VC Activities, and Technological Innovations
7.10. Perkin Elmer, Inc.
7.10.1. Company Overview
7.10.2. Product/Service Portfolio
7.10.3. Perkin Elmer, Inc. Sales, Revenue, and Gross Margin
7.10.4. Perkin Elmer, Inc. Revenue and Growth Rate
7.10.5. Perkin Elmer, Inc. Market Share
7.10.6. Recent Initiatives, Funding/VC Activities, and Technological Innovations
7.11. BGI
7.11.1. Company Overview
7.11.2. Product/Service Portfolio
7.11.3. BGI Sales, Revenue, and Gross Margin
7.11.4. BGI Revenue and Growth Rate
7.11.5. BGI Market Share
7.11.6. Recent Initiatives, Funding/VC Activities, and Technological Innovations
7.12. Bio-Rad Laboratories, Inc.
7.12.1. Company Overview
7.12.2. Product/Service Portfolio
7.12.3. Bio-Rad Laboratories, Inc. Sales, Revenue, and Gross Margin
7.12.4. Bio-Rad Laboratories, Inc. Revenue and Growth Rate
7.12.5. Bio-Rad Laboratories, Inc. Market Share
7.12.6. Recent Initiatives, Funding/VC Activities, and Technological Innovations
Chapter 8 Next Generation Sequencing (NGS) — Industry Analysis
8.1. Introduction and Taxonomy
8.2. Next Generation Sequencing (NGS) Market – Key Trends
8.2.1. Market Drivers
8.2.2. Market Restraints
8.2.3. Market Opportunities
8.3. Value Chain Analysis
8.4. Key Mandates and Regulations
8.5. Porter’s Five Forces Model
8.5.1. Bargaining Power of Buyers
8.5.2. Bargaining Power of Suppliers
8.5.3. Threat of Substitute
8.5.4. Threat of New Entrants
8.5.5. Rivalry among Existing Competitors
8.6. PESTEL Analysis
8.7. SWOT Analysis
8.8. Technology Roadmap and Timeline
8.9. Next Generation Sequencing (NGS) Market – Attractiveness Analysis
8.9.1. By Application
8.9.2. By Technology
8.9.3. By End-Use
8.9.4. By Region
Chapter 9 Report Conclusion & Key Insights
9.1. Key Insights from Primary Interviews & Surveys Respondents
9.2. Key Takeaways from Analysts, Consultants, and Industry Leaders
Chapter 10 Research Approach & Methodology
10.1. Report Description
10.2. Research Scope
10.3. Research Methodology
10.3.1. Secondary Research
10.3.2. Primary Research
10.3.3. Statistical Models
10.3.3.1. Company Share Analysis Model
10.3.3.2. Revenue Based Modeling
10.3.4. Research Limitations

List of Figures
Fig.1	Product Picture of Next Generation Sequencing (NGS)
Fig.2	Global Next Generation Sequencing (NGS) Market, 2016 – 2026 (USD Million)
Fig.3	Global Next Generation Sequencing (NGS) Market Absolute Revenue Opportunity, 2016 – 2026 (USD Million)
Fig.4	Global Next Generation Sequencing (NGS) Market Incremental Revenue Opportunity, 2020 – 2026 (USD Million)
Fig.5	COVID-19 Impacts on Next Generation Sequencing Market
Fig.6	COVID-19 Impact on the Players
Fig.7	Business Strategies and Recommendations
Fig.8	Global Next Generation Sequencing (NGS) Market Share, by Application, 2019 & 2026 (USD Million)
Fig.9	Global Oncology Next Generation Sequencing (NGS) Market, 2016 – 2026 (USD Million)
Fig.10	Global Clinical Investigation Next Generation Sequencing (NGS) Market, 2016 – 2026 (USD Million)
Fig.11	Global Reproductive Health Next Generation Sequencing (NGS) Market, 2016 – 2026 (USD Million)
Fig.12	Global Metagenomics, Epidemiology & Drug Development Next Generation Sequencing (NGS) Market, 2016 – 2026 (USD Million)
Fig.13	Global HLA Typing/Immune System Monitoring Next Generation Sequencing (NGS) Market, 2016 – 2026 (USD Million)
Fig.14	Global Consumer Genomics Next Generation Sequencing (NGS) Market, 2016 – 2026 (USD Million)
Fig.15	Global Agrigenomics & Forensics Next Generation Sequencing (NGS) Market, 2016 – 2026 (USD Million)
Fig.16	Global Next Generation Sequencing (NGS) Market Share, by Technology, 2019 & 2026 (USD Million)
Fig.17	Global Whole Genome Sequencing Next Generation Sequencing (NGS) Market, 2016 – 2026 (USD Million)
Fig.18	Global Whole Exome Sequencing Next Generation Sequencing (NGS) Market, 2016 – 2026 (USD Million)
Fig.19	Global Targeted Sequencing & Resequencing Next Generation Sequencing (NGS) Market, 2016 – 2026 (USD Million)
Fig.20	Global Next Generation Sequencing (NGS) Market Share, by End-Use, 2019 & 2026 (USD Million)
Fig.21	Global Academic Research Next Generation Sequencing (NGS) Market, 2016 – 2026 (USD Million)
Fig.22	Global Clinical Research Next Generation Sequencing (NGS) Market, 2016 – 2026 (USD Million)
Fig.23	Global Hospitals & Clinics Next Generation Sequencing (NGS) Market, 2016 – 2026 (USD Million)
Fig.24	Global Pharma & Biotech Entities Next Generation Sequencing (NGS) Market, 2016 – 2026 (USD Million)
Fig.25	Global Other users Next Generation Sequencing (NGS) Market, 2016 – 2026 (USD Million)
Fig.26	Global Next Generation Sequencing (NGS) Market Share, by Region, 2019 & 2026 (USD Million)
Fig.27	North America Next Generation Sequencing (NGS) Market, 2016 – 2026 (USD Million)
Fig.28	U.S. Next Generation Sequencing (NGS) Market, 2016 – 2026 (USD Million)
Fig.29	Canada Next Generation Sequencing (NGS) Market, 2016 – 2026 (USD Million)
Fig.30	Europe Next Generation Sequencing (NGS) Market, 2016 – 2026 (USD Million)
Fig.31	Germany Next Generation Sequencing (NGS) Market, 2016 – 2026 (USD Million)
Fig.32	France Next Generation Sequencing (NGS) Market, 2016 – 2026 (USD Million)
Fig.33	U.K. Next Generation Sequencing (NGS) Market, 2016 – 2026 (USD Million)
Fig.34	Italy Next Generation Sequencing (NGS) Market, 2016 – 2026 (USD Million)
Fig.35	Spain Next Generation Sequencing (NGS) Market, 2016 – 2026 (USD Million)
Fig.36	Rest of Europe Next Generation Sequencing (NGS) Market, 2016 – 2026 (USD Million)
Fig.37	Asia Pacific Next Generation Sequencing (NGS) Market, 2016 – 2026 (USD Million)
Fig.38	China Next Generation Sequencing (NGS) Market, 2016 – 2026 (USD Million)
Fig.39	Japan Next Generation Sequencing (NGS) Market, 2016 – 2026 (USD Million)
Fig.40	India Next Generation Sequencing (NGS) Market, 2016 – 2026 (USD Million)
Fig.41	South  Korea Next Generation Sequencing (NGS) Market, 2016 – 2026 (USD Million)
Fig.42	South-East Asia Next Generation Sequencing (NGS) Market, 2016 – 2026 (USD Million)
Fig.43	Rest of Asia Pacific Next Generation Sequencing (NGS) Market, 2016 – 2026 (USD Million)
Fig.44	Latin America Next Generation Sequencing (NGS) Market, 2016 – 2026 (USD Million)
Fig.45	Brazil Next Generation Sequencing (NGS) Market, 2016 – 2026 (USD Million)
Fig.46	Mexico Next Generation Sequencing (NGS) Market, 2016 – 2026 (USD Million)
Fig.47	Rest of Latin America Next Generation Sequencing (NGS) Market, 2016 – 2026 (USD Million)
Fig.48	The Middle-East and Africa Next Generation Sequencing (NGS) Market, 2016 – 2026 (USD Million)
Fig.49	GCC Countries Next Generation Sequencing (NGS) Market, 2016 – 2026 (USD Million)
Fig.50	South Africa Next Generation Sequencing (NGS) Market, 2016 – 2026 (USD Million)
Fig.51	Rest of Middle-East Africa Next Generation Sequencing (NGS) Market, 2016 – 2026 (USD Million)
Fig.52	Competitor Market Share – Revenue
Fig.53	Genomatix GmbH Revenue and Growth Rate
Fig.54	Genomatix GmbH Market Share
Fig.55	PierianDx Revenue and Growth Rate
Fig.56	PierianDx Market Share
Fig.57	DNASTAR, Inc. Revenue and Growth Rate
Fig.58	DNASTAR, Inc. Market Share
Fig.59	Illumina Revenue and Growth Rate
Fig.60	Illumina Market Share
Fig.61	QIAGEN Revenue and Growth Rate
Fig.62	QIAGEN Market Share
Fig.63	Thermo Fisher Scientific, Inc. Revenue and Growth Rate
Fig.64	Thermo Fisher Scientific, Inc. Market Share
Fig.65	F. Hoffman-La Roche Ltd. Revenue and Growth Rate
Fig.66	F. Hoffman-La Roche Ltd. Market Share
Fig.67	Oxford Nanopore Technologies Revenue and Growth Rate
Fig.68	Oxford Nanopore Technologies Market Share
Fig.69	Eurofins GATC Biotech GmbH Revenue and Growth Rate
Fig.70	Eurofins GATC Biotech GmbH Market Share
Fig.71	Perkin Elmer, Inc. Revenue and Growth Rate
Fig.72	Perkin Elmer, Inc. Market Share
Fig.73	BGI Revenue and Growth Rate
Fig.74	BGI Market Share
Fig.75	Bio-Rad Laboratories, Inc. Revenue and Growth Rate
Fig.76	Bio-Rad Laboratories, Inc. Market Share
Fig.77	Market Dynamics
Fig.78	Global Next Generation Sequencing (NGS) – Value Chain Analysis
Fig.79	Key Mandates and Regulations
Fig.80	PESTEL Analysis
Fig.81	SWOT Analysis
Fig.82	Technology Roadmap and Timeline
Fig.83	Market Attractiveness Analysis – By Application
Fig.84	Market Attractiveness Analysis – By Technology
Fig.85	Market Attractiveness Analysis – By End-Use
Fig.86	Market Attractiveness Analysis – By Region
List of Tables
Table 1	Global Next Generation Sequencing (NGS) Market, 2019 & 2026 (USD Million)
Table 2	Global Next Generation Sequencing (NGS) Market, by Application, 2016 – 2026 (USD Million)
Table 3	Global Next Generation Sequencing (NGS) Market, by Technology, 2016 – 2026 (USD Million)
Table 4	Global Next Generation Sequencing (NGS) Market, by End-Use, 2016 – 2026 (USD Million)
Table 5	Global Next Generation Sequencing (NGS) Market, by Region, 2016 – 2026 (USD Million)
Table 6	North America Next Generation Sequencing (NGS) Market, by Country, 2016 – 2026 (USD Million)
Table 7	North America Next Generation Sequencing (NGS) Market, by Application, 2016 – 2026 (USD Million)
Table 8	North America Next Generation Sequencing (NGS) Market, by Technology, 2016 – 2026 (USD Million)
Table 9	North America Next Generation Sequencing (NGS) Market, by End-Use, 2016 – 2026 (USD Million)
Table 10 Europe Next Generation Sequencing (NGS) Market, by Country, 2016 – 2026 (USD Million)
Table 11 Europe Next Generation Sequencing (NGS) Market, by Application, 2016 – 2026 (USD Million)
Table 12 Europe Next Generation Sequencing (NGS) Market, by Technology, 2016 – 2026 (USD Million)
Table 13 Europe Next Generation Sequencing (NGS) Market, by End-Use, 2016 – 2026 (USD Million)
Table 14 Asia Pacific Next Generation Sequencing (NGS) Market, by Country, 2016 – 2026 (USD Million)
Table 15 Asia Pacific Next Generation Sequencing (NGS) Market, by Application, 2016 – 2026 (USD Million)
Table 16 Asia Pacific Next Generation Sequencing (NGS) Market, by Technology, 2016 – 2026 (USD Million)
Table 17 Asia Pacific Next Generation Sequencing (NGS) Market, by End-Use, 2016 – 2026 (USD Million)
Table 18 Latin America Next Generation Sequencing (NGS) Market, by Country, 2016 – 2026 (USD Million)
Table 19 Latin America Next Generation Sequencing (NGS) Market, by Application, 2016 – 2026 (USD Million)
Table 20 Latin America Next Generation Sequencing (NGS) Market, by Technology, 2016 – 2026 (USD Million)
Table 21 Latin America Next Generation Sequencing (NGS) Market, by End-Use, 2016 – 2026 (USD Million)
Table 22 The Middle-East and Africa Next Generation Sequencing (NGS) Market, by Country, 2016 – 2026 (USD Million)
Table 23 The Middle-East and Africa Next Generation Sequencing (NGS) Market, by Application, 2016 – 2026 (USD Million)
Table 24 The Middle-East and Africa Next Generation Sequencing (NGS) Market, by Technology, 2016 – 2026 (USD Million)
Table 25 The Middle-East and Africa Next Generation Sequencing (NGS) Market, by End-Use, 2016 – 2026 (USD Million)
Table 26 Global Next Generation Sequencing (NGS) Market - Company Revenue Analysis, 2016 – 2019 (USD Million)
Table 27 Global Next Generation Sequencing (NGS) Market - Company Revenue Share Analysis, 2016 – 2019 (%)
Table 28 Acquisitions and Mergers
Table 29 Market Drivers – Impact Analysis
Table 30 Market Restraints
Table 31 Market Opportunities

 Market Overview

