Search Market Research Report

Discover Our Latest Reports
Discover Our Featured Reports
Discover Top Selling Reports

Neodecanoic Acid Market Size, Share Global Analysis Report, 2020–2026

report img

Neodecanoic Acid Market By Type (Neodecanoic acid (Versatics Acid C10), and Pivalic acid (Versatics acid C5)) and By Application (Adhesives, Chemical, and Intermediates, and Others): Global Industry Outlook, Market Size, Business Intelligence, Consumer Preferences, Statistical Surveys, Comprehensive Analysis, Historical Developments, Current Trends, and Forecast 2020–2026

Industry Insights

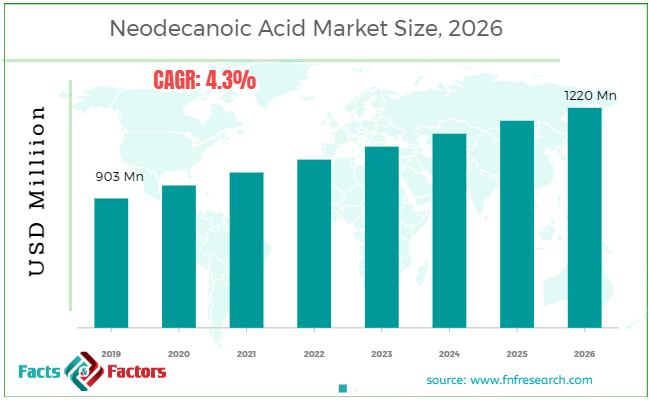
[189+ Pages Report] According to the report published by Facts Factors, the global neodecanoic acid market size was worth around USD 903 million in 2019 and is predicted to grow to around USD 1220 million by 2026 with a compound annual growth rate (CAGR) of roughly 4.3% between 2023 and 2030. The report analyzes the global neodecanoic acid market drivers, restraints/challenges, and the effect they have on the demands during the projection period. In addition, the report explores emerging opportunities in the neodecanoic acid market.

The neodecanoic acid market report analyzes and notifies the industry statistics at the global as well as regional and country levels in order to acquire a thorough perspective of the entire Neodecanoic Acid market. The historical and past insights are provided for FY 2016 to FY 2019 whereas projected trends are delivered for FY 2020 to FY 2026. The quantitative and numerical data is represented in terms of both volume (Units) and value (USD Million) from FY 2016 – 2026.

Neodecanoic Acid Market Size

To know more about this report | Request Free Sample Copy


logoKey Insights from Primary Research

  • As per our primary respondents, the global neodecanoic acid market is set to grow annually at a rate of around 4.3%
  • It was established through primary research that the neodecanoic acid market was valued at around USD 903 Million in 2019
  • Asia Pacific is presently holding the largest revenue share among all the regions and is further expected to maintain its position throughout the forecast period
  • On basis of product segment, neodecanoic acid (Versatics Acid C10) dominated the global neodecanoic acid market in 2019
  • Based on various applications, the global neodecanoic acid market was led by chemical intermediates in 2019.

logoKey Recommendations from Analysts

  • As per our analysts, the global neodecanoic acid market is expected to grow significantly over the forecast period.
  • The strategic and competitive advantage provided by the neodecanoic acid (Versatics Acid C10) is anticipated to be the key factor driving this market globally owing to its use in metal extraction or as lubricity additive in diesel.
  • As per analysts, growing developments in emerging countries will support the growth in upcoming years as neodecanoic acid is widely used in painting and coatings.
  • Our team of analysts has identified, rise in automotive industry will offer potential opportunities for the players operating in this market
  • In future years ahead, Asia Pacific is expected to be the fastest growing market for neodecanoic acid during the years to come.

The quantitative data is further underlined and reinforced by comprehensive qualitative data which comprises various across-the-board market dynamics. The rationales which directly or indirectly impact the Neodecanoic Acid industry are exemplified through parameters such as growth drivers, restraints, challenges, and opportunities among other impacting factors.

Throughout our research report, we have encompassed all the proven models and tools of industry analysis and extensively illustrated all the key business strategies and business models adopted in the Neodecanoic Acid industry. The report provides an all-inclusive and detailed competitive landscape prevalent in the Neodecanoic Acid market.

The report utilizes established industry analysis tools and models such as Porter’s Five Forces framework to analyze and recognize critical business strategies adopted by various stakeholders involved in the entire value chain of the Neodecanoic Acid industry. The Neodecanoic Acid market report additionally employs SWOT analysis and PESTLE analysis models for further in-depth analysis.

The report study further includes an in-depth analysis of industry players' market shares and provides an overview of leading players' market position in the Neodecanoic Acid sector. Key strategic developments in the Neodecanoic Acid market competitive landscape such as acquisitions & mergers, inaugurations of different products and services, partnerships & joint ventures, MoU agreements, VC & funding activities, R&D activities, and geographic expansion among other noteworthy activities by key players of the Neodecanoic Acid market are appropriately highlighted in the report.

Neodecanoic acids are widely used in industrial applications. Therefore, the growing construction and automotive domains had bolstered the sales of neodecanoic acid in recent years. Moreover, neodecanoic acid is used in several applications, including polymers, adhesion promoters, metal-working fluids, resins and coatings, hydraulic fluids, fuels, lubricants, metal-extraction, and electrical applications. This wide range of applications of neodecanoic acid is anticipated to proliferate the market growth of neodecanoic acid over the analysis period.

In addition, the derivatives of neo acids are glycidyl and vinyl esters. The vinyl esters, manufactured by Shell, are used primarily in coatings, but also in adhesives, cosmetics, construction, and in several miscellaneous areas. These glycidyl esters are manufactured by both Exxon and Shell and are used as intermediates for the production of acrylics and alkyds. Hence certain factors are supporting the growth of the global neodecanoic acid market in recent years.

The Neodecanoic Acid market research report delivers an acute valuation and taxonomy of the Neodecanoic Acid industry by practically splitting the market on the basis of different types, applications, and regions. Through the analysis of the historical and projected trends, all the segments and sub-segments were evaluated through the bottom-up approach, and different market sizes have been projected for FY 2020 to FY 2026.

logoReport Scope

Report Attribute

Details

Market Size in 2019

USD 903 Million

Projected Market Size in 2026

USD 1220 Million

CAGR Growth Rate

4.3% CAGR

Base Year

2019

Forecast Years

2020-2026

Key Market Players

Strem Chemicals Inc., United States Biological Inc., Hengshui Haoyang Medical Co., Ltd, Shell Chemical LP, Haihang Industry Co., Ltd., Hangzhou J & H Chemical Co., Ltd., Xiamen Hisunny Chemical Co., LTD, Hangzhou Dayangchem Co. Limited, Jinan Boss Chemical Industry Co., Ltd, Vizag Chemicals, Pon Pure Chemicals, Mehk Chemicals Private Limited, Hexion, Hubei Phoenix Chemical Company Ltd., and Exxon Mobil Corporation, and Others

Key Segment

By Type, Application, and Region

Major Regions Covered

North America, Europe, Asia Pacific, Latin America, and the Middle East & Africa

Purchase Options

Request customized purchase options to meet your research needs. Explore purchase options

The regional segmentation of the Neodecanoic Acid industry includes the complete classification of all the major continents including North America, Latin America, Europe, Asia Pacific, and Middle East & Africa. Further, country-wise data for the Neodecanoic Acid industry is provided for the leading economies of the world.

The global neodecanoic acid market is segmented into type, and application. Based on type, the global neodecanoic acid market is bifurcated into neodecanoic acid, and pivalic acid. Furthermore, on the basis of applications, the market has been fragmented into adhesives, chemical intermediates, and others.

logoThe key players contributing in the global neodecanoic acid market are

  • Strem Chemicals Inc.
  • United States Biological Inc.
  • Hengshui Haoyang Medical Co. Ltd
  • Shell Chemical LP
  • Haihang Industry Co. Ltd.
  • Hangzhou J & H Chemical Co. Ltd.
  • Xiamen Hisunny Chemical Co. LTD
  • Hangzhou Dayangchem Co. Limited
  • Jinan Boss Chemical Industry Co. Ltd
  • Vizag Chemicals
  • Pon Pure Chemicals
  • Mehk Chemicals Private Limited
  • Hexion
  • Hubei Phoenix Chemical Company Ltd.
  • Exxon Mobil Corporation amongst

The taxonomy of the Neodecanoic Acid industry by its scope and segmentation is as follows:

logo By Type Segmentation Analysis

  • Neodecanoic acid (Versatics Acid C10)
  • Pivalic acid (Versatics acid C5)

logo By Application Segmentation Analysis

  • Adhesives
  • Chemical Intermediates
  • Others

logo Regional Segmentation Analysis

  • North America
    • The U.S.
    • Canada
  • Europe
    • Germany
    • The UK
    • France
    • Spain
    • Italy
    • Rest of Europe
  • Asia Pacific
    • China
    • Japan
    • India
    • South Korea
    • Southeast Asia
    • Rest of Asia Pacific
  • Latin America
    • Brazil
    • Mexico
    • Rest of Latin America
  • Middle East & Africa
    • GCC
    • South Africa
    • Rest of Middle East & Africa

Table of Content

  1. CHAPTER 1. Executive Summary
  2. CHAPTER 2. Neodecanoic Acid market – Types Analysis
    1. 2.1. Global Neodecanoic Acid Market – Types Overview
    2. 2.2. Global Neodecanoic Acid Market Share, by Types, 2018 & 2025 (USD Million)
    3. 2.3. Global Neodecanoic Acid Market share, by Types, 2018 & 2025 (Kilo Tons)
    4. 2.4. Neodecanoic acid (Versatics Acid C10)
      1. 2.4.1. Global Neodecanoic acid (Versatics Acid C10) Neodecanoic Acid Market, 2016-2026 (USD Million)
      2. 2.4.2. Global Neodecanoic acid (Versatics Acid C10) Neodecanoic Acid Market, 2016-2026 (Kilo Tons)
    5. 2.5. Pivalic acid (Versatics acid C5)
      1. 2.5.1. Global Pivalic acid (Versatics acid C5) Neodecanoic Acid Market, 2016-2026 (USD Million)
      2. 2.5.2. Global Pivalic acid (Versatics acid C5) Neodecanoic Acid Market, 2016-2026 (Kilo Tons)
  3. CHAPTER 3. Neodecanoic Acid market – Applications Analysis
    1. 3.1. Global Neodecanoic Acid Market – Applications Overview
    2. 3.2. Global Neodecanoic Acid Market Share, by Applications, 2018 & 2025 (USD Million)
    3. 3.3. Global Neodecanoic Acid Market share, by Applications, 2018 & 2025 (Kilo Tons)
    4. 3.4. Adhesives
      1. 3.4.1. Global Adhesives Neodecanoic Acid Market, 2016-2026 (USD Million)
      2. 3.4.2. Global Adhesives Neodecanoic Acid Market, 2016-2026 (Kilo Tons)
    5. 3.5. Chemical Intermediates
      1. 3.5.1. Global Chemical Intermediates Neodecanoic Acid Market, 2016-2026 (USD Million)
      2. 3.5.2. Global Chemical Intermediates Neodecanoic Acid Market, 2016-2026 (Kilo Tons)
    6. 3.6. Others
      1. 3.6.1. Global Others Neodecanoic Acid Market, 2016-2026 (USD Million)
      2. 3.6.2. Global Others Neodecanoic Acid Market, 2016-2026 (Kilo Tons)
  4. CHAPTER 4. Neodecanoic Acid market – Regional Analysis
    1. 4.1. Global Neodecanoic Acid Market Regional Overview
    2. 4.2. Global Neodecanoic Acid Market Share, by Region, 2018 & 2025 (Value)
    3. 4.3. Global Neodecanoic Acid Market Share, by Region, 2018 & 2025 (Volume)
    4. 4.4. North America
      1. 4.4.1. North America Neodecanoic Acid Market size and forecast, 2016-2026
      2. 4.4.2. North America Neodecanoic Acid Market, by Country, 2018 - 2025 (USD Million)
      3. 4.4.3. North America Market size and forecast, 2016-2026 (Kilo Tons)
      4. 4.4.4. North America Neodecanoic Acid Market, by Country, 2018 - 2025 (Kilo Tons)
      5. 4.4.5. North America Neodecanoic Acid Market, by Types, 2016-2026
        1. 4.4.5.1. North America Neodecanoic Acid Market, by Types, 2016-2026 (USD Million)
        2. 4.4.5.2. North America Neodecanoic Acid Market, by Types, 2016-2026 (Kilo Tons)
      6. 4.4.6. North America Neodecanoic Acid Market, by Applications, 2016-2026
        1. 4.4.6.1. North America Neodecanoic Acid Market, by Applications, 2016-2026 (USD Million)
        2. 4.4.6.2. North America Neodecanoic Acid Market, by Applications, 2016-2026 (Kilo Tons)
      7. 4.4.7. U.S.
        1. 4.4.7.1. U.S. Market size and forecast, 2016-2026 (USD Million)
        2. 4.4.7.2. U.S. Market size and forecast, 2016-2026 (Kilo Tons)
      8. 4.4.8. Canada
        1. 4.4.8.1. Canada Market size and forecast, 2016-2026 (USD Million)
        2. 4.4.8.2. Canada Market size and forecast, 2016-2026 (Kilo Tons)
    5. 4.5. Europe
      1. 4.5.1. Europe Neodecanoic Acid Market size and forecast, 2016-2026
      2. 4.5.2. Europe Neodecanoic Acid Market, by Country, 2018 - 2025 (USD Million)
      3. 4.5.3. Europe Market size and forecast, 2016-2026 (Kilo Tons)
      4. 4.5.4. Europe Neodecanoic Acid Market, by Country, 2018 - 2025 (Kilo Tons)
      5. 4.5.5. Europe Neodecanoic Acid Market, by Types, 2016-2026
        1. 4.5.5.1. Europe Neodecanoic Acid Market, by Types, 2016-2026 (USD Million)
        2. 4.5.5.2. Europe Neodecanoic Acid Market, by Types, 2016-2026 (Kilo Tons)
      6. 4.5.6. Europe Neodecanoic Acid Market, by Applications, 2016-2026
        1. 4.5.6.1. Europe Neodecanoic Acid Market, by Applications, 2016-2026 (USD Million)
        2. 4.5.6.2. Europe Neodecanoic Acid Market, by Applications, 2016-2026 (Kilo Tons)
      7. 4.5.7. Germany
        1. 4.5.7.1. Germany Market size and forecast, 2016-2026 (USD Million)
        2. 4.5.7.2. Germany Market size and forecast, 2016-2026 (Kilo Tons)
      8. 4.5.8. France
        1. 4.5.8.1. France Market size and forecast, 2016-2026 (USD Million)
        2. 4.5.8.2. France Market size and forecast, 2016-2026 (Kilo Tons)
      9. 4.5.9. U.K.
        1. 4.5.9.1. U.K. Market size and forecast, 2016-2026 (USD Million)
        2. 4.5.9.2. U.K. Market size and forecast, 2016-2026 (Kilo Tons)
      10. 4.5.10. Italy
        1. 4.5.10.1. Italy Market size and forecast, 2016-2026 (USD Million)
        2. 4.5.10.2. Italy Market size and forecast, 2016-2026 (Kilo Tons)
      11. 4.5.11. Spain
        1. 4.5.11.1. Spain Market size and forecast, 2016-2026 (USD Million)
        2. 4.5.11.2. Spain Market size and forecast, 2016-2026 (Kilo Tons)
      12. 4.5.12. Rest of Europe
        1. 4.5.12.1. Rest of Europe Market size and forecast, 2016-2026 (USD Million)
        2. 4.5.12.2. Rest of Europe Market size and forecast, 2016-2026 (Kilo Tons)
    6. 4.6. Asia Pacific
      1. 4.6.1. Asia Pacific Neodecanoic Acid Market size and forecast, 2016-2026
      2. 4.6.2. Asia Pacific Neodecanoic Acid Market, by Country, 2018 - 2025 (USD Million)
      3. 4.6.3. Asia Pacific Market size and forecast, 2016-2026 (Kilo Tons)
      4. 4.6.4. Asia Pacific Neodecanoic Acid Market, by Country, 2018 - 2025 (Kilo Tons)
      5. 4.6.5. Asia Pacific Neodecanoic Acid Market, by Types, 2016-2026
        1. 4.6.5.1. Asia Pacific Neodecanoic Acid Market, by Types, 2016-2026 (USD Million)
        2. 4.6.5.2. Asia Pacific Neodecanoic Acid Market, by Types, 2016-2026 (Kilo Tons)
      6. 4.6.6. Asia Pacific Neodecanoic Acid Market, by Applications, 2016-2026
        1. 4.6.6.1. Asia Pacific Neodecanoic Acid Market, by Applications, 2016-2026 (USD Million)
        2. 4.6.6.2. Asia Pacific Neodecanoic Acid Market, by Applications, 2016-2026 (Kilo Tons)
      7. 4.6.7. China
        1. 4.6.7.1. China Market size and forecast, 2016-2026 (USD Million)
        2. 4.6.7.2. China Market size and forecast, 2016-2026 (Kilo Tons)
      8. 4.6.8. Japan
        1. 4.6.8.1. Japan Market size and forecast, 2016-2026 (USD Million)
        2. 4.6.8.2. Japan Market size and forecast, 2016-2026 (Kilo Tons)
      9. 4.6.9. India
        1. 4.6.9.1. India Market size and forecast, 2016-2026 (USD Million)
        2. 4.6.9.2. India Market size and forecast, 2016-2026 (Kilo Tons)
      10. 4.6.10. South Korea
        1. 4.6.10.1. South Korea Market size and forecast, 2016-2026 (USD Million)
        2. 4.6.10.2. South Korea Market size and forecast, 2016-2026 (Kilo Tons)
      11. 4.6.11. South-East Asia
        1. 4.6.11.1. South-East Asia Market size and forecast, 2016-2026 (USD Million)
        2. 4.6.11.2. South-East Asia Market size and forecast, 2016-2026 (Kilo Tons)
      12. 4.6.12. Rest of Asia Pacific
        1. 4.6.12.1. Rest of Asia Pacific Market size and forecast, 2016-2026 (USD Million)
        2. 4.6.12.2. Rest of Asia Pacific Market size and forecast, 2016-2026 (Kilo Tons)
    7. 4.7. Latin America
      1. 4.7.1. Latin America Neodecanoic Acid Market size and forecast, 2016-2026
      2. 4.7.2. Latin America Neodecanoic Acid Market, by Country, 2018 - 2025 (USD Million)
      3. 4.7.3. Latin America Market size and forecast, 2016-2026 (Kilo Tons)
      4. 4.7.4. Latin America Neodecanoic Acid Market, by Country, 2018 - 2025 (Kilo Tons)
      5. 4.7.5. Latin America Neodecanoic Acid Market, by Types, 2016-2026
        1. 4.7.5.1. Latin America Neodecanoic Acid Market, by Types, 2016-2026 (USD Million)
        2. 4.7.5.2. Latin America Neodecanoic Acid Market, by Types, 2016-2026 (Kilo Tons)
      6. 4.7.6. Latin America Neodecanoic Acid Market, by Applications, 2016-2026
        1. 4.7.6.1. Latin America Neodecanoic Acid Market, by Applications, 2016-2026 (USD Million)
        2. 4.7.6.2. Latin America Neodecanoic Acid Market, by Applications, 2016-2026 (Kilo Tons)
      7. 4.7.7. Brazil
        1. 4.7.7.1. Brazil Market size and forecast, 2016-2026 (USD Million)
        2. 4.7.7.2. Brazil Market size and forecast, 2016-2026 (Kilo Tons)
      8. 4.7.8. Mexico
        1. 4.7.8.1. Mexico Market size and forecast, 2016-2026 (USD Million)
        2. 4.7.8.2. Mexico Market size and forecast, 2016-2026 (Kilo Tons)
      9. 4.7.9. Rest of Latin America
        1. 4.7.9.1. Rest of Latin America Market size and forecast, 2016-2026 (USD Million)
        2. 4.7.9.2. Rest of Latin America Market size and forecast, 2016-2026 (Kilo Tons)
    8. 4.8. The Middle-East and Africa
      1. 4.8.1. The Middle-East and Africa Neodecanoic Acid Market size and forecast, 2016-2026
      2. 4.8.2. The Middle-East and Africa Neodecanoic Acid Market, by Country, 2018 - 2025 (USD Million)
      3. 4.8.3. The Middle-East and Africa Market size and forecast, 2016-2026 (Kilo Tons)
      4. 4.8.4. The Middle-East and Africa Neodecanoic Acid Market, by Country, 2018 - 2025 (Kilo Tons)
      5. 4.8.5. The Middle-East and Africa Neodecanoic Acid Market, by Types, 2016-2026
        1. 4.8.5.1. The Middle-East and Africa Neodecanoic Acid Market, by Types, 2016-2026 (USD Million)
        2. 4.8.5.2. The Middle-East and Africa Neodecanoic Acid Market, by Types, 2016-2026 (Kilo Tons)
      6. 4.8.6. The Middle-East and Africa Neodecanoic Acid Market, by Applications, 2016-2026
        1. 4.8.6.1. The Middle-East and Africa Neodecanoic Acid Market, by Applications, 2016-2026 (USD Million)
        2. 4.8.6.2. The Middle-East and Africa Neodecanoic Acid Market, by Applications, 2016-2026 (Kilo Tons)
      7. 4.8.7. GCC Countries
        1. 4.8.7.1. GCC Countries Market size and forecast, 2016-2026 (USD Million)
        2. 4.8.7.2. GCC Countries Market size and forecast, 2016-2026 (Kilo Tons)
      8. 4.8.8. South Africa
        1. 4.8.8.1. South Africa Market size and forecast, 2016-2026 (USD Million)
        2. 4.8.8.2. South Africa Market size and forecast, 2016-2026 (Kilo Tons)
      9. 4.8.9. Rest of Middle-East Africa
        1. 4.8.9.1. Rest of Middle-East Africa Market size and forecast, 2016-2026 (USD Million)
        2. 4.8.9.2. Rest of Middle-East Africa Market size and forecast, 2016-2026 (Kilo Tons)
  5. CHAPTER 5. Neodecanoic Acid Production, Consumption, Export, Import by Regions
    1. 5.1. Global Neodecanoic Acid production and revenue, 2015-2025 (USD Million) (Kilo Tons)
    2. 5.2. Global Import and Export Analysis, by Region
  6. CHAPTER 6. Neodecanoic Acid market – Competitive Landscape
    1. 6.1. Competitor Market Share – Revenue
    2. 6.2. Market Concentration Rate Analysis, Top 3 and Top 5 Players
    3. 6.3. Competitor Market Share – Volume
    4. 6.4. Strategic Development
      1. 6.4.1. Acquisitions and Mergers
      2. 6.4.2. New Products
      3. 6.4.3. Research & Development Activities
  7. CHAPTER 7. Company Profiles
    1. 7.1. Strem Chemicals Inc.
      1. 7.1.1. Company Overview
      2. 7.1.2. Strem Chemicals Inc. Sales, Revenue, Price, and Gross Margin
      3. 7.1.3. Product portfolio
      4. 7.1.4. Recent initiatives
    2. 7.2. United States Biological Inc.
      1. 7.2.1. Company Overview
      2. 7.2.2. United States Biological Inc. Sales, Revenue, Price, and Gross Margin
      3. 7.2.3. Product portfolio
      4. 7.2.4. Recent initiatives
    3. 7.3. Hengshui Haoyang Medical Co., Ltd.
      1. 7.3.1. Company Overview
      2. 7.3.2. Hengshui Haoyang Medical Co., Ltd. Sales, Revenue, Price, and Gross Margin
      3. 7.3.3. Product portfolio
      4. 7.3.4. Recent initiatives
    4. 7.4. Shell Chemical LP
      1. 7.4.1. Company Overview
      2. 7.4.2. Shell Chemical LP Sales, Revenue, Price, and Gross Margin
      3. 7.4.3. Product portfolio
      4. 7.4.4. Recent initiatives
    5. 7.5. Haihang Industry Co., Ltd.
      1. 7.5.1. Company Overview
      2. 7.5.2. Haihang Industry Co., Ltd. Sales, Revenue, Price, and Gross Margin
      3. 7.5.3. Product portfolio
      4. 7.5.4. Recent initiatives
    6. 7.6. Hangzhou J & H Chemical Co., Ltd.
      1. 7.6.1. Company Overview
      2. 7.6.2. Hangzhou J & H Chemical Co., Ltd. Sales, Revenue, Price, and Gross Margin
      3. 7.6.3. Product portfolio
      4. 7.6.4. Recent initiatives
    7. 7.7. Xiamen Hisunny Chemical Co., LTD
      1. 7.7.1. Company Overview
      2. 7.7.2. Xiamen Hisunny Chemical Co., LTD Sales, Revenue, Price, and Gross Margin
      3. 7.7.3. Product portfolio
      4. 7.7.4. Recent initiatives
    8. 7.8. Hangzhou Dayangchem Co. Limited
      1. 7.8.1. Company Overview
      2. 7.8.2. Hangzhou Dayangchem Co. Limited Sales, Revenue, Price, and Gross Margin
      3. 7.8.3. Product portfolio
      4. 7.8.4. Recent initiatives
    9. 7.9. Jinan Boss Chemical Industry Co., Ltd
      1. 7.9.1. Company Overview
      2. 7.9.2. Jinan Boss Chemical Industry Co., Ltd Sales, Revenue, Price, and Gross Margin
      3. 7.9.3. Product portfolio
      4. 7.9.4. Recent initiatives
    10. 7.10. Vizag Chemicals
      1. 7.10.1. Company Overview
      2. 7.10.2. Vizag Chemicals Sales, Revenue, Price, and Gross Margin
      3. 7.10.3. Product portfolio
      4. 7.10.4. Recent initiatives
    11. 7.11. Pon Pure Chemicals
      1. 7.11.1. Company Overview
      2. 7.11.2. Pon Pure Chemicals Sales, Revenue, Price, and Gross Margin
      3. 7.11.3. Product portfolio
      4. 7.11.4. Recent initiatives
    12. 7.12. Mehk Chemicals Private Limited
      1. 7.12.1. Company Overview
      2. 7.12.2. Mehk Chemicals Private Limited Sales, Revenue, Price, and Gross Margin
      3. 7.12.3. Product portfolio
      4. 7.12.4. Recent initiatives
    13. 7.13. Hexion
      1. 7.13.1. Company Overview
      2. 7.13.2. Hexion Sales, Revenue, Price, and Gross Margin
      3. 7.13.3. Product portfolio
      4. 7.13.4. Recent initiatives
    14. 7.14. Hubei Phoenix Chemical Company Ltd.
      1. 7.14.1. Company Overview
      2. 7.14.2. Hubei Phoenix Chemical Company Ltd. Sales, Revenue, Price, and Gross Margin
      3. 7.14.3. Product portfolio
      4. 7.14.4. Recent initiatives
    15. 7.15. Exxon Mobil Corporation
      1. 7.15.1. Company Overview
      2. 7.15.2. Exxon Mobil Corporation Sales, Revenue, Price, and Gross Margin
      3. 7.15.3. Product portfolio
      4. 7.15.4. Recent initiatives
  8. CHAPTER 8. Neodecanoic Acid — Industry Analysis
    1. 8.1. Introduction and Taxonomy
    2. 8.2. Neodecanoic Acid Market – Key Trends
      1. 8.2.1. Market Drivers
      2. 8.2.2. Market Restraints
      3. 8.2.3. Market Opportunities
    3. 8.3. Value Chain Analysis
    4. 8.4. Key Mandates and Regulations
    5. 8.5. Technology Roadmap and Timeline
    6. 8.6. Neodecanoic Acid market – Attractiveness Analysis
      1. 8.6.1. By Types
      2. 8.6.2. By Applications
      3. 8.6.3. By Region
  9. CHAPTER 9. Raw Material analysis
    1. 9.1. Neodecanoic Acid Key Raw Material Analysis
      1. 9.1.1. Key Raw Materials
      2. 9.1.2. Price Trend of Key Raw Materials
    2. 9.2. Key Suppliers of Raw Materials
    3. 9.3. Proportion of Manufacturing Cost Structure
      1. 9.3.1. Raw Materials
      2. 9.3.2. Labor Cost
    4. 9.4. Manufacturing Expenses Analysis of Neodecanoic Acid
  10. CHAPTER 10. Industrial Chain, Sourcing Strategy and Downstream Buyers
    1. 10.1. Neodecanoic Acid Industrial Chain Analysis
    2. 10.2. Upstream Raw Materials Sourcing
      1. 10.2.1. Risk Mitigation:
      2. 10.2.2. Supplier Relationships:
      3. 10.2.3. Business Processes:
      4. 10.2.4. Securing the Product:
    3. 10.3. Raw Materials Sources of Neodecanoic Acid Major Manufacturers in 2016
    4. 10.4. Downstream Buyers
    5. 10.5. Distributors/Traders List
  11. CHAPTER 11. Marketing Strategy Analysis, Distributors
    1. 11.1. Marketing Channel
    2. 11.2. Direct Marketing
    3. 11.3. Indirect Marketing
    4. 11.4. Marketing Channel Development Trend
    5. 11.5. Economic/Political Environmental Change
  12. CHAPTER 12. Report Conclusion
  13. CHAPTER 13. Research Approach & Methodology
    1. 13.1. Report Description
    2. 13.2. Research Scope
    3. 13.3. Research Methodology
      1. 13.3.1. Secondary Research
      2. 13.3.2. Primary Research
      3. 13.3.3. Models
        1. 13.3.3.1. Company Share Analysis Model
        2. 13.3.3.2. Revenue Based Modeling
        3. 13.3.3.3. Research Limitations

  • List of Figures

    FIG. 1 Global Neodecanoic Acid Market, 2016-2026 (USD Million)
    FIG. 2 Global Neodecanoic Acid Market Share, by Types, 2018 & 2025 (USD Million)
    FIG. 3 Global Neodecanoic Acid Market share, by Types, 2018 & 2025 (Kilo Tons)
    FIG. 4 Global Neodecanoic acid (Versatics Acid C10) Neodecanoic Acid Market, 2016-2026 (USD Million)
    FIG. 5 Global Neodecanoic acid (Versatics Acid C10) Neodecanoic Acid  Market, 2016-2026 (Kilo Tons)
    FIG. 6 Global Pivalic acid (Versatics acid C5) Neodecanoic Acid Market, 2016-2026 (USD Million)
    FIG. 7 Global Pivalic acid (Versatics acid C5) Neodecanoic Acid  Market, 2016-2026 (Kilo Tons)
    FIG. 8 Global Neodecanoic Acid Market Share, by Applications, 2018 & 2025 (USD Million)
    FIG. 9 Global Neodecanoic Acid Market share, by Applications, 2018 & 2025 (Kilo Tons)
    FIG. 10 Global Adhesives Neodecanoic Acid Market, 2016-2026 (USD Million)
    FIG. 11 Global Adhesives Neodecanoic Acid  Market, 2016-2026 (Kilo Tons)
    FIG. 12 Global Chemical Intermediates Neodecanoic Acid Market, 2016-2026 (USD Million)
    FIG. 13 Global Chemical Intermediates Neodecanoic Acid  Market, 2016-2026 (Kilo Tons)
    FIG. 14 Global Others Neodecanoic Acid Market, 2016-2026 (USD Million)
    FIG. 15 Global Others Neodecanoic Acid  Market, 2016-2026 (Kilo Tons)
    FIG. 16 Global Neodecanoic Acid Market Share, by Region, 2018 & 2025
    FIG. 17 Global Neodecanoic Acid Market Share, by Region, 2018 & 2025
    FIG. 18 North America Neodecanoic Acid Market, 2016-2026
    FIG. 19 North America Neodecanoic Acid  Market, 2016-2026 (Kilo Tons)
    FIG. 20 U.S. Neodecanoic Acid Market, 2016-2026
    FIG. 21 U.S. Neodecanoic Acid  Market, 2016-2026 (Kilo Tons)
    FIG. 22 Canada Neodecanoic Acid Market, 2016-2026
    FIG. 23 Canada Neodecanoic Acid  Market, 2016-2026 (Kilo Tons)
    FIG. 24 Europe Neodecanoic Acid Market, 2016-2026
    FIG. 25 Europe Neodecanoic Acid  Market, 2016-2026 (Kilo Tons)
    FIG. 26 Germany Neodecanoic Acid Market, 2016-2026
    FIG. 27 Germany Neodecanoic Acid  Market, 2016-2026 (Kilo Tons)
    FIG. 28 France Neodecanoic Acid Market, 2016-2026
    FIG. 29 France Neodecanoic Acid  Market, 2016-2026 (Kilo Tons)
    FIG. 30 U.K. Neodecanoic Acid Market, 2016-2026
    FIG. 31 U.K. Neodecanoic Acid  Market, 2016-2026 (Kilo Tons)
    FIG. 32 Italy Neodecanoic Acid Market, 2016-2026
    FIG. 33 Italy Neodecanoic Acid  Market, 2016-2026 (Kilo Tons)
    FIG. 34 Spain Neodecanoic Acid Market, 2016-2026
    FIG. 35 Spain Neodecanoic Acid  Market, 2016-2026 (Kilo Tons)
    FIG. 36 Rest of Europe Neodecanoic Acid Market, 2016-2026
    FIG. 37 Rest of Europe Neodecanoic Acid  Market, 2016-2026 (Kilo Tons)
    FIG. 38 Asia Pacific Neodecanoic Acid Market, 2016-2026
    FIG. 39 Asia Pacific Neodecanoic Acid  Market, 2016-2026 (Kilo Tons)
    FIG. 40 China Neodecanoic Acid Market, 2016-2026
    FIG. 41 China Neodecanoic Acid  Market, 2016-2026 (Kilo Tons)
    FIG. 42 Japan Neodecanoic Acid Market, 2016-2026
    FIG. 43 Japan Neodecanoic Acid  Market, 2016-2026 (Kilo Tons)
    FIG. 44 India Neodecanoic Acid Market, 2016-2026
    FIG. 45 India Neodecanoic Acid  Market, 2016-2026 (Kilo Tons)
    FIG. 46 South  Korea Neodecanoic Acid Market, 2016-2026
    FIG. 47 South  Korea Neodecanoic Acid  Market, 2016-2026 (Kilo Tons)
    FIG. 48 South-East Asia Neodecanoic Acid Market, 2016-2026
    FIG. 49 South-East Asia Neodecanoic Acid  Market, 2016-2026 (Kilo Tons)
    FIG. 50 Rest of Asia Pacific Neodecanoic Acid Market, 2016-2026
    FIG. 51 Rest of Asia Pacific Neodecanoic Acid  Market, 2016-2026 (Kilo Tons)
    FIG. 52 Latin America Neodecanoic Acid Market, 2016-2026
    FIG. 53 Latin America Neodecanoic Acid  Market, 2016-2026 (Kilo Tons)
    FIG. 54 Brazil Neodecanoic Acid Market, 2016-2026
    FIG. 55 Brazil Neodecanoic Acid  Market, 2016-2026 (Kilo Tons)
    FIG. 56 Mexico Neodecanoic Acid Market, 2016-2026
    FIG. 57 Mexico Neodecanoic Acid  Market, 2016-2026 (Kilo Tons)
    FIG. 58 Rest of Latin America Neodecanoic Acid Market, 2016-2026
    FIG. 59 Rest of Latin America Neodecanoic Acid  Market, 2016-2026 (Kilo Tons)
    FIG. 60 The Middle-East and Africa Neodecanoic Acid Market, 2016-2026
    FIG. 61 The Middle-East and Africa Neodecanoic Acid  Market, 2016-2026 (Kilo Tons)
    FIG. 62 GCC Countries Neodecanoic Acid Market, 2016-2026
    FIG. 63 GCC Countries Neodecanoic Acid  Market, 2016-2026 (Kilo Tons)
    FIG. 64 South Africa Neodecanoic Acid Market, 2016-2026
    FIG. 65 South Africa Neodecanoic Acid  Market, 2016-2026 (Kilo Tons)
    FIG. 66 Rest of Middle-East Africa Neodecanoic Acid Market, 2016-2026
    FIG. 67 Rest of Middle-East Africa Neodecanoic Acid  Market, 2016-2026 (Kilo Tons)
    FIG. 68 Global Neodecanoic Acid production and revenue, 2015-2025 (USD Million) (Kilo Tons)
    FIG. 69 North America Neodecanoic Acid production and revenue, 2015-2025 (USD Million) (Kilo Tons)
    FIG. 70 Europe Neodecanoic Acid production and revenue, 2015-2025 (USD Million) (Kilo Tons)
    FIG. 71 Asia Pacific Neodecanoic Acid production and revenue, 2015-2025 (USD Million) (Kilo Tons)
    FIG. 72 Latin America Neodecanoic Acid production and revenue, 2015-2025 (USD Million) (Kilo Tons)
    FIG. 73 Middle East and Africa Neodecanoic Acid production and revenue, 2015-2025 (USD Million) (Kilo Tons)
    FIG. 74 Competitor Market Share – Revenue
    FIG. 75 Competitor Market Share – Volume
    FIG. 76 Strem Chemicals Inc. Revenue and Growth Rate
    FIG. 77 Strem Chemicals Inc. Market Share
    FIG. 78 United States Biological Inc. Revenue and Growth Rate
    FIG. 79 United States Biological Inc. Market Share
    FIG. 80 Hengshui Haoyang Medical Co., Ltd. Revenue and Growth Rate
    FIG. 81 Hengshui Haoyang Medical Co., Ltd. Market Share
    FIG. 82 Shell Chemical LP Revenue and Growth Rate
    FIG. 83 Shell Chemical LP Market Share
    FIG. 84 Haihang Industry Co., Ltd. Revenue and Growth Rate
    FIG. 85 Haihang Industry Co., Ltd. Market Share
    FIG. 86 Hangzhou J & H Chemical Co., Ltd. Revenue and Growth Rate
    FIG. 87 Hangzhou J & H Chemical Co., Ltd. Market Share
    FIG. 88 Xiamen Hisunny Chemical Co., LTD Revenue and Growth Rate
    FIG. 89 Xiamen Hisunny Chemical Co., LTD Market Share
    FIG. 90 Hangzhou Dayangchem Co. Limited Revenue and Growth Rate
    FIG. 91 Hangzhou Dayangchem Co. Limited Market Share
    FIG. 92 Jinan Boss Chemical Industry Co., Ltd Revenue and Growth Rate
    FIG. 93 Jinan Boss Chemical Industry Co., Ltd Market Share
    FIG. 94 Vizag Chemicals Revenue and Growth Rate
    FIG. 95 Vizag Chemicals Market Share
    FIG. 96 Pon Pure Chemicals Revenue and Growth Rate
    FIG. 97 Pon Pure Chemicals Market Share
    FIG. 98 Mehk Chemicals Private Limited Revenue and Growth Rate
    FIG. 99 Mehk Chemicals Private Limited Market Share
    FIG. 100 Hexion Revenue and Growth Rate
    FIG. 101 Hexion Market Share
    FIG. 102 Hubei Phoenix Chemical Company Ltd. Revenue and Growth Rate
    FIG. 103 Hubei Phoenix Chemical Company Ltd. Market Share
    FIG. 104 Exxon Mobil Corporation Revenue and Growth Rate
    FIG. 105 Exxon Mobil Corporation Market Share
    FIG. 106 Market Dynamics
    FIG. 107 Global Neodecanoic Acid – Value Chain Analysis
    FIG. 108 Key Mandates and Regulations
    FIG. 109 Technology Roadmap and Timeline
    FIG. 110 Market Attractiveness Analysis – By Types
    FIG. 111 Market Attractiveness Analysis – By Applications
    FIG. 112 Market Attractiveness Analysis – By Region
    FIG. 113 Manufacturing Cost Structure of Neodecanoic Acid
    FIG. 114 Neodecanoic Acid Industrial Chain Analysis
    FIG. 115 Market Channel
    FIG. 116 Marketing Channel Development Trend
    FIG. 117 Growth in World Gross Product, 2008-2018

    List of Tables

    TABLE 1 Global Neodecanoic Acid market, 2018 & 2025 (USD Million)
    TABLE 2 Global Neodecanoic Acid market, by Types, 2016-2026 (USD Million)
    TABLE 3 Global Neodecanoic Acid market, by Types, 2016-2026 (Kilo Tons)
    TABLE 4 Global Neodecanoic Acid market, by Applications, 2016-2026 (USD Million)
    TABLE 5 Global Neodecanoic Acid market, by Applications, 2016-2026 (Kilo Tons)
    TABLE 6 Global Neodecanoic Acid market, by region, 2016-2026 (USD Million)
    TABLE 7 Global Neodecanoic Acid market, by region, 2016-2026 (Kilo Tons)
    TABLE 8 North America Neodecanoic Acid Market, by Types, 2016-2026 (USD Million)
    TABLE 9 North America Neodecanoic Acid Market, by Types, 2016-2026 (Kilo Tons)
    TABLE 10 North America Neodecanoic Acid Market, by Applications, 2016-2026 (USD Million)
    TABLE 11 North America Neodecanoic Acid Market, by Applications, 2016-2026 (Kilo Tons)
    TABLE 12 Europe Neodecanoic Acid Market, by Types, 2016-2026 (USD Million)
    TABLE 13 Europe Neodecanoic Acid Market, by Types, 2016-2026 (Kilo Tons)
    TABLE 14 Europe Neodecanoic Acid Market, by Applications, 2016-2026 (USD Million)
    TABLE 15 Europe Neodecanoic Acid Market, by Applications, 2016-2026 (Kilo Tons)
    TABLE 16 Asia Pacific Neodecanoic Acid Market, by Types, 2016-2026 (USD Million)
    TABLE 17 Asia Pacific Neodecanoic Acid Market, by Types, 2016-2026 (Kilo Tons)
    TABLE 18 Asia Pacific Neodecanoic Acid Market, by Applications, 2016-2026 (USD Million)
    TABLE 19 Asia Pacific Neodecanoic Acid Market, by Applications, 2016-2026 (Kilo Tons)
    TABLE 20 Latin America Neodecanoic Acid Market, by Types, 2016-2026 (USD Million)
    TABLE 21 Latin America Neodecanoic Acid Market, by Types, 2016-2026 (Kilo Tons)
    TABLE 22 Latin America Neodecanoic Acid Market, by Applications, 2016-2026 (USD Million)
    TABLE 23 Latin America Neodecanoic Acid Market, by Applications, 2016-2026 (Kilo Tons)
    TABLE 24 The Middle-East and Africa Neodecanoic Acid Market, by Types, 2016-2026 (USD Million)
    TABLE 25 The Middle-East and Africa Neodecanoic Acid Market, by Types, 2016-2026 (Kilo Tons)
    TABLE 26 The Middle-East and Africa Neodecanoic Acid Market, by Applications, 2016-2026 (USD Million)
    TABLE 27 The Middle-East and Africa Neodecanoic Acid Market, by Applications, 2016-2026 (Kilo Tons)
    TABLE 28 North America Neodecanoic Acid Production, Consumption, Export, Import, 2016-2019
    TABLE 29 Europe Neodecanoic Acid Production, Consumption, Export, Import, 2016-2019
    TABLE 30 Asia Pacific Neodecanoic Acid Production, Consumption, Export, Import, 2016-2019
    TABLE 31 Latin America Neodecanoic Acid Production, Consumption, Export, Import, 2016-2019
    TABLE 32 Middle East & Africa Neodecanoic Acid Production, Consumption, Export, Import, 2016-2019
    TABLE 33 Global Neodecanoic Acid Market - Company Revenue Analysis 2016-2019 (USD Million)
    TABLE 34 Global Neodecanoic Acid Market - Company Revenue Share Analysis 2016-2019(%)
    TABLE 35 Global Neodecanoic Acid Market - Company Volume Analysis 2016-2019 (Kilo Tons)
    TABLE 36 Global Neodecanoic Acid Market - Company Volume Share Analysis 2016-2019(%)
    TABLE 37 Acquisitions and Mergers
    TABLE 38 New Product/Service Launch
    TABLE 39 Research & Development Activities
    TABLE 40 Market Drivers
    TABLE 41 Market Restraints
    TABLE 42 Market Opportunities
    TABLE 43 Production Base and Market Concentration Rate of Raw Material
    TABLE 44 Key Suppliers of Raw Materials
    TABLE 45 Raw Materials Sources of Neodecanoic Acid Major Manufacturers in 2016
    TABLE 46 Major Buyers of Neodecanoic Acid
    TABLE 47 Distributors/Traders of Neodecanoic Acid by Region
  •  

    Industry Major Market Players

    • Strem Chemicals Inc.
    • United States Biological Inc.
    • Hengshui Haoyang Medical Co. Ltd
    • Shell Chemical LP
    • Haihang Industry Co. Ltd.
    • Hangzhou J & H Chemical Co. Ltd.
    • Xiamen Hisunny Chemical Co. LTD
    • Hangzhou Dayangchem Co. Limited
    • Jinan Boss Chemical Industry Co. Ltd
    • Vizag Chemicals
    • Pon Pure Chemicals
    • Mehk Chemicals Private Limited
    • Hexion
    • Hubei Phoenix Chemical Company Ltd.
    • Exxon Mobil Corporation amongst