Search Market Research Report

Discover Our Latest Reports
Discover Our Featured Reports
Discover Top Selling Reports

Needle Coke Market Size, Share Global Analysis Report, s 2019–2026

report img

Needle Coke Market By Type (Petroleum Derived and Coal Tar Pitch Derived) and By Application (Graphite Electrode, Lithium Ion Batteries, Special Carbon Material and Others): Global Industry Perspective, Market Size, Statistical Research, Market Intelligence, Comprehensive Analysis, Historical Trends, and Forecasts 2019–2026

Industry Insights

This professional and specialized report study examines the technical and business perspective of the Needle Coke industry. The report provides a historical analysis of the industry as well as the projected trends expected to be witnessed in the Needle Coke market. The report study analyzes the market statistics at the global as well as the regional levels to gain an in-depth perspective of the overall Needle Coke market. The historical insights are provided from 2016 to 2019 and projected trends are provided from 2020 to 2026. The quantitative data is provided in terms of both volume (Kilo Tons) and value (USD Million) for 2016 – 2026. The qualitative data is reinforced by analyzing and providing numerous market dynamics (directly or indirectly affecting the industry) such as growth drivers, restraints, challenges, and opportunities.

We have included various industry analysis models in our report and extensively demonstrated the key business strategies and competitive landscape of the Needle Coke market in our study.

Needle Coke Market Size

To know more about this report | Request Free Sample Copy


logoKey Insights from Primary Research

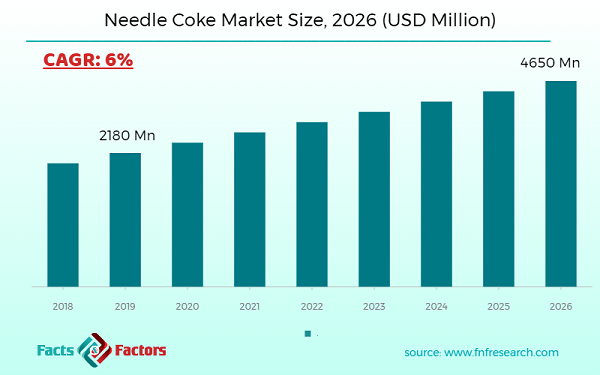
  • As per our primary respondents, the global needle coke is set to grow annually at a rate of around 6%.
  • It was established through primary research that the global needle coke was valued at around USD 2180 Million in 2019.
  • In terms of volume, the global needle coke stood at around 860Kilo Tons, in 2019
  • The “Petroleum Derived” category, was the prominent revenue-generating category accounting for around 65% share, in 2019.
  • According to anapplication segmentation, the “Graphite Electrode”category is contributing to a share of65%, in 2019

logoKey Recommendations from Analysts

  • As per our analysis, the needle coke industry across the world is projected market grow at a significant rate. As needle coke is used in lithium-ion batteries, shifting to the clean energy and electric vehicle is projected marketpropels theneedle coke market.
  • Growing at a CAGR around 6%, global needle coke provides numerous opportunities for all of the involved stakeholders across the entire value chain.
  • Our analysts have identified “graphite electrode” and “coal tar pitch derived” categories as the leading investment pockets for global needle coke with respect to type and application segmentation.
  • Needle coke market is projected market grow at a significant rate at the forecasted time, owing to the demand graphite electrode from aluminiumand steel industry.
  • The needle coke withlow sulfur contentmaterial is projected market have momentous demand in the forecasted period.


Our study also includes an analysis of Porter’s Five Forces framework for understanding the competitive strategies adopted by various stakeholders involved in the entire value chain of the Needle Coke market. It also encompasses PESTLE analysis and SWOT analysis.

The report also offers an in-depth analysis of the market shares of each industry player and gives an outline of the market position of key players in the Needle Coke market. Moreover, the study offers wide coverage of key strategic advances witnessed in the market such as new product launches, acquisitions & mergers, collaborations & joint ventures, funding & VC activities, agreements, partnerships, R&D activities, and regional expansion of key players of the Needle Coke market.

The research study provides a critical assessment of the Needle Coke industry by logically segmenting the market on the basis of Type, Application, and regions. Based on the past, present, and future trends, all the segments were analyzed from the bottom up, and the market sizes have been estimated from 2020 to 2026. The regional segmentation of the Needle Coke industry includes the holistic bifurcation of all the five major continents including North America, Europe, Asia Pacific, Latin America, and the Middle East & Africa.

The Needle Coke market is segmented based on Type and Application.  On the basis of type segmentation, the market is classified into CoveredPetroleum Derived and Coal Tar Pitch Derived. In terms of Application segmentation, the market is bifurcated into Graphite Electrode, Lithium-Ion Batteries, Special Carbon Material, and Others.

logoReport Scope

Report Attribute

Details

Market Size in 2019

USD 2180 Million

Projected Market Size in 2026

USD 4650 Million

CAGR Growth Rate

6% CAGR

Base Year

2019

Forecast Years

2020-2026

Key Market Players

Jinzhou Petrochemical Co., Ltd., Bao-steel Group, Petroleum Coke Industries co. (K.S.C), Fangda Carbon, Phillips 66, C-Chem Co., Ltd., Shijiazhuang Deli Chemical Co., Mitsubishi Chemical Corporation, Indian Oil Corporation Ltd., Petrocokes Japan Ltd., Sinopec Shanghai Petrochemical Company Limited, Sinosteel Anshan Research Institute of Thermo-Energy Co., Ltd., Seadrift Coke LP, JXTG Holdings, Inc., Petrochina International, Baotailong New Material Co., Shanxi Meijin Energy Co., Ltd., and Shanxi Hongte Coal Chemical Co., Ltd.

Key Segment

By Type, By Application, By Region

Major Regions Covered

North America, Europe, Asia Pacific, Latin America, and the Middle East & Africa

Purchase Options

Request customized purchase options to meet your research needs. Explore purchase options

logoSome of the essential players operating in the Needle Coke market, but not restricted to

  • Jinzhou Petrochemical Co.Ltd.
  • Bao-steel Group
  • Petroleum Coke Industries co. (K.S.C)
  • Fangda Carbon
  • Phillips 66
  • C-Chem Co.Ltd.
  • Shijiazhuang Deli Chemical Co.
  • Mitsubishi Chemical Corporation
  • Indian Oil Corporation Ltd.
  • Petrocokes Japan Ltd.
  • Sinopec Shanghai Petrochemical Company Limited
  • Shanxi Hongte Coal Chemical Co.Ltd.
  • Sinosteel Anshan Research Institute of Thermo-Energy Co.Ltd.
  • Seadrift Coke LP
  • JXTG Holdings Inc.
  • Petrochina International  
  • Baotailong New Material Co.
  • Shanxi Meijin Energy Co.Ltd.

The taxonomy of the Needle Coke Market by its scope and segmentation is as follows:

logo By Type Segmentation Analysis

  • Petroleum Derived
  • Coal Tar Pitch Derived

logo By Application Segmentation Analysis

  • Graphite Electrode
  • Lithium-Ion Batteries
  • Special Carbon Material
  • Others

logo Regional Segmentation Analysis

  • North America
    • The U.S.
    • Canada
  • Europe
    • France
    • The UK
    • Spain
    • Germany
    • Italy
    • Rest of Europe
  • Asia Pacific
    • China
    • Japan
    • India
    • South Korea
    • Southeast Asia
    • Rest of Asia Pacific
  • Latin America
    • Brazil
    • Mexico
    • Rest of Latin America
  • Middle East & Africa
    • GCC
    • South Africa
    • Rest of Middle East & Africa

logoKEY BUSINESS POINTERS ADDRESSED & FOREMOST REASONS TO PROCURE THE REPORT:

  • Statistical Analysis of the Past, Current, and Future Trends of the Industry with Validated Market Sizes Data
  • Direct and Indirect Rationales Impacting the Industry
  • In-depth and Micro Analysis of Viable Segments and Sub-segments
  • Companies and Vendors Market Share, Competitive Landscape, and Player Positioning Analysis
  • Demand Side (Consumption) and Supply Side (Production) Perspective and Analysis wherever applicable
  • Key Buyers and End-Users Analysis
  • Value Chain and Manufacturing Cost Structure Analysis wherever relevant
  • Key Marketing Strategies as well as Key Sales Channels adopted in the market
  • Investment Opportunity Analysis & Patents Analysis wherever feasible
  • Technological Road Map & Technical Analysis
  • Robust Research Methodology comprising dynamic mix (65%~35%) of Extensive Primary Research (primary interviews, ad-hoc surveys, questionnaires) and Protracted Secondary Research (proprietary in-house database, paid external databases, publically available validated sources)

Table of Content

  1. CHAPTER 1. Executive Summary
  2. CHAPTER 2. Needle Coke market – Type Analysis
    1. 2.1. Global Needle Coke Market – Type Overview
    2. 2.2. Global Needle Coke Market Share, by Type, 2019 & 2026 (USD Million)
    3. 2.3. Global Needle Coke Market share, by Type, 2019 & 2026 (Kilo Tons)
    4. 2.4. Petroleum Derived
      1. 2.4.1. Global Petroleum Derived Needle Coke Market, 2016-2026 (USD Million)
      2. 2.4.2. Global Petroleum Derived Needle Coke Market, 2016-2026 (Kilo Tons)
    5. 2.5. Coal Tar Pitch Derived
      1. 2.5.1. Global Coal Tar Pitch Derived Needle Coke Market, 2016-2026 (USD Million)
      2. 2.5.2. Global Coal Tar Pitch Derived Needle Coke Market, 2016-2026 (Kilo Tons)
  3. CHAPTER 3. Needle Coke market – End-User Analysis
    1. 3.1. Global Needle Coke Market – End-User Overview
    2. 3.2. Global Needle Coke Market Share, by End-User, 2019 & 2026 (USD Million)
    3. 3.3. Global Needle Coke Market share, by End-User, 2019 & 2026 (Kilo Tons)
    4. 3.4. Graphite Electrode
      1. 3.4.1. Global Graphite Electrode Needle Coke Market, 2016-2026 (USD Million)
      2. 3.4.2. Global Graphite Electrode Needle Coke Market, 2016-2026 (Kilo Tons)
    5. 3.5. Lithium Ion Batteries
      1. 3.5.1. Global Lithium Ion Batteries Needle Coke Market, 2016-2026 (USD Million)
      2. 3.5.2. Global Lithium Ion Batteries Needle Coke Market, 2016-2026 (Kilo Tons)
    6. 3.6. Others
      1. 3.6.1. Global Others Needle Coke Market, 2016-2026 (USD Million)
      2. 3.6.2. Global Others Needle Coke Market, 2016-2026 (Kilo Tons)
  4. CHAPTER 4. Needle Coke market – Regional Analysis
    1. 4.1. Global Needle Coke Market Regional Overview
    2. 4.2. Global Needle Coke Market Share, by Region, 2019 & 2026 (Value)
    3. 4.3. Global Needle Coke Market Share, by Region, 2019 & 2026 (Volume)
    4. 4.4. North America
      1. 4.4.1. North America Needle Coke Market size and forecast, 2016-2026
      2. 4.4.2. North America Needle Coke Market, by Country, 2019-2026 (USD Million)
      3. 4.4.3. North America Market size and forecast, 2016-2026 (Kilo Tons)
      4. 4.4.4. North America Needle Coke Market, by Country, 2016- 206 (Kilo Tons)
      5. 4.4.5. North America Needle Coke Market, by Type, 2016-2026
        1. 4.4.5.1. North America Needle Coke Market, by Type, 2016-2026 (USD Million)
        2. 4.4.5.2. North America Needle Coke Market, by Type, 2016-2026 (Kilo Tons)
      6. 4.4.6. North America Needle Coke Market, by End-User, 2016-2026
        1. 4.4.6.1. North America Needle Coke Market, by End-User, 2016-2026 (USD Million)
        2. 4.4.6.2. North America Needle Coke Market, by End-User, 2016-2026 (Kilo Tons)
      7. 4.4.7. U.S.
        1. 4.4.7.1. U.S. Market size and forecast, 2016-2026 (USD Million)
        2. 4.4.7.2. U.S. Market size and forecast, 2016-2026 (Kilo Tons)
      8. 4.4.8. Canada
        1. 4.4.8.1. Canada Market size and forecast, 2016-2026 (USD Million)
        2. 4.4.8.2. Canada Market size and forecast, 2016-2026 (Kilo Tons)
    5. 4.5. Europe
      1. 4.5.1. Europe Needle Coke Market size and forecast, 2016-2026
      2. 4.5.2. Europe Needle Coke Market, by Country, 2019-2026 (USD Million)
      3. 4.5.3. Europe Market size and forecast, 2016-2026 (Kilo Tons)
      4. 4.5.4. Europe Needle Coke Market, by Country, 2019-2026 (Kilo Tons)
      5. 4.5.5. Europe Needle Coke Market, by Type, 2016-2026
        1. 4.5.5.1. Europe Needle Coke Market, by Type, 2016-2026 (USD Million)
        2. 4.5.5.2. Europe Needle Coke Market, by Type, 2016-2026 (Kilo Tons)
      6. 4.5.6. Europe Needle Coke Market, by End-User, 2016-2026
        1. 4.5.6.1. Europe Needle Coke Market, by End-User, 2016-2026 (USD Million)
        2. 4.5.6.2. Europe Needle Coke Market, by End-User, 2016-2026 (Kilo Tons)
      7. 4.5.7. Germany
        1. 4.5.7.1. Germany Market size and forecast, 2016-2026 (USD Million)
        2. 4.5.7.2. Germany Market size and forecast, 2016-2026 (Kilo Tons)
      8. 4.5.8. France
        1. 4.5.8.1. France Market size and forecast, 2016-2026 (USD Million)
        2. 4.5.8.2. France Market size and forecast, 2016-2026 (Kilo Tons)
      9. 4.5.9. U.K.
        1. 4.5.9.1. U.K. Market size and forecast, 2016-2026 (USD Million)
        2. 4.5.9.2. U.K. Market size and forecast, 2016-2026 (Kilo Tons)
      10. 4.5.10. Italy
        1. 4.5.10.1. Italy Market size and forecast, 2016-2026 (USD Million)
        2. 4.5.10.2. Italy Market size and forecast, 2016-2026 (Kilo Tons)
      11. 4.5.11. Spain
        1. 4.5.11.1. Spain Market size and forecast, 2016-2026 (USD Million)
        2. 4.5.11.2. Spain Market size and forecast, 2016-2026 (Kilo Tons)
      12. 4.5.12. Rest of Europe
        1. 4.5.12.1. Rest of Europe Market size and forecast, 2016-2026 (USD Million)
        2. 4.5.12.2. Rest of Europe Market size and forecast, 2016-2026 (Kilo Tons)
    6. 4.6. Asia Pacific
      1. 4.6.1. Asia Pacific Needle Coke Market size and forecast, 2016-2026
      2. 4.6.2. Asia Pacific Needle Coke Market, by Country, 2019-2026 (USD Million)
      3. 4.6.3. Asia Pacific Market size and forecast, 2016-2026 (Kilo Tons)
      4. 4.6.4. Asia Pacific Needle Coke Market, by Country, 2019-2026 (Kilo Tons)
      5. 4.6.5. Asia Pacific Needle Coke Market, by Type, 2016-2026
        1. 4.6.5.1. Asia Pacific Needle Coke Market, by Type, 2016-2026 (USD Million)
        2. 4.6.5.2. Asia Pacific Needle Coke Market, by Type, 2016-2026 (Kilo Tons)
      6. 4.6.6. Asia Pacific Needle Coke Market, by End-User, 2016-2026
        1. 4.6.6.1. Asia Pacific Needle Coke Market, by End-User, 2016-2026 (USD Million)
        2. 4.6.6.2. Asia Pacific Needle Coke Market, by End-User, 2016-2026 (Kilo Tons)
      7. 4.6.7. China
        1. 4.6.7.1. China Market size and forecast, 2016-2026 (USD Million)
        2. 4.6.7.2. China Market size and forecast, 2016-2026 (Kilo Tons)
      8. 4.6.8. Japan
        1. 4.6.8.1. Japan Market size and forecast, 2016-2026 (USD Million)
        2. 4.6.8.2. Japan Market size and forecast, 2016-2026 (Kilo Tons)
      9. 4.6.9. India
        1. 4.6.9.1. India Market size and forecast, 2016-2026 (USD Million)
        2. 4.6.9.2. India Market size and forecast, 2016-2026 (Kilo Tons)
      10. 4.6.10. South Korea
        1. 4.6.10.1. South Korea Market size and forecast, 2016-2026 (USD Million)
        2. 4.6.10.2. South Korea Market size and forecast, 2016-2026 (Kilo Tons)
      11. 4.6.11. South-East Asia
        1. 4.6.11.1. South-East Asia Market size and forecast, 2016-2026 (USD Million)
        2. 4.6.11.2. South-East Asia Market size and forecast, 2016-2026 (Kilo Tons)
      12. 4.6.12. Rest of Asia Pacific
        1. 4.6.12.1. Rest of Asia Pacific Market size and forecast, 2016-2026 (USD Million)
        2. 4.6.12.2. Rest of Asia Pacific Market size and forecast, 2016-2026 (Kilo Tons)
    7. 4.7. Latin America
      1. 4.7.1. Latin America Needle Coke Market size and forecast, 2016-2026
      2. 4.7.2. Latin America Needle Coke Market, by Country, 2019-2026 (USD Million)
      3. 4.7.3. Latin America Market size and forecast, 2016-2026 (Kilo Tons)
      4. 4.7.4. Latin America Needle Coke Market, by Country, 2019-2026 (Kilo Tons)
      5. 4.7.5. Latin America Needle Coke Market, by Type, 2016-2026
        1. 4.7.5.1. Latin America Needle Coke Market, by Type, 2016-2026 (USD Million)
        2. 4.7.5.2. Latin America Needle Coke Market, by Type, 2016-2026 (Kilo Tons)
      6. 4.7.6. Latin America Needle Coke Market, by End-User, 2016-2026
        1. 4.7.6.1. Latin America Needle Coke Market, by End-User, 2016-2026 (USD Million)
        2. 4.7.6.2. Latin America Needle Coke Market, by End-User, 2016-2026 (Kilo Tons)
      7. 4.7.7. Brazil
        1. 4.7.7.1. Brazil Market size and forecast, 2016-2026 (USD Million)
        2. 4.7.7.2. Brazil Market size and forecast, 2016-2026 (Kilo Tons)
      8. 4.7.8. Mexico
        1. 4.7.8.1. Mexico Market size and forecast, 2016-2026 (USD Million)
        2. 4.7.8.2. Mexico Market size and forecast, 2016-2026 (Kilo Tons)
      9. 4.7.9. Rest of Latin America
        1. 4.7.9.1. Rest of Latin America Market size and forecast, 2016-2026 (USD Million)
        2. 4.7.9.2. Rest of Latin America Market size and forecast, 2016-2026 (Kilo Tons)
    8. 4.8. The Middle-East and Africa
      1. 4.8.1. The Middle-East and Africa Needle Coke Market size and forecast, 2016-2026
      2. 4.8.2. The Middle-East and Africa Needle Coke Market, by Country, 2019-2026 (USD Million)
      3. 4.8.3. The Middle-East and Africa Market size and forecast, 2016-2026 (Kilo Tons)
      4. 4.8.4. The Middle-East and Africa Needle Coke Market, by Country, 2019-2026 (Kilo Tons)
      5. 4.8.5. The Middle-East and Africa Needle Coke Market, by Type, 2016-2026
        1. 4.8.5.1. The Middle-East and Africa Needle Coke Market, by Type, 2016-2026 (USD Million)
        2. 4.8.5.2. The Middle-East and Africa Needle Coke Market, by Type, 2016-2026 (Kilo Tons)
      6. 4.8.6. The Middle-East and Africa Needle Coke Market, by End-User, 2016-2026
        1. 4.8.6.1. The Middle-East and Africa Needle Coke Market, by End-User, 2016-2026 (USD Million)
        2. 4.8.6.2. The Middle-East and Africa Needle Coke Market, by End-User, 2016-2026 (Kilo Tons)
      7. 4.8.7. GCC Countries
        1. 4.8.7.1. GCC Countries Market size and forecast, 2016-2026 (USD Million)
        2. 4.8.7.2. GCC Countries Market size and forecast, 2016-2026 (Kilo Tons)
      8. 4.8.8. South Africa
        1. 4.8.8.1. South Africa Market size and forecast, 2016-2026 (USD Million)
        2. 4.8.8.2. South Africa Market size and forecast, 2016-2026 (Kilo Tons)
      9. 4.8.9. Rest of Middle-East Africa
        1. 4.8.9.1. Rest of Middle-East Africa Market size and forecast, 2016-2026 (USD Million)
        2. 4.8.9.2. Rest of Middle-East Africa Market size and forecast, 2016-2026 (Kilo Tons)
  5. CHAPTER 5. Needle CokeProduction, Consumption, Export, Import by Regions
    1. 5.1. Global Needle Coke production and revenue, 2015-2025 (USD Million) (Kilo Tons)
    2. 5.2. Global Import and Export Analysis, by Region
  6. CHAPTER 6. Needle Coke market – Competitive Landscape
    1. 6.1. Competitor Market Share – Revenue
    2. 6.2. Market Concentration Rate Analysis, Top 3 and Top 5 Players
    3. 6.3. Competitor Market Share – Volume
    4. 6.4. Strategic Development
      1. 6.4.1. Acquisitions and Mergers
      2. 6.4.2. New Products
      3. 6.4.3. Research & Development Activities
  7. CHAPTER 7. Company Profiles
    1. 7.1. Mitsubishi Chemical Corporation
      1. 7.1.1. Company Overview
      2. 7.1.2. Mitsubishi Chemical Corporation Sales, Revenue, Price, and Gross Margin
      3. 7.1.3. Product portfolio
      4. 7.1.4. Recent initiatives
    2. 7.2. Baotailong New Material Co., Ltd.
      1. 7.2.1. Company Overview
      2. 7.2.2. Baotailong New Material Co., Ltd. Sales, Revenue, Price, and Gross Margin
      3. 7.2.3. Product portfolio
      4. 7.2.4. Recent initiatives
    3. 7.3. Bao-steel Group, Seadrift Coke LP
      1. 7.3.1. Company Overview
      2. 7.3.2. Bao-steel Group, Seadrift Coke LP Sales, Revenue, Price, and Gross Margin
      3. 7.3.3. Product portfolio
      4. 7.3.4. Recent initiatives
    4. 7.4. Shanxi Hongte Coal Chemical Co., Ltd.
      1. 7.4.1. Company Overview
      2. 7.4.2. Shanxi Hongte Coal Chemical Co., Ltd. Sales, Revenue, Price, and Gross Margin
      3. 7.4.3. Product portfolio
      4. 7.4.4. Recent initiatives
    5. 7.5. Petrochina International Jinzhou Petrochemical Co., Ltd.
      1. 7.5.1. Company Overview
      2. 7.5.2. Petrochina International Jinzhou Petrochemical Co., Ltd. Sales, Revenue, Price, and Gross Margin
      3. 7.5.3. Product portfolio
      4. 7.5.4. Recent initiatives
    6. 7.6. Petroleum Coke Industries co. (K.S.C)
      1. 7.6.1. Company Overview
      2. 7.6.2. Petroleum Coke Industries co. (K.S.C) Sales, Revenue, Price, and Gross Margin
      3. 7.6.3. Product portfolio
      4. 7.6.4. Recent initiatives
    7. 7.7. Fangda Carbon, Phillips 66, JXTG Holdings, Inc.
      1. 7.7.1. Company Overview
      2. 7.7.2. Fangda Carbon, Phillips 66, JXTG Holdings, Inc. Sales, Revenue, Price, and Gross Margin
      3. 7.7.3. Product portfolio
      4. 7.7.4. Recent initiatives
    8. 7.8. Indian Oil Corporation Ltd., C-Chem Co., Ltd.
      1. 7.8.1. Company Overview
      2. 7.8.2. Indian Oil Corporation Ltd., C-Chem Co., Ltd. Sales, Revenue, Price, and Gross Margin
      3. 7.8.3. Product portfolio
      4. 7.8.4. Recent initiatives
    9. 7.9. Sinopec Shanghai Petrochemical Company Limited
      1. 7.9.1. Company Overview
      2. 7.9.2. Sinopec Shanghai Petrochemical Company Limited Sales, Revenue, Price, and Gross Margin
      3. 7.9.3. Product portfolio
      4. 7.9.4. Recent initiatives
    10. 7.10. Sinosteel Anshan Research Institute of Thermo-Energy Co., Ltd.
      1. 7.10.1. Company Overview
      2. 7.10.2. Sinosteel Anshan Research Institute of Thermo-Energy Co., Ltd. Sales, Revenue, Price, and Gross Margin
      3. 7.10.3. Product portfolio
      4. 7.10.4. Recent initiatives
    11. 7.11. Shijiazhuang Deli Chemical Co., and Petrocokes Japan Ltd.
      1. 7.11.1. Company Overview
      2. 7.11.2. Shijiazhuang Deli Chemical Co., and Petrocokes Japan Ltd. Sales, Revenue, Price, and Gross Margin
      3. 7.11.3. Product portfolio
      4. 7.11.4. Recent initiatives
  8. CHAPTER 8. Needle Coke — Industry Analysis
    1. 8.1. Introduction and Taxonomy
    2. 8.2. Needle Coke Market – Key Trends
      1. 8.2.1. Market Drivers
      2. 8.2.2. Market Restraints
      3. 8.2.3. Market Opportunities
    3. 8.3. Value Chain Analysis
    4. 8.4. Key Mandates and Regulations
    5. 8.5. Technology Roadmap and Timeline
    6. 8.6. Needle Coke market – Attractiveness Analysis
      1. 8.6.1. By Type
      2. 8.6.2. By End-User
      3. 8.6.3. By Region
  9. CHAPTER 9. Raw Material analysis
    1. 9.1. Needle Coke Key Raw Material Analysis
      1. 9.1.1. Key Raw Materials
      2. 9.1.2. Price Trend of Key Raw Materials
    2. 9.2. Key Suppliers of Raw Materials
    3. 9.3. Proportion of Manufacturing Cost Structure
      1. 9.3.1. Raw Materials
      2. 9.3.2. Labor Cost
    4. 9.4. Manufacturing Expenses Analysis of Needle Coke
  10. CHAPTER 10. Industrial Chain, Sourcing Strategy and Downstream Buyers
    1. 10.1. Needle Coke Industrial Chain Analysis
    2. 10.2. Upstream Raw Materials Sourcing
      1. 10.2.1. Risk Mitigation:
      2. 10.2.2. Supplier Relationships:
      3. 10.2.3. Business Processes:
      4. 10.2.4. Securing the Product:
    3. 10.3. Raw Materials Sources of Needle Coke Major Manufacturers in 2016
    4. 10.4. Downstream Buyers
    5. 10.5. Distributors/Traders List
  11. CHAPTER 11. Marketing Strategy Analysis, Distributors
    1. 11.1. Marketing Channel
    2. 11.2. Direct Marketing
    3. 11.3. Indirect Marketing
    4. 11.4. Marketing Channel Development Trend
    5. 11.5. Economic/Political Environmental Change
  12. CHAPTER 12. Report Conclusion
  13. CHAPTER 13. Research Approach & Methodology
    1. 13.1. Report Description
    2. 13.2. Research Scope
    3. 13.3. Research Methodology
      1. 13.3.1. Secondary Research
      2. 13.3.2. Primary Research
      3. 13.3.3. Models
        1. 13.3.3.1. Company Share Analysis Model
        2. 13.3.3.2. Revenue Based Modeling
        3. 13.3.3.3. Research Limitations

        List of Figures

        FIG. 1 Global Needle Coke Market, 2016-2026 (USD Million)
        FIG. 2 Global Needle Coke Market Share, by  Type, 2018 & 2025 (USD Million)
        FIG. 3 Global Needle Coke Market share, by  Type, 2018 & 2025 (Kilo Tons)
        FIG. 4 Global Petroleum Derived Needle Coke Market, 2016-2026 (USD Million)
        FIG. 5 Global Petroleum Derived Needle Coke  Market, 2016-2026 (Kilo Tons)
        FIG. 6 Global Coal Tar Pitch Derived Needle Coke Market, 2016-2026 (USD Million)
        FIG. 7 Global Coal Tar Pitch Derived Needle Coke  Market, 2016-2026 (Kilo Tons)
        FIG. 8 Global Needle Coke Market Share, by End-User, 2018 & 2025 (USD Million)
        FIG. 9 Global Needle Coke Market share, by End-User, 2018 & 2025 (Kilo Tons)
        FIG. 10 Global Graphite Electrode Needle Coke Market, 2016-2026 (USD Million)
        FIG. 11 Global Graphite Electrode Needle Coke  Market, 2016-2026 (Kilo Tons)
        FIG. 12 Global  Lithium Ion Batteries Needle Coke Market, 2016-2026 (USD Million)
        FIG. 13 Global  Lithium Ion Batteries Needle Coke  Market, 2016-2026 (Kilo Tons)
        FIG. 14 Global Others Needle Coke Market, 2016-2026 (USD Million)
        FIG. 15 Global Others Needle Coke  Market, 2016-2026 (Kilo Tons)
        FIG. 16 Global Needle Coke Market Share, by Region, 2018 & 2025
        FIG. 17 Global Needle Coke Market Share, by Region, 2018 & 2025
        FIG. 18 North America Needle Coke Market, 2016-2026
        FIG. 19 North America Needle Coke  Market, 2016-2026 (Kilo Tons)
        FIG. 20 U.S. Needle Coke Market, 2016-2026
        FIG. 21 U.S. Needle Coke  Market, 2016-2026 (Kilo Tons)
        FIG. 22 Canada Needle Coke Market, 2016-2026
        FIG. 23 Canada Needle Coke  Market, 2016-2026 (Kilo Tons)
        FIG. 24 Europe Needle Coke Market, 2016-2026
        FIG. 25 Europe Needle Coke  Market, 2016-2026 (Kilo Tons)
        FIG. 26 Germany Needle Coke Market, 2016-2026
        FIG. 27 Germany Needle Coke  Market, 2016-2026 (Kilo Tons)
        FIG. 28 France Needle Coke Market, 2016-2026
        FIG. 29 France Needle Coke  Market, 2016-2026 (Kilo Tons)
        FIG. 30 U.K. Needle Coke Market, 2016-2026
        FIG. 31 U.K. Needle Coke  Market, 2016-2026 (Kilo Tons)
        FIG. 32 Italy Needle Coke Market, 2016-2026
        FIG. 33 Italy Needle Coke  Market, 2016-2026 (Kilo Tons)
        FIG. 34 Spain Needle Coke Market, 2016-2026
        FIG. 35 Spain Needle Coke  Market, 2016-2026 (Kilo Tons)
        FIG. 36 Rest of Europe Needle Coke Market, 2016-2026
        FIG. 37 Rest of Europe Needle Coke  Market, 2016-2026 (Kilo Tons)
        FIG. 38 Asia Pacific Needle Coke Market, 2016-2026
        FIG. 39 Asia Pacific Needle Coke  Market, 2016-2026 (Kilo Tons)
        FIG. 40 China Needle Coke Market, 2016-2026
        FIG. 41 China Needle Coke  Market, 2016-2026 (Kilo Tons)
        FIG. 42 Japan Needle Coke Market, 2016-2026
        FIG. 43 Japan Needle Coke  Market, 2016-2026 (Kilo Tons)
        FIG. 44 India Needle Coke Market, 2016-2026
        FIG. 45 India Needle Coke  Market, 2016-2026 (Kilo Tons)
        FIG. 46 South  Korea Needle Coke Market, 2016-2026
        FIG. 47 South  Korea Needle Coke  Market, 2016-2026 (Kilo Tons)
        FIG. 48 South-East Asia Needle Coke Market, 2016-2026
        FIG. 49 South-East Asia Needle Coke  Market, 2016-2026 (Kilo Tons)
        FIG. 50 Rest of Asia Pacific Needle Coke Market, 2016-2026
        FIG. 51 Rest of Asia Pacific Needle Coke  Market, 2016-2026 (Kilo Tons)
        FIG. 52 Latin America Needle Coke Market, 2016-2026
        FIG. 53 Latin America Needle Coke  Market, 2016-2026 (Kilo Tons)
        FIG. 54 Brazil Needle Coke Market, 2016-2026
        FIG. 55 Brazil Needle Coke  Market, 2016-2026 (Kilo Tons)
        FIG. 56 Mexico Needle Coke Market, 2016-2026
        FIG. 57 Mexico Needle Coke  Market, 2016-2026 (Kilo Tons)
        FIG. 58 Rest of Latin America Needle Coke Market, 2016-2026
        FIG. 59 Rest of Latin America Needle Coke  Market, 2016-2026 (Kilo Tons)
        FIG. 60 The Middle-East and Africa Needle Coke Market, 2016-2026
        FIG. 61 The Middle-East and Africa Needle Coke  Market, 2016-2026 (Kilo Tons)
        FIG. 62 GCC Countries Needle Coke Market, 2016-2026
        FIG. 63 GCC Countries Needle Coke  Market, 2016-2026 (Kilo Tons)
        FIG. 64 South Africa Needle Coke Market, 2016-2026
        FIG. 65 South Africa Needle Coke  Market, 2016-2026 (Kilo Tons)
        FIG. 66 Rest of Middle-East Africa Needle Coke Market, 2016-2026
        FIG. 67 Rest of Middle-East Africa Needle Coke  Market, 2016-2026 (Kilo Tons)
        FIG. 68 Global Needle Coke production and revenue, 2015-2025 (USD Million) (Kilo Tons)
        FIG. 69 North America Needle Coke production and revenue, 2015-2025 (USD Million) (Kilo Tons)
        FIG. 70 Europe Needle Coke production and revenue, 2015-2025 (USD Million) (Kilo Tons)
        FIG. 71 Asia Pacific Needle Coke production and revenue, 2015-2025 (USD Million) (Kilo Tons)
        FIG. 72 Latin America Needle Coke production and revenue, 2015-2025 (USD Million) (Kilo Tons)
        FIG. 73 Middle East and Africa Needle Coke production and revenue, 2015-2025 (USD Million) (Kilo Tons)
        FIG. 74 Competitor Market Share – Revenue
        FIG. 75 Competitor Market Share – Volume
        FIG. 76 Mitsubishi Chemical Corporation Revenue and Growth Rate
        FIG. 77 Mitsubishi Chemical Corporation Market Share
        FIG. 78 Baotailong New Material Co., Ltd. Revenue and Growth Rate
        FIG. 79 Baotailong New Material Co., Ltd. Market Share
        FIG. 80 Bao-steel Group, Seadrift Coke LP Revenue and Growth Rate
        FIG. 81 Bao-steel Group, Seadrift Coke LP Market Share
        FIG. 82 Shanxi Hongte Coal Chemical Co., Ltd. Revenue and Growth Rate
        FIG. 83 Shanxi Hongte Coal Chemical Co., Ltd. Market Share
        FIG. 84 Petrochina International Jinzhou Petrochemical Co., Ltd. Revenue and Growth Rate
        FIG. 85 Petrochina International Jinzhou Petrochemical Co., Ltd. Market Share
        FIG. 86 Petroleum Coke Industries co. (K.S.C) Revenue and Growth Rate
        FIG. 87 Petroleum Coke Industries co. (K.S.C) Market Share
        FIG. 88 Fangda Carbon, Phillips 66, JXTG Holdings, Inc. Revenue and Growth Rate
        FIG. 89 Fangda Carbon, Phillips 66, JXTG Holdings, Inc. Market Share
        FIG. 90 Indian Oil Corporation Ltd., C-Chem Co., Ltd. Revenue and Growth Rate
        FIG. 91 Indian Oil Corporation Ltd., C-Chem Co., Ltd. Market Share
        FIG. 92 Sinopec Shanghai Petrochemical Company Limited Revenue and Growth Rate
        FIG. 93 Sinopec Shanghai Petrochemical Company Limited Market Share
        FIG. 94 Sinosteel Anshan Research Institute of Thermo-Energy Co., Ltd. Revenue and Growth Rate
        FIG. 95 Sinosteel Anshan Research Institute of Thermo-Energy Co., Ltd. Market Share
        FIG. 96 Shijiazhuang Deli Chemical Co., and Petrocokes Japan Ltd. Revenue and Growth Rate
        FIG. 97 Shijiazhuang Deli Chemical Co., and Petrocokes Japan Ltd. Market Share
        FIG. 98 Market Dynamics
        FIG. 99 Global Needle Coke – Value Chain Analysis
        FIG. 100 Key Mandates and Regulations
        FIG. 101 Technology Roadmap and Timeline
        FIG. 102 Market Attractiveness Analysis – By  Type
        FIG. 103 Market Attractiveness Analysis – By End-User
        FIG. 104 Market Attractiveness Analysis – By Region
        FIG. 105 Manufacturing Cost Structure of Needle Coke
        FIG. 106 Needle Coke Industrial Chain Analysis
        FIG. 107 Market Channel
        FIG. 108 Marketing Channel Development Trend
        FIG. 109 Growth in World Gross Product, 2008-2019


        List of Tables

        ABLE 1 Global Needle Coke market, 2018 & 2025 (USD Million)
        TABLE 2 Global Needle Coke market, by  Type, 2016-2026 (USD Million)
        TABLE 3 Global Needle Coke market, by  Type, 2016-2026 (Kilo Tons)
        TABLE 4 Global Needle Coke market, by End-User, 2016-2026 (USD Million)
        TABLE 5 Global Needle Coke market, by End-User, 2016-2026 (Kilo Tons)
        TABLE 6 Global Needle Coke market, by region, 2016-2026 (USD Million)
        TABLE 7 Global Needle Coke market, by region, 2016-2026 (Kilo Tons)
        TABLE 8 North America Needle Coke Market, by  Type, 2016-2026 (USD Million)
        TABLE 9 North America Needle Coke Market, by  Type, 2016-2026 (Kilo Tons)
        TABLE 10North America Needle Coke Market, by End-User, 2016-2026 (USD Million)
        TABLE 11 North America Needle Coke Market, by End-User, 2016-2026 (Kilo Tons)
        TABLE 12 Europe Needle Coke Market, by  Type, 2016-2026 (USD Million)
        TABLE 13 Europe Needle Coke Market, by  Type, 2016-2026 (Kilo Tons)
        TABLE 14 Europe Needle Coke Market, by End-User, 2016-2026 (USD Million)
        TABLE 15 Europe Needle Coke Market, by End-User, 2016-2026 (Kilo Tons)
        TABLE 16 Asia Pacific Needle Coke Market, by  Type, 2016-2026 (USD Million)
        TABLE 17 Asia Pacific Needle Coke Market, by  Type, 2016-2026 (Kilo Tons)
        TABLE 18 Asia Pacific Needle Coke Market, by End-User, 2016-2026 (USD Million)
        TABLE 19 Asia Pacific Needle Coke Market, by End-User, 2016-2026 (Kilo Tons)
        TABLE 20 Latin America Needle Coke Market, by  Type, 2016-2026 (USD Million)
        TABLE 21 Latin America Needle Coke Market, by  Type, 2016-2026 (Kilo Tons)
        TABLE 22 Latin America Needle Coke Market, by End-User, 2016-2026 (USD Million)
        TABLE 23 Latin America Needle Coke Market, by End-User, 2016-2026 (Kilo Tons)
        TABLE 24 The Middle-East and Africa Needle Coke Market, by  Type, 2016-2026 (USD Million)
        TABLE 25 The Middle-East and Africa Needle Coke Market, by  Type, 2016-2026 (Kilo Tons)
        TABLE 26 The Middle-East and Africa Needle Coke Market, by End-User, 2016-2026 (USD Million)
        TABLE 27 The Middle-East and Africa Needle Coke Market, by End-User, 2016-2026 (Kilo Tons)
        TABLE 28 North America Needle Coke Production, Consumption, Export, Import, 2016-2019
        TABLE 29 Europe Needle Coke Production, Consumption, Export, Import, 2016-2019
        TABLE 30 Asia Pacific Needle Coke Production, Consumption, Export, Import, 2016-2019
        TABLE 31 Latin America Needle Coke Production, Consumption, Export, Import, 2016-2019
        TABLE 32 Middle East & Africa Needle Coke Production, Consumption, Export, Import, 2016-2019
        TABLE 33 Global Needle Coke Market - Company Revenue Analysis 2016-2019 (USD Million)
        TABLE 34 Global Needle Coke Market - Company Revenue Share Analysis 2016-2019(%)
        TABLE 35 Global Needle Coke Market - Company Volume Analysis 2016-2019 (Kilo Tons)
        TABLE 36 Global Needle Coke Market - Company Volume Share Analysis 2016-2019(%)
        TABLE 37 Acquisitions and Mergers
        TABLE 38 New Product/Service Launch
        TABLE 39 Research & Development Activities
        TABLE 40 Market Drivers
        TABLE 41 Market Restraints
        TABLE 42 Market Opportunities
        TABLE 43 Production Base and Market Concentration Rate of Raw Material
        TABLE 44 Key Suppliers of Raw Materials
        TABLE 45 Raw Materials Sources of Needle Coke Major Manufacturers in 2016
        TABLE 46 Major Buyers of Needle Coke
        TABLE 47 Distributors/Traders of Needle Coke by Region
         

Industry Major Market Players

  • Jinzhou Petrochemical Co.Ltd.
  • Bao-steel Group
  • Petroleum Coke Industries co. (K.S.C)
  • Fangda Carbon
  • Phillips 66
  • C-Chem Co.Ltd.
  • Shijiazhuang Deli Chemical Co.
  • Mitsubishi Chemical Corporation
  • Indian Oil Corporation Ltd.
  • Petrocokes Japan Ltd.
  • Sinopec Shanghai Petrochemical Company Limited
  • Shanxi Hongte Coal Chemical Co.Ltd.
  • Sinosteel Anshan Research Institute of Thermo-Energy Co.Ltd.
  • Seadrift Coke LP
  • JXTG Holdings Inc.
  • Petrochina International  
  • Baotailong New Material Co.
  • Shanxi Meijin Energy Co.Ltd.