Search Market Research Report

Discover Our Latest Reports
Discover Our Featured Reports
Discover Top Selling Reports

Natural Food Colors Market Size, Share Global Analysis Report, 2023 – 2030

report img

Natural Food Colors Market Size, Share, Growth Analysis Report By Pigment (Carotenoid, Curcumin, Paprika Extract, Spirulina Extract, Chlorophyll, Carmine, and Others) and By Application (Dairy, Beverages, Packaged Food, Frozen Food, Bakery & Confectionary, and Others), and By Region - Global and Regional Industry Insights, Overview, Comprehensive Analysis, Trends, Statistical Research, Market Intelligence, Historical Data and Forecast 2023 – 2030

Industry Insights

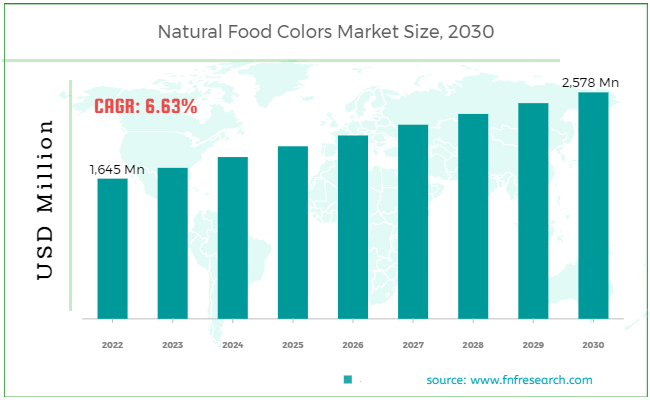
[220+ Pages Report] According to the report published by Facts Factors, the global natural food colors market size was valued at around USD 1,645 million in 2022 and is expected to grow around USD 2,578 million by 2030 with a compound annual growth rate (CAGR) of approximately 6.63% between 2023 and 2030. The report analyzes the global natural food colors market drivers, restraints/challenges, and the impact they have on the demands during the forecast period. In addition, the report explores emerging opportunities in the natural food colors market.

Natural Food Colors Market

To know more about this report | Request Free Sample Copy

This specialized and expertise-oriented industry research report scrutinizes the technical and commercial business outlook of the natural food colors industry. The report analyzes and declares the historical and current trends analysis of the natural food colors industry and subsequently recommends the projected trends anticipated to be observed in the Natural Food Colors market during the upcoming years.

The natural food colors market report analyzes and notifies the industry statistics at the global as well as regional and country levels in order to acquire a thorough perspective of the entire natural food colors market. The historical and past insights are provided for FY 2020 to FY 2022 whereas projected trends are delivered for FY 2023 to FY 2030. The quantitative and numerical data is represented in terms of value (USD Million) from FY 2020 – 2030.


logoKey Insights from Primary Research

  • As per our analysis, the natural food colors market is set to grow annually at a rate of around 6.63%
  • It was valued through primary research that the natural food colors market was valued at around USD 1,645 Million in 2022
  • China is expected to be the most lucrative market during the estimated period.
  • Owing to rising disposable income and economic development, carbonated soft drinks and non-alcoholic drinks are expected to witness substantial growth rates over the forecast period

logoKey Recommendations from Analysts

  • Increased demand for ready-to-drink products will lead to increased demand during the projected period
  • The market value for the year 2030 is estimated at USD 2,578 Million
  • The Brazil food color industry is estimated to be the largest in Latin America and will continue to attract investors and producers in the near future
  • As per our analysts, the global natural food colors market may boom in the coming years due to the rising awareness of the health benefits of natural food colors

The quantitative data is further underlined and reinforced by comprehensive qualitative data which comprises various across-the-board market dynamics. The rationales which directly or indirectly impact the natural food colors industry are exemplified through parameters such as growth drivers, restraints, challenges, and opportunities among other impacting factors.

Throughout our research report, we have encompassed all the proven models and tools of industry analysis and extensively illustrated all the key business strategies and business models adopted in the natural food colors industry. The report provides an all-inclusive and detailed competitive landscape prevalent in the natural food colors market.

The report utilizes established industry analysis tools and models such as Porter’s Five Forces framework to analyze and recognize critical business strategies adopted by various stakeholders involved in the entire value chain of the natural food colors industry. The natural food colors market report additionally employs SWOT analysis and PESTLE analysis models for further in-depth analysis.

The report study further includes an in-depth analysis of industry players' market shares and provides an overview of leading players' market position in the natural food color sector. Key strategic developments in the Natural Food Colors market competitive landscape such as acquisitions & mergers, inaugurations of different products and services, partnerships & joint ventures, MoU agreements, VC & funding activities, R&D activities, and geographic expansion among other noteworthy activities by key players of the natural food colors market are appropriately highlighted in the report.

A growing preference for natural products over artificial colorants is expected to trigger the market. The benefits of natural materials over dangerous artificial goods in the near future are expected to increase consumers ' awareness. The increased demand is expected to positively affect applications such as medicines, bakery, pastry, and dairy products, carotenoids, curcumin, and anthocyanin. This trend is expected to drive market growth during the forecast period.

The demand for natural food colors is anticipated to rise in the Asia Pacific region, especially in the populated countries of China and India. The main reason for this was the introduction of new products with natural ingredients. Carmine is Asia Pacific's favored Red-colored pigment, while beta-carotene and carotenoids are the preferred Orange-Yellow pigments. The demand will raise the choice of natural products over artificial dyes.

The natural food colors market research report delivers an acute evaluation and taxonomy of the natural food colors industry by practically splitting the market on the basis of different pigments, applications, and regions. Through the analysis of the historical and projected trends, all the segments and sub-segments were evaluated through the bottom-up approach, and different market sizes have been projected for FY 2023 to FY 2030.

logoReport Scope

Report Attribute

Details

Market Size in 2022

USD 1,645 Million

Projected Market Size in 2030

USD 2,578 Million

CAGR Growth Rate

6.63% CAGR

Base Year

2022

Forecast Years

2023-2030

Key Market Players

Roha Dyechem Pvt. Ltd., GNT International B.V., Kalsec Inc., D.D. Williamson & Co. Inc., Archer Daniels Midland Company, Chr. Hansen A/S, Naturex S.A., Adama Agricultural Solutions Ltd., Symrise AG and Sensient Technologies Corporation, and Others

Key Segment

By Pigment, Application, and Region

Major Regions Covered

North America, Europe, Asia Pacific, Latin America, and the Middle East & Africa

Purchase Options

Request customized purchase options to meet your research needs.Explore purchase options

The regional segmentation of the natural food colors industry includes the complete classification of all the major continents including North America, Latin America, Europe, Asia Pacific, and the Middle East & Africa. Further, country-wise data for the natural food colors industry is provided for the leading economies of the world.

The natural food colors market is segmented based on pigment and application. On the basis of pigment segmentation, the market is classified into carotenoid, curcumin, paprika extract, spirulina extract, chlorophyll, carmine, and others. In terms of application segmentation, the market is bifurcated into dairy, beverages, packaged food, frozen food, bakery & confectionery, and others.

logoSome of the essential players operating in the natural food colors market include:

  • Roha Dyechem Pvt. Ltd.
  •  GNT International B.V.
  •  Kalsec Inc.
  •  D.D. Williamson & Co. Inc.
  •  Archer Daniels Midland Company
  •  Chr. Hansen A/S
  •  Naturex S.A.
  •  Adama Agricultural Solutions Ltd.
  •  Symrise AG and Sensient Technologies Corporation

The taxonomy of the natural food colors industry by its scope and segmentation is as follows:

logoBy PigmentSegmentation Analysis

  • Carotenoid
  • Curcumin
  • Paprika Extract
  • Spirulina Extract
  • Chlorophyll
  • Carmine
  • Others

logoBy Application Segmentation Analysis

  • Dairy
  • Beverages
  • Packaged food
  • Frozen food
  • Bakery & confectionary
  • Others

logoBy Regional Segmentation Analysis

  • North America
    • The U.S.
    • Canada
  • Europe
    • Germany
    • The UK
    • France
    • Spain
    • Italy
    • Rest of Europe
  • Asia Pacific
    • China
    • Japan
    • India
    • South Korea
    • Southeast Asia
    • Rest of Asia Pacific
  • Latin America
    • Brazil
    • Mexico
    • Rest of Latin America
  • Middle East & Africa
    • GCC
    • South Africa
    • Rest of Middle East & Africa

Table of Content

  1. CHAPTER 1. Executive Summary
  2. CHAPTER 2. Natural Food Colors market – Pigment Analysis
    1. 2.1. Global Natural Food Colors Market – Pigment Overview
    2. 2.2. Global Natural Food Colors Market Share, by Pigment, 2022 & 2030 (USD Million)
    3. 2.3. Carotenoid
      1. 2.3.1. Global Carotenoid Natural Food Colors Market, 2020-2022 (USD Million)
    4. 2.4. Curcumin
      1. 2.4.1. Global Curcumin Natural Food Colors Market, 2020-2022 (USD Million)
    5. 2.5. Paprika Extract
      1. 2.5.1. Global Paprika Extract Natural Food Colors Market, 2020-2022 (USD Million)
    6. 2.6. Spirulina Extract
      1. 2.6.1. Global Spirulina Extract Natural Food Colors Market, 2020-2022 (USD Million)
    7. 2.7. Chlorophyll
      1. 2.7.1. Global Chlorophyll Natural Food Colors Market, 2020-2022 (USD Million)
    8. 2.8. Carmine
      1. 2.8.1. Global Carmine Natural Food Colors Market, 2020-2022 (USD Million)
    9. 2.9. Others
      1. 2.9.1. Global Others Natural Food Colors Market, 2020-2022 (USD Million)
  3. CHAPTER 3. Natural Food Colors market – Application Analysis
    1. 3.1. Global Natural Food Colors Market – Application Overview
    2. 3.2. Global Natural Food Colors Market Share, by Application, 2022 & 2030 (USD Million)
    3. 3.3. Dairy
      1. 3.3.1. Global Dairy Natural Food Colors Market, 2020-2022 (USD Million)
    4. 3.4. Beverages
      1. 3.4.1. Global Beverages Natural Food Colors Market, 2020-2022 (USD Million)
    5. 3.5. Packaged Food
      1. 3.5.1. Global Packaged Food Natural Food Colors Market, 2020-2022 (USD Million)
    6. 3.6. Frozen Food
      1. 3.6.1. Global Frozen Food Natural Food Colors Market, 2020-2022 (USD Million)
    7. 3.7. Bakery & Confectionery
      1. 3.7.1. Global Bakery & Confectionery Natural Food Colors Market, 2020-2022 (USD Million)
    8. 3.8. Others
      1. 3.8.1. Global Others Natural Food Colors Market, 2020-2022 (USD Million)
  4. CHAPTER 4. Natural Food Colors market – Regional Analysis
    1. 4.1. Global Natural Food Colors Market Regional Overview
    2. 4.2. Global Natural Food Colors Market Share, by Region, 2022 & 2030 (Value)
    3. 4.3. North America
      1. 4.3.1. North America Natural Food Colors Market size and forecast, 2020-2022
      2. 4.3.2. North America Natural Food Colors Market, by Country, 2022 & 2030 (USD Million)
      3. 4.3.3. North America Natural Food Colors Market, by Pigment, 2020-2022
        1. 4.3.3.1. North America Natural Food Colors Market, by Pigment, 2020-2022 (USD Million)
      4. 4.3.4. North America Natural Food Colors Market, by Application, 2020-2022
        1. 4.3.4.1. North America Natural Food Colors Market, by Application, 2020-2022 (USD Million)
      5. 4.3.5. U.S.
        1. 4.3.5.1. U.S. Market size and forecast, 2020-2022 (USD Million)
      6. 4.3.6. Canada
        1. 4.3.6.1. Canada Market size and forecast, 2020-2022 (USD Million)
    4. 4.4. Europe
      1. 4.4.1. Europe Natural Food Colors Market size and forecast, 2020-2022
      2. 4.4.2. Europe Natural Food Colors Market, by Country, 2022 & 2030 (USD Million)
      3. 4.4.3. Europe Natural Food Colors Market, by Pigment, 2020-2022
        1. 4.4.3.1. Europe Natural Food Colors Market, by Pigment, 2020-2022 (USD Million)
      4. 4.4.4. Europe Natural Food Colors Market, by Application, 2020-2022
        1. 4.4.4.1. Europe Natural Food Colors Market, by Application, 2020-2022 (USD Million)
      5. 4.4.5. Germany
        1. 4.4.5.1. Germany Market size and forecast, 2020-2022 (USD Million)
      6. 4.4.6. France
        1. 4.4.6.1. France Market size and forecast, 2020-2022 (USD Million)
      7. 4.4.7. U.K.
        1. 4.4.7.1. U.K. Market size and forecast, 2020-2022 (USD Million)
      8. 4.4.8. Italy
        1. 4.4.8.1. Italy Market size and forecast, 2020-2022 (USD Million)
      9. 4.4.9. Spain
        1. 4.4.9.1. Spain Market size and forecast, 2020-2022 (USD Million)
      10. 4.4.10. Rest of Europe
        1. 4.4.10.1. Rest of Europe Market size and forecast, 2020-2022 (USD Million)
    5. 4.5. Asia Pacific
      1. 4.5.1. Asia Pacific Natural Food Colors Market size and forecast, 2020-2022
      2. 4.5.2. Asia Pacific Natural Food Colors Market, by Country, 2022 & 2030 (USD Million)
      3. 4.5.3. Asia Pacific Natural Food Colors Market, by Pigment, 2020-2022
        1. 4.5.3.1. Asia Pacific Natural Food Colors Market, by Pigment, 2020-2022 (USD Million)
      4. 4.5.4. Asia Pacific Natural Food Colors Market, by Application, 2020-2022
        1. 4.5.4.1. Asia Pacific Natural Food Colors Market, by Application, 2020-2022 (USD Million)
      5. 4.5.5. China
        1. 4.5.5.1. China Market size and forecast, 2020-2022 (USD Million)
      6. 4.5.6. Japan
        1. 4.5.6.1. Japan Market size and forecast, 2020-2022 (USD Million)
      7. 4.5.7. India
        1. 4.5.7.1. India Market size and forecast, 2020-2022 (USD Million)
      8. 4.5.8. South  Korea
        1. 4.5.8.1. South  Korea Market size and forecast, 2020-2022 (USD Million)
      9. 4.5.9. South-East Asia
        1. 4.5.9.1. South-East Asia Market size and forecast, 2020-2022 (USD Million)
      10. 4.5.10. Rest of Asia Pacific
        1. 4.5.10.1. Rest of Asia Pacific Market size and forecast, 2020-2022 (USD Million)
    6. 4.6. Latin America
      1. 4.6.1. Latin America Natural Food Colors Market size and forecast, 2020-2022
      2. 4.6.2. Latin America Natural Food Colors Market, by Country, 2022 & 2030 (USD Million)
      3. 4.6.3. Latin America Natural Food Colors Market, by Pigment, 2020-2022
        1. 4.6.3.1. Latin America Natural Food Colors Market, by Pigment, 2020-2022 (USD Million)
      4. 4.6.4. Latin America Natural Food Colors Market, by Application, 2020-2022
        1. 4.6.4.1. Latin America Natural Food Colors Market, by Application, 2020-2022 (USD Million)
      5. 4.6.5. Brazil
        1. 4.6.5.1. Brazil Market size and forecast, 2020-2022 (USD Million)
      6. 4.6.6. Mexico
        1. 4.6.6.1. Mexico Market size and forecast, 2020-2022 (USD Million)
      7. 4.6.7. Rest of Latin America
        1. 4.6.7.1. Rest of Latin America Market size and forecast, 2020-2022 (USD Million)
    7. 4.7. The Middle-East and Africa
      1. 4.7.1. The Middle-East and Africa Natural Food Colors Market size and forecast, 2020-2022
      2. 4.7.2. The Middle-East and Africa Natural Food Colors Market, by Country, 2022 & 2030 (USD Million)
      3. 4.7.3. The Middle-East and Africa Natural Food Colors Market, by Pigment, 2020-2022
        1. 4.7.3.1. The Middle-East and Africa Natural Food Colors Market, by Pigment, 2020-2022 (USD Million)
      4. 4.7.4. The Middle-East and Africa Natural Food Colors Market, by Application, 2020-2022
        1. 4.7.4.1. The Middle-East and Africa Natural Food Colors Market, by Application, 2020-2022 (USD Million)
      5. 4.7.5. GCC Countries
        1. 4.7.5.1. GCC Countries Market size and forecast, 2020-2022 (USD Million)
      6. 4.7.6. South Africa
        1. 4.7.6.1. South Africa Market size and forecast, 2020-2022 (USD Million)
      7. 4.7.7. Rest of Middle-East Africa
        1. 4.7.7.1. Rest of Middle-East Africa Market size and forecast, 2020-2022 (USD Million)
  5. CHAPTER 5. Natural Food Colors market – Competitive Landscape
    1. 5.1. Competitor Market Share – Revenue
    2. 5.2. Market Concentration Rate Analysis, Top 3 and Top 5 Players
    3. 5.3. Strategic Development
      1. 5.3.1. Acquisitions and Mergers
      2. 5.3.2. New Products
      3. 5.3.3. Research & Development Activities
  6. CHAPTER 6. Company Profiles
    1. 6.1. Roha Dyechem Pvt. Ltd.
      1. 6.1.1. Company Overview
      2. 6.1.2. Roha Dyechem Pvt. Ltd. Revenue and Gross Margin
      3. 6.1.3. Product portfolio
      4. 6.1.4. Recent initiatives
    2. 6.2. GNT International B.V.
      1. 6.2.1. Company Overview
      2. 6.2.2. GNT International B.V. Revenue and Gross Margin
      3. 6.2.3. Product portfolio
      4. 6.2.4. Recent initiatives
    3. 6.3. Kalsec Inc.
      1. 6.3.1. Company Overview
      2. 6.3.2. Kalsec Inc. Revenue and Gross Margin
      3. 6.3.3. Product portfolio
      4. 6.3.4. Recent initiatives
    4. 6.4. D.D. Williamson & Co. Inc.
      1. 6.4.1. Company Overview
      2. 6.4.2. D.D. Williamson & Co. Inc. Revenue and Gross Margin
      3. 6.4.3. Product portfolio
      4. 6.4.4. Recent initiatives
    5. 6.5. Archer Daniels Midland Company
      1. 6.5.1. Company Overview
      2. 6.5.2. Archer Daniels Midland Company Revenue and Gross Margin
      3. 6.5.3. Product portfolio
      4. 6.5.4. Recent initiatives
    6. 6.6. Chr. Hansen A/S
      1. 6.6.1. Company Overview
      2. 6.6.2. Chr. Hansen A/S Revenue and Gross Margin
      3. 6.6.3. Product portfolio
      4. 6.6.4. Recent initiatives
    7. 6.7. Naturex S.A.
      1. 6.7.1. Company Overview
      2. 6.7.2. Naturex S.A. Revenue and Gross Margin
      3. 6.7.3. Product portfolio
      4. 6.7.4. Recent initiatives
    8. 6.8. Adama Agricultural Solutions Ltd.
      1. 6.8.1. Company Overview
      2. 6.8.2. Adama Agricultural Solutions Ltd. Revenue and Gross Margin
      3. 6.8.3. Product portfolio
      4. 6.8.4. Recent initiatives
    9. 6.9. Symrise AG and Sensient Technologies Corporation
      1. 6.9.1. Company Overview
      2. 6.9.2. Symrise AG and Sensient Technologies Corporation Revenue and Gross Margin
      3. 6.9.3. Product portfolio
      4. 6.9.4. Recent initiatives
  7. CHAPTER 7. Natural Food Colors — Industry Analysis
    1. 7.1. Natural Food Colors Market – Key Trends
      1. 7.1.1. Market Drivers
      2. 7.1.2. Market Restraints
      3. 7.1.3. Market Opportunities
    2. 7.2. Value Chain Analysis
    3. 7.3. Technology Roadmap and Timeline
    4. 7.4. Natural Food Colors Market – Attractiveness Analysis
      1. 7.4.1. By Pigment
      2. 7.4.2. By Application
      3. 7.4.3. By Region
  8. CHAPTER 8. Marketing Strategy Analysis, Distributors
    1. 8.1. Marketing Channel
    2. 8.2. Direct Marketing
    3. 8.3. Indirect Marketing
    4. 8.4. Marketing Channel Development Trend
    5. 8.5. Economic/Political Environmental Change
  9. CHAPTER 9. Report Conclusion
  10. CHAPTER 10. Research Approach & Methodology
    1. 10.1. Report Description
    2. 10.2. Research Scope
    3. 10.3. Research Methodology
      1. 10.3.1. Secondary Research
      2. 10.3.2. Primary Research
      3. 10.3.3. Models
        1. 10.3.3.1. Company Share Analysis Model
        2. 10.3.3.2. Revenue Based Modeling
        3. 10.3.3.3. Research Limitations

        List of Figures

        FIG. 1 Global Natural Food Colors Market, 2020-2022 (USD Million)
        FIG. 2 Global Natural Food Colors Market Share, by Pigment, 2022-2030 (USD Million)
        FIG. 3 Global Carotenoid Natural Food Colors Market, 2020-2022 (USD Million)
        FIG. 4 Global Curcumin Natural Food Colors Market, 2020-2022 (USD Million)
        FIG. 5 Global Paprika Extract Natural Food Colors Market, 2020-2022 (USD Million)
        FIG. 6 Global Spirulina Extract Natural Food Colors Market, 2020-2022 (USD Million)
        FIG. 7 Global Chlorophyll Natural Food Colors Market, 2020-2022 (USD Million)
        FIG. 8 Global Carmine Natural Food Colors Market, 2020-2022 (USD Million)
        FIG. 9 Global Others Natural Food Colors Market, 2020-2022 (USD Million)
        FIG. 10 Global Natural Food Colors Market Share, by Application, 2022-2030 (USD Million)
        FIG. 11 Global Dairy Natural Food Colors Market, 2020-2022 (USD Million)
        FIG. 12 Global Beverages Natural Food Colors Market, 2020-2022 (USD Million)
        FIG. 13 Global Packaged Food Natural Food Colors Market, 2020-2022 (USD Million)
        FIG. 14 Global Frozen Food Natural Food Colors Market, 2020-2022 (USD Million)
        FIG. 15 Global Bakery & Confectionery Natural Food Colors Market, 2020-2022 (USD Million)
        FIG. 16 Global Others Natural Food Colors Market, 2020-2022 (USD Million)
        FIG. 17 Global Natural Food Colors Market Share, by Region, 2022-2030
        FIG. 18 North America Natural Food Colors Market, 2020-2022
        FIG. 19 U.S. Natural Food Colors Market, 2020-2022
        FIG. 20 Canada Natural Food Colors Market, 2020-2022
        FIG. 21 Europe Natural Food Colors Market, 2020-2022
        FIG. 22 Germany Natural Food Colors Market, 2020-2022
        FIG. 23 France Natural Food Colors Market, 2020-2022
        FIG. 24 U.K. Natural Food Colors Market, 2020-2022
        FIG. 25 Italy Natural Food Colors Market, 2020-2022
        FIG. 26 Spain Natural Food Colors Market, 2020-2022
        FIG. 27 Rest of Europe Natural Food Colors Market, 2020-2022
        FIG. 28 Asia Pacific Natural Food Colors Market, 2020-2022
        FIG. 29 China Natural Food Colors Market, 2020-2022
        FIG. 30 Japan Natural Food Colors Market, 2020-2022
        FIG. 31 India Natural Food Colors Market, 2020-2022
        FIG. 32 South  Korea Natural Food Colors Market, 2020-2022
        FIG. 33 South-East Asia Natural Food Colors Market, 2020-2022
        FIG. 34 Rest of Asia Pacific Natural Food Colors Market, 2020-2022
        FIG. 35 Latin America Natural Food Colors Market, 2020-2022
        FIG. 36 Brazil Natural Food Colors Market, 2020-2022
        FIG. 37 Mexico Natural Food Colors Market, 2020-2022
        FIG. 38 Rest of Latin America Natural Food Colors Market, 2020-2022
        FIG. 39 The Middle-East and Africa Natural Food Colors Market, 2020-2022
        FIG. 40 GCC Countries Natural Food Colors Market, 2020-2022
        FIG. 41 South Africa Natural Food Colors Market, 2020-2022
        FIG. 42 Rest of Middle-East Africa Natural Food Colors Market, 2020-2022
        FIG. 43 Competitor Market Share – Revenue
        FIG. 44 Roha Dyechem Pvt. Ltd. Revenue and Growth Rate
        FIG. 45 Roha Dyechem Pvt. Ltd. Market Share
        FIG. 46 GNT International B.V. Revenue and Growth Rate
        FIG. 47 GNT International B.V. Market Share
        FIG. 48 Kalsec Inc. Revenue and Growth Rate
        FIG. 49 Kalsec Inc. Market Share
        FIG. 50 D.D. Williamson & Co. Inc. Revenue and Growth Rate
        FIG. 51 D.D. Williamson & Co. Inc. Market Share
        FIG. 52 Archer Daniels Midland Company Revenue and Growth Rate
        FIG. 53 Archer Daniels Midland Company Market Share
        FIG. 54 Chr. Hansen A/S Revenue and Growth Rate
        FIG. 55 Chr. Hansen A/S Market Share
        FIG. 56 Naturex S.A. Revenue and Growth Rate
        FIG. 57 Naturex S.A. Market Share
        FIG. 58 Adama Agricultural Solutions Ltd. Revenue and Growth Rate
        FIG. 59 Adama Agricultural Solutions Ltd. Market Share
        FIG. 60 Symrise AG and Sensient Technologies Corporation Revenue and Growth Rate
        FIG. 61 Symrise AG and Sensient Technologies Corporation Market Share
        FIG. 62 Market Dynamics
        FIG. 63 Global Natural Food Colors – Value Chain Analysis
        FIG. 64 Technology Roadmap and Timeline
        FIG. 65 Market Attractiveness Analysis – By Pigment
        FIG. 66 Market Attractiveness Analysis – By Application
        FIG. 67 Market Attractiveness Analysis – By Region
        FIG. 68 Market Channel
        FIG. 69 Marketing Channel Development Trend
        FIG. 70 Growth in World Gross Product, 2008-2018

        List of Tables

        TABLE 1 Global Natural Food Colors Market, 2022 & 2030 (USD Million)
        TABLE 2 Global Natural Food Colors market, by Pigment, 2020-2022 (USD Million)
        TABLE 3 Global Natural Food Colors market, by Application, 2020-2022 (USD Million)
        TABLE 4 Global Natural Food Colors market, by Region, 2020-2022 (USD Million)
        TABLE 5 North America Natural Food Colors Market, by Pigment, 2020-2022 (USD Million)
        TABLE 6 North America Natural Food Colors Market, by Application, 2020-2022 (USD Million)
        TABLE 7 Europe Natural Food Colors Market, by Pigment, 2020-2022 (USD Million)
        TABLE 8 Europe Natural Food Colors Market, by Application, 2020-2022 (USD Million)
        TABLE 9 Asia Pacific Natural Food Colors Market, by Pigment, 2020-2022 (USD Million)
        TABLE 10 Asia Pacific Natural Food Colors Market, by Application, 2020-2022 (USD Million)
        TABLE 11 Latin America Natural Food Colors Market, by Pigment, 2020-2022 (USD Million)
        TABLE 12 Latin America Natural Food Colors Market, by Application, 2020-2022 (USD Million)
        TABLE 13 The Middle-East and Africa Natural Food Colors Market, by Pigment, 2020-2022 (USD Million)
        TABLE 14 The Middle-East and Africa Natural Food Colors Market, by Application, 2020-2022 (USD Million)
        TABLE 15 Global Natural Food Colors Market - Company Revenue Analysis 2016-2026 (USD Million)
        TABLE 16 Global Natural Food Colors Market - Company Revenue Share Analysis 2016-2026(%)
        TABLE 17 Acquisitions and Mergers
        TABLE 18 New Product/Service Launch
        TABLE 19 Research & Development Activities
        TABLE 20 Market Drivers
        TABLE 21 Market Restraints
        TABLE 22 Market Opportunities

Industry Major Market Players

  • Roha Dyechem Pvt. Ltd.
  •  GNT International B.V.
  •  Kalsec Inc.
  •  D.D. Williamson & Co. Inc.
  •  Archer Daniels Midland Company
  •  Chr. Hansen A/S
  •  Naturex S.A.
  •  Adama Agricultural Solutions Ltd.
  •  Symrise AG and Sensient Technologies Corporation