Search Market Research Report

Discover Our Latest Reports
Discover Our Featured Reports
Discover Top Selling Reports

Nanomaterials Market Size, Share Global Analysis Report, 2020–2026

report img

Nanomaterials Market By Type (Aluminum Oxide Nanoparticles, Silicon Dioxide, Antimony Tin Oxide Nanoparticles, Titanium Dioxide Nanoparticles, Bismuth Oxide Nanoparticles, Graphene, Copper Oxide Nanoparticles, Carbon Nanotubes, Fullerene, and Cerium Oxide Nanoparticles), and By Application (Aerospace, Paints & Coatings, Automotive, Electronics, Energy & Power, Medical, and Others): Global Industry Outlook, Market Size, Business Intelligence, Consumer Preferences, Statistical Surveys, Comprehensive Analysis, Historical Developments, Current Trends, and Forecast 2020–2026

Industry Insights

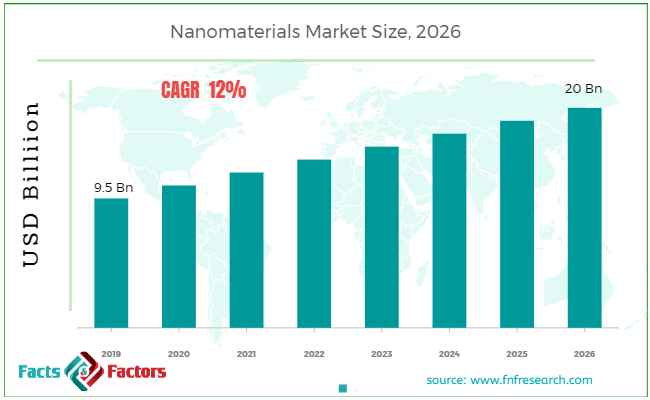
[210+ Pages Report] According to the report published by Facts Factors, the global nanomaterials market size was worth around USD 9.5 billion in 2019 and is predicted to grow to around USD 20 billion by 2026 with a compound annual growth rate (CAGR) of roughly 12% between 2020 and 2026. The report analyzes the global nanomaterials market drivers, restraints/challenges, and the effect they have on the demands during the projection period. In addition, the report explores emerging opportunities in the nanomaterials market.

Nanomaterials Market Size

To know more about this report | Request Free Sample Copy

This specialized and expertise oriented industry research report scrutinizes the technical and commercial business outlook of the Nanomaterials industry. The report analyzes and declares the historical and current trends analysis of the Nanomaterials industry and subsequently recommends the projected trends anticipated to be observed in the Nanomaterials market during the upcoming years.

The nanomaterials market report analyzes and notifies the industry statistics at the global as well as regional and country levels in order to acquire a thorough perspective of the entire Nanomaterials market. The historical and past insights are provided for FY 2016 to FY 2019 whereas projected trends are delivered for FY 2020 to FY 2026. The quantitative and numerical data is represented in terms of both volume (Kilo Tons) and value (USD Million) from FY 2016 – 2026.


logoKey Insights from Primary Research

  • In line with the response collected from the primary respondent, the global nanomaterials market is estimated to grow at a CAGR of 12 percent.
  • The market was at around USD 9.5 billion in 2019 and it is estimated to cross approximately USD 20 billion by 2026.
  • From the primary research conducted by our analysts, aerospace, energy, and power and electronics are the prominent end-user industries to tap.
  • The electronics industry is projected to acquire a major contribution to the market with a market share of more than 25 percent.
  • However, the growth of the electronics industry is estimated to be followed by the Aerospace, and Energy & Power industry.

logoKey Recommendations from Analysts

  • As per the research conducted by our industry expert Analysts, the aerospace industry is predominantly dependent on the nonomaterials. An increase in space programs is expected to assist the market growth.
  • The global shift to solar energy is estimated to generate a lucrative demand for nanomaterials. Owing to rising concerns over climate change leading governments have started focusing on sustainable and clean solar energy.
  • Advanced electronics is one of the prominent drivers of the nanomaterials industry. Nanomaterials are used in semiconductors which are prominently consumed by the electronic industry.
  • The growth of electronic production units in the Asia Pacific due to low operation and labor cost is predicted to trigger the demand for nanomaterials.

The quantitative data is further underlined and reinforced by comprehensive qualitative data which comprises various across-the-board market dynamics. The rationales which directly or indirectly impact the Nanomaterials industry are exemplified through parameters such as growth drivers, restraints, challenges, and opportunities among other impacting factors.

Throughout our research report, we have encompassed all the proven models and tools of industry analysis and extensively illustrated all the key business strategies and business models adopted in the Nanomaterials industry. The report provides an all-inclusive and detailed competitive landscape prevalent in the Nanomaterials market.

The report utilizes established industry analysis tools and models such as Porter’s Five Forces framework to analyze and recognize critical business strategies adopted by various stakeholders involved in the entire value chain of the Nanomaterials industry. The Nanomaterials market report additionally employs SWOT analysis and PESTLE analysis models for further in-depth analysis.

The report study further includes an in-depth analysis of industry players' market shares and provides an overview of leading players' market position in the Nanomaterials sector. Key strategic developments in the Nanomaterials market competitive landscape such as acquisitions & mergers, inaugurations of different products and services, partnerships & joint ventures, MoU agreements, VC & funding activities, R&D activities, and geographic expansion among other noteworthy activities by key players of the Nanomaterials market are appropriately highlighted in the report.

The growth of electronics and solar energy is estimated to generate significant demand for nanomaterials. The rise in the electronics manufacturing units in the Asia Pacific market is expected to create a lucrative demand for nanomaterials. The global shift to clean solar energy is one of the driving factors of the market. However, an increase in the cost of specialized nanomaterials may shift the end-user industry to the low-cost substitutes.

The Nanomaterials market research report delivers an acute valuation and taxonomy of the Nanomaterials industry by practically splitting the market on the basis of different types, applications, and regions. Through the analysis of the historical and projected trends, all the segments and sub-segments were evaluated through the bottom-up approach, and different market sizes have been projected for FY 2020 to FY 2026.

logoReport Scope

Report Attribute

Details

Market Size in 2019

USD 9.5 Billion

Projected Market Size in 2026

USD 20 Billion

CAGR Growth Rate

12% CAGR

Base Year

2019

Forecast Years

2020-2026

Key Market Players

Strem Chemicals, Inc., Nanophase Technologies Corporation, American Elements, Nanostructured & Amorphous Materials, Inc., US Research Nanomaterials, Inc., Hyperion Catalysis International Inc., Nanocomposix, Inc., Quantum Materials Corp., Reade International Corporation, SkySpring Nanomaterials, Inc., Cytodiagnostics, Inc., NanoMaterials Technology Pte Ltd., Nanografi Nano Technology, Nanoshel, and Frontier Carbon Corporation., and Others

Key Segment

By Type, End-Use, and Region

Major Regions Covered

North America, Europe, Asia Pacific, Latin America, and the Middle East & Africa

Purchase Options

Request customized purchase options to meet your research needs. Explore purchase options

The regional segmentation of the Nanomaterials industry includes the complete classification of all the major continents including North America, Latin America, Europe, Asia Pacific, and the Middle East & Africa. Further, country-wise data for the Nanomaterials industry is provided for the leading economies of the world.

The Nanomaterials market is segmented based on type and application. On the basis of type segmentation, the market is split into aluminum oxide nanoparticles, silicon dioxide, antimony tin oxide nanoparticles, titanium dioxide nanoparticles, bismuth oxide nanoparticles, graphene, copper oxide nanoparticles, carbon nanotubes, fullerene, and cerium oxide nanoparticles. In terms of application segmentation, the market is divided into aerospace, paints & coatings, automotive, electronics, energy & power, medical, and others.

logoSome of the leading players in the global market include

  •  Strem Chemicals Inc.
  •  Nanophase Technologies Corporation
  •  American Elements
  •  Nanostructured & Amorphous Materials Inc.
  •  US Research Nanomaterials Inc.
  •  Hyperion Catalysis International Inc.
  •  Nanocomposix Inc.
  •  Quantum Materials Corp.
  •  Reade International Corporation
  •  SkySpring Nanomaterials Inc.
  •  Cytodiagnostics Inc.
  •  NanoMaterials Technology Pte Ltd.
  •  Nanografi Nano Technology
  •  Nanoshel
  •   Frontier Carbon Corporation

The taxonomy of the Nanomaterials industry by its scope and segmentation is as follows:

logo By Type Segmentation Analysis (Customizable)

  • Aluminum Oxide Nanoparticles
  • Silicon Dioxide
  • Antimony Tin Oxide Nanoparticles
  • Titanium Dioxide Nanoparticles
  • Bismuth Oxide Nanoparticles
  • Graphene
  • Copper Oxide Nanoparticles
  • Carbon Nanotubes
  • Fullerene
  • Cerium Oxide Nanoparticles
  • Others

logo By Application Segmentation Analysis (Customizable)

  • Aerospace
  • Paints & Coatings
  • Automotive
  • Electronics
  • Energy & Power
  • Medical
  • Others

logo Regional Segmentation Analysis (Customizable)

  • North America
    • The U.S.
    • Canada
  • Europe
    • Germany
    • The UK
    • France
    • Spain
    • Italy
    • Rest of Europe
  • Asia Pacific
    • China
    • Japan
    • India
    • South Korea
    • Southeast Asia
    • Rest of Asia Pacific
  • Latin America
    • Brazil
    • Mexico
    • Rest of Latin America
  • Middle East & Africa
    • GCC
    • South Africa
    • Rest of Middle East & Africa

Table of Content

  1. Chapter 1 Executive Summary
    1. 1.1. Introduction of Nanomaterials
    2. 1.2. Global Nanomaterials Market, 2019 & 2026 (USD Million)
    3. 1.3. Global Nanomaterials Market, 2016 – 2026 (USD Million) (Kilo Tons)
    4. 1.4. Global Nanomaterials Market Absolute Revenue Opportunity, 2016 – 2026 (USD Million)
    5. 1.5. Global Nanomaterials Market Incremental Revenue Opportunity, 2020 – 2026 (USD Million)
  2. Chapter 2 Nanomaterials Market – Type Analysis
    1. 2.1. Global Nanomaterials Market – Type Overview
    2. 2.2. Global Nanomaterials Market Share, by Type, 2019 & 2026 (USD Million)
    3. 2.3. Global Nanomaterials Market share, by Type, 2019 & 2026 (Kilo Tons)
    4. 2.4. Aluminum Oxide Nanoparticles
      1. 2.4.1. Global Aluminum Oxide Nanoparticles Nanomaterials Market, 2016 – 2026 (USD Million)
      2. 2.4.2. Global Aluminum Oxide Nanoparticles Nanomaterials Market, 2016 – 2026 (Kilo Tons)
    5. 2.5. Silicon Dioxide
      1. 2.5.1. Global Silicon Dioxide Nanomaterials Market, 2016 – 2026 (USD Million)
      2. 2.5.2. Global Silicon Dioxide Nanomaterials Market, 2016 – 2026 (Kilo Tons)
    6. 2.6. Antimony Tin Oxide Nanoparticles
      1. 2.6.1. Global Antimony Tin Oxide Nanoparticles Nanomaterials Market, 2016 – 2026 (USD Million)
      2. 2.6.2. Global Antimony Tin Oxide Nanoparticles Nanomaterials Market, 2016 – 2026 (Kilo Tons)
    7. 2.7. Titanium Dioxide Nanoparticles
      1. 2.7.1. Global Titanium Dioxide Nanoparticles Nanomaterials Market, 2016 – 2026 (USD Million)
      2. 2.7.2. Global Titanium Dioxide Nanoparticles Nanomaterials Market, 2016 – 2026 (Kilo Tons)
    8. 2.8. Bismuth Oxide Nanoparticles
      1. 2.8.1. Global Bismuth Oxide Nanoparticles Nanomaterials Market, 2016 – 2026 (USD Million)
      2. 2.8.2. Global Bismuth Oxide Nanoparticles Nanomaterials Market, 2016 – 2026 (Kilo Tons)
    9. 2.9. Graphene
      1. 2.9.1. Global Graphene Nanomaterials Market, 2016 – 2026 (USD Million)
      2. 2.9.2. Global Graphene Nanomaterials Market, 2016 – 2026 (Kilo Tons)
    10. 2.10. Copper Oxide Nanoparticles
      1. 2.10.1. Global Copper Oxide Nanoparticles Nanomaterials Market, 2016 – 2026 (USD Million)
      2. 2.10.2. Global Copper Oxide Nanoparticles Nanomaterials Market, 2016 – 2026 (Kilo Tons)
    11. 2.11. Carbon Nanotubes
      1. 2.11.1. Global Carbon Nanotubes Nanomaterials Market, 2016 – 2026 (USD Million)
      2. 2.11.2. Global Carbon Nanotubes Nanomaterials Market, 2016 – 2026 (Kilo Tons)
    12. 2.12. Fullerene
      1. 2.12.1. Global Fullerene Nanomaterials Market, 2016 – 2026 (USD Million)
      2. 2.12.2. Global Fullerene Nanomaterials Market, 2016 – 2026 (Kilo Tons)
    13. 2.13. Cerium Oxide Nanoparticles
      1. 2.13.1. Global Cerium Oxide Nanoparticles Nanomaterials Market, 2016 – 2026 (USD Million)
      2. 2.13.2. Global Cerium Oxide Nanoparticles Nanomaterials Market, 2016 – 2026 (Kilo Tons)
    14. 2.14. Others
      1. 2.14.1. Global Others Nanomaterials Market, 2016 – 2026 (USD Million)
      2. 2.14.2. Global Others Nanomaterials Market, 2016 – 2026 (Kilo Tons)
  3. Chapter 3 Nanomaterials Market – Application Analysis
    1. 3.1. Global Nanomaterials Market – Application Overview
    2. 3.2. Global Nanomaterials Market Share, by Application, 2019 & 2026 (USD Million)
    3. 3.3. Global Nanomaterials Market share, by Application, 2019 & 2026 (Kilo Tons)
    4. 3.4. Aerospace
      1. 3.4.1. Global Aerospace Nanomaterials Market, 2016 – 2026 (USD Million)
      2. 3.4.2. Global Aerospace Nanomaterials Market, 2016 – 2026 (Kilo Tons)
    5. 3.5. Paints & Coatings
      1. 3.5.1. Global Paints & Coatings Nanomaterials Market, 2016 – 2026 (USD Million)
      2. 3.5.2. Global Paints & Coatings Nanomaterials Market, 2016 – 2026 (Kilo Tons)
    6. 3.6. Automotive
      1. 3.6.1. Global Automotive Nanomaterials Market, 2016 – 2026 (USD Million)
      2. 3.6.2. Global Automotive Nanomaterials Market, 2016 – 2026 (Kilo Tons)
    7. 3.7. Electronics
      1. 3.7.1. Global Electronics Nanomaterials Market, 2016 – 2026 (USD Million)
      2. 3.7.2. Global Electronics Nanomaterials Market, 2016 – 2026 (Kilo Tons)
    8. 3.8. Energy & Power
      1. 3.8.1. Global Energy & Power Nanomaterials Market, 2016 – 2026 (USD Million)
      2. 3.8.2. Global Energy & Power Nanomaterials Market, 2016 – 2026 (Kilo Tons)
    9. 3.9. Medical
      1. 3.9.1. Global Medical Nanomaterials Market, 2016 – 2026 (USD Million)
      2. 3.9.2. Global Medical Nanomaterials Market, 2016 – 2026 (Kilo Tons)
    10. 3.10. Others
      1. 3.10.1. Global Others Nanomaterials Market, 2016 – 2026 (USD Million)
      2. 3.10.2. Global Others Nanomaterials Market, 2016 – 2026 (Kilo Tons)
  4. Chapter 4 Nanomaterials Market – Regional Analysis
    1. 4.1. Global Nanomaterials Market Regional Overview
    2. 4.2. Global Nanomaterials Market Share, by Region, 2019 & 2026 (USD Million)
    3. 4.3. Global Nanomaterials Market Share, by Region, 2019 & 2026 (Kilo Tons)
    4. 4.4. North America
      1. 4.4.1. North America Nanomaterials Market, 2016 – 2026 (USD Million)
        1. 4.4.1.1. North America Nanomaterials Market, by Country, 2016 – 2026 (USD Million)
      2. 4.4.2. North America Market, 2016 – 2026 (Kilo Tons)
        1. 4.4.2.1. North America Nanomaterials Market, by Country, 2016 – 2026 (Kilo Tons)
      3. 4.4.3. North America Nanomaterials Market, by Type, 2016 – 2026
        1. 4.4.3.1. North America Nanomaterials Market, by Type, 2016 – 2026 (USD Million)
        2. 4.4.3.2. North America Nanomaterials Market, by Type, 2016 – 2026 (Kilo Tons)
      4. 4.4.4. North America Nanomaterials Market, by Application, 2016 – 2026
        1. 4.4.4.1. North America Nanomaterials Market, by Application, 2016 – 2026 (USD Million)
        2. 4.4.4.2. North America Nanomaterials Market, by Application, 2016 – 2026 (Kilo Tons)
      5. 4.4.5. U.S.
        1. 4.4.5.1. U.S. Nanomaterials Market, 2016 – 2026 (USD Million)
        2. 4.4.5.2. U.S. Nanomaterials Market, 2016 – 2026 (Kilo Tons)
      6. 4.4.6. Canada
        1. 4.4.6.1. Canada Nanomaterials Market, 2016 – 2026 (USD Million)
        2. 4.4.6.2. Canada Nanomaterials Market, 2016 – 2026 (Kilo Tons)
    5. 4.5. Europe
      1. 4.5.1. Europe Nanomaterials Market, 2016 – 2026 (USD Million)
        1. 4.5.1.1. Europe Nanomaterials Market, by Country, 2016 – 2026 (USD Million)
      2. 4.5.2. Europe Market, 2016 – 2026 (Kilo Tons)
        1. 4.5.2.1. Europe Nanomaterials Market, by Country, 2016 – 2026 (Kilo Tons)
      3. 4.5.3. Europe Nanomaterials Market, by Type, 2016 – 2026
        1. 4.5.3.1. Europe Nanomaterials Market, by Type, 2016 – 2026 (USD Million)
        2. 4.5.3.2. Europe Nanomaterials Market, by Type, 2016 – 2026 (Kilo Tons)
      4. 4.5.4. Europe Nanomaterials Market, by Application, 2016 – 2026
        1. 4.5.4.1. Europe Nanomaterials Market, by Application, 2016 – 2026 (USD Million)
        2. 4.5.4.2. Europe Nanomaterials Market, by Application, 2016 – 2026 (Kilo Tons)
      5. 4.5.5. Germany
        1. 4.5.5.1. Germany Nanomaterials Market, 2016 – 2026 (USD Million)
        2. 4.5.5.2. Germany Nanomaterials Market, 2016 – 2026 (Kilo Tons)
      6. 4.5.6. France
        1. 4.5.6.1. France Nanomaterials Market, 2016 – 2026 (USD Million)
        2. 4.5.6.2. France Nanomaterials Market, 2016 – 2026 (Kilo Tons)
      7. 4.5.7. U.K.
        1. 4.5.7.1. U.K. Nanomaterials Market, 2016 – 2026 (USD Million)
        2. 4.5.7.2. U.K. Nanomaterials Market, 2016 – 2026 (Kilo Tons)
      8. 4.5.8. Italy
        1. 4.5.8.1. Italy Nanomaterials Market, 2016 – 2026 (USD Million)
        2. 4.5.8.2. Italy Nanomaterials Market, 2016 – 2026 (Kilo Tons)
      9. 4.5.9. Spain
        1. 4.5.9.1. Spain Nanomaterials Market, 2016 – 2026 (USD Million)
        2. 4.5.9.2. Spain Nanomaterials Market, 2016 – 2026 (Kilo Tons)
      10. 4.5.10. Rest of Europe
        1. 4.5.10.1. Rest of Europe Nanomaterials Market, 2016 – 2026 (USD Million)
        2. 4.5.10.2. Rest of Europe Nanomaterials Market, 2016 – 2026 (Kilo Tons)
    6. 4.6. Asia Pacific
      1. 4.6.1. Asia Pacific Nanomaterials Market, 2016 – 2026 (USD Million)
        1. 4.6.1.1. Asia Pacific Nanomaterials Market, by Country, 2016 – 2026 (USD Million)
      2. 4.6.2. Asia Pacific Market, 2016 – 2026 (Kilo Tons)
        1. 4.6.2.1. Asia Pacific Nanomaterials Market, by Country, 2016 – 2026 (Kilo Tons)
      3. 4.6.3. Asia Pacific Nanomaterials Market, by Type, 2016 – 2026
        1. 4.6.3.1. Asia Pacific Nanomaterials Market, by Type, 2016 – 2026 (USD Million)
        2. 4.6.3.2. Asia Pacific Nanomaterials Market, by Type, 2016 – 2026 (Kilo Tons)
      4. 4.6.4. Asia Pacific Nanomaterials Market, by Application, 2016 – 2026
        1. 4.6.4.1. Asia Pacific Nanomaterials Market, by Application, 2016 – 2026 (USD Million)
        2. 4.6.4.2. Asia Pacific Nanomaterials Market, by Application, 2016 – 2026 (Kilo Tons)
      5. 4.6.5. China
        1. 4.6.5.1. China Nanomaterials Market, 2016 – 2026 (USD Million)
        2. 4.6.5.2. China Nanomaterials Market, 2016 – 2026 (Kilo Tons)
      6. 4.6.6. Japan
        1. 4.6.6.1. Japan Nanomaterials Market, 2016 – 2026 (USD Million)
        2. 4.6.6.2. Japan Nanomaterials Market, 2016 – 2026 (Kilo Tons)
      7. 4.6.7. India
        1. 4.6.7.1. India Nanomaterials Market, 2016 – 2026 (USD Million)
        2. 4.6.7.2. India Nanomaterials Market, 2016 – 2026 (Kilo Tons)
      8. 4.6.8. South Korea
        1. 4.6.8.1. South Korea Nanomaterials Market, 2016 – 2026 (USD Million)
        2. 4.6.8.2. South Korea Nanomaterials Market, 2016 – 2026 (Kilo Tons)
      9. 4.6.9. South-East Asia
        1. 4.6.9.1. South-East Asia Nanomaterials Market, 2016 – 2026 (USD Million)
        2. 4.6.9.2. South-East Asia Nanomaterials Market, 2016 – 2026 (Kilo Tons)
      10. 4.6.10. Rest of Asia Pacific
        1. 4.6.10.1. Rest of Asia Pacific Nanomaterials Market, 2016 – 2026 (USD Million)
        2. 4.6.10.2. Rest of Asia Pacific Nanomaterials Market, 2016 – 2026 (Kilo Tons)
    7. 4.7. Latin America
      1. 4.7.1. Latin America Nanomaterials Market, 2016 – 2026 (USD Million)
        1. 4.7.1.1. Latin America Nanomaterials Market, by Country, 2016 – 2026 (USD Million)
      2. 4.7.2. Latin America Market, 2016 – 2026 (Kilo Tons)
        1. 4.7.2.1. Latin America Nanomaterials Market, by Country, 2016 – 2026 (Kilo Tons)
      3. 4.7.3. Latin America Nanomaterials Market, by Type, 2016 – 2026
        1. 4.7.3.1. Latin America Nanomaterials Market, by Type, 2016 – 2026 (USD Million)
        2. 4.7.3.2. Latin America Nanomaterials Market, by Type, 2016 – 2026 (Kilo Tons)
      4. 4.7.4. Latin America Nanomaterials Market, by Application, 2016 – 2026
        1. 4.7.4.1. Latin America Nanomaterials Market, by Application, 2016 – 2026 (USD Million)
        2. 4.7.4.2. Latin America Nanomaterials Market, by Application, 2016 – 2026 (Kilo Tons)
      5. 4.7.5. Brazil
        1. 4.7.5.1. Brazil Nanomaterials Market, 2016 – 2026 (USD Million)
        2. 4.7.5.2. Brazil Nanomaterials Market, 2016 – 2026 (Kilo Tons)
      6. 4.7.6. Mexico
        1. 4.7.6.1. Mexico Nanomaterials Market, 2016 – 2026 (USD Million)
        2. 4.7.6.2. Mexico Nanomaterials Market, 2016 – 2026 (Kilo Tons)
      7. 4.7.7. Rest of Latin America
        1. 4.7.7.1. Rest of Latin America Nanomaterials Market, 2016 – 2026 (USD Million)
        2. 4.7.7.2. Rest of Latin America Nanomaterials Market, 2016 – 2026 (Kilo Tons)
    8. 4.8. The Middle-East and Africa
      1. 4.8.1. The Middle-East and Africa Nanomaterials Market, 2016 – 2026 (USD Million)
        1. 4.8.1.1. The Middle-East and Africa Nanomaterials Market, by Country, 2016 – 2026 (USD Million)
      2. 4.8.2. The Middle-East and Africa Market, 2016 – 2026 (Kilo Tons)
        1. 4.8.2.1. The Middle-East and Africa Nanomaterials Market, by Country, 2016 – 2026 (Kilo Tons)
      3. 4.8.3. The Middle-East and Africa Nanomaterials Market, by Type, 2016 – 2026
        1. 4.8.3.1. The Middle-East and Africa Nanomaterials Market, by Type, 2016 – 2026 (USD Million)
        2. 4.8.3.2. The Middle-East and Africa Nanomaterials Market, by Type, 2016 – 2026 (Kilo Tons)
      4. 4.8.4. The Middle-East and Africa Nanomaterials Market, by Application, 2016 – 2026
        1. 4.8.4.1. The Middle-East and Africa Nanomaterials Market, by Application, 2016 – 2026 (USD Million)
        2. 4.8.4.2. The Middle-East and Africa Nanomaterials Market, by Application, 2016 – 2026 (Kilo Tons)
      5. 4.8.5. GCC Countries
        1. 4.8.5.1. GCC Countries Nanomaterials Market, 2016 – 2026 (USD Million)
        2. 4.8.5.2. GCC Countries Nanomaterials Market, 2016 – 2026 (Kilo Tons)
      6. 4.8.6. South Africa
        1. 4.8.6.1. South Africa Nanomaterials Market, 2016 – 2026 (USD Million)
        2. 4.8.6.2. South Africa Nanomaterials Market, 2016 – 2026 (Kilo Tons)
      7. 4.8.7. Rest of Middle-East Africa
        1. 4.8.7.1. Rest of Middle-East Africa Nanomaterials Market, 2016 – 2026 (USD Million)
        2. 4.8.7.2. Rest of Middle-East Africa Nanomaterials Market, 2016 – 2026 (Kilo Tons)
  5. Chapter 5 Nanomaterials Production, Consumption, Export, Import by Regions
    1. 5.1. Global Nanomaterials Production and Consumption, 2016 – 2026 (Kilo Tons)
    2. 5.2. Global Import and Export Analysis, by Region
  6. Chapter 6 Nanomaterials Market – Competitive Landscape
    1. 6.1. Competitor Market Share – Revenue
    2. 6.2. Market Concentration Rate Analysis, Top 3 and Top 5 Players
    3. 6.3. Competitor Market Share – Volume
    4. 6.4. Strategic Developments
      1. 6.4.1. Acquisitions and Mergers
      2. 6.4.2. New Products
      3. 6.4.3. Research & Development Activities
  7. Chapter 7 Company Profiles
    1. 7.1. Strem Chemicals, Inc.
      1. 7.1.1. Company Overview
      2. 7.1.2. Product/Service Portfolio
      3. 7.1.3. Strem Chemicals, Inc. Sales, Revenue, Price, and Gross Margin
      4. 7.1.4. Strem Chemicals, Inc. Revenue and Growth Rate
      5. 7.1.5. Strem Chemicals, Inc. Market Share
      6. 7.1.6. Recent Initiatives, Funding/VC Activities, and Technological Innovations
    2. 7.2. Nanophase Technologies Corporation
      1. 7.2.1. Company Overview
      2. 7.2.2. Product/Service Portfolio
      3. 7.2.3. Nanophase Technologies Corporation Sales, Revenue, Price, and Gross Margin
      4. 7.2.4. Nanophase Technologies Corporation Revenue and Growth Rate
      5. 7.2.5. Nanophase Technologies Corporation Market Share
      6. 7.2.6. Recent Initiatives, Funding/VC Activities, and Technological Innovations
    3. 7.3. American Elements
      1. 7.3.1. Company Overview
      2. 7.3.2. Product/Service Portfolio
      3. 7.3.3. American Elements Sales, Revenue, Price, and Gross Margin
      4. 7.3.4. American Elements Revenue and Growth Rate
      5. 7.3.5. American Elements Market Share
      6. 7.3.6. Recent Initiatives, Funding/VC Activities, and Technological Innovations
    4. 7.4. Nanostructured & Amorphous Materials, Inc.
      1. 7.4.1. Company Overview
      2. 7.4.2. Product/Service Portfolio
      3. 7.4.3. Nanostructured & Amorphous Materials, Inc. Sales, Revenue, Price, and Gross Margin
      4. 7.4.4. Nanostructured & Amorphous Materials, Inc. Revenue and Growth Rate
      5. 7.4.5. Nanostructured & Amorphous Materials, Inc. Market Share
      6. 7.4.6. Recent Initiatives, Funding/VC Activities, and Technological Innovations
    5. 7.5. US Research Nanomaterials, Inc.
      1. 7.5.1. Company Overview
      2. 7.5.2. Product/Service Portfolio
      3. 7.5.3. US Research Nanomaterials, Inc. Sales, Revenue, Price, and Gross Margin
      4. 7.5.4. US Research Nanomaterials, Inc. Revenue and Growth Rate
      5. 7.5.5. US Research Nanomaterials, Inc. Market Share
      6. 7.5.6. Recent Initiatives, Funding/VC Activities, and Technological Innovations
    6. 7.6. Hyperion Catalysis International Inc.
      1. 7.6.1. Company Overview
      2. 7.6.2. Product/Service Portfolio
      3. 7.6.3. Hyperion Catalysis International Inc. Sales, Revenue, Price, and Gross Margin
      4. 7.6.4. Hyperion Catalysis International Inc. Revenue and Growth Rate
      5. 7.6.5. Hyperion Catalysis International Inc. Market Share
      6. 7.6.6. Recent Initiatives, Funding/VC Activities, and Technological Innovations
    7. 7.7. Nanocomposix, Inc.
      1. 7.7.1. Company Overview
      2. 7.7.2. Product/Service Portfolio
      3. 7.7.3. Nanocomposix, Inc. Sales, Revenue, Price, and Gross Margin
      4. 7.7.4. Nanocomposix, Inc. Revenue and Growth Rate
      5. 7.7.5. Nanocomposix, Inc. Market Share
      6. 7.7.6. Recent Initiatives, Funding/VC Activities, and Technological Innovations
    8. 7.8. Quantum Materials Corp.
      1. 7.8.1. Company Overview
      2. 7.8.2. Product/Service Portfolio
      3. 7.8.3. Quantum Materials Corp. Sales, Revenue, Price, and Gross Margin
      4. 7.8.4. Quantum Materials Corp. Revenue and Growth Rate
      5. 7.8.5. Quantum Materials Corp. Market Share
      6. 7.8.6. Recent Initiatives, Funding/VC Activities, and Technological Innovations
    9. 7.9. Reade International Corporation
      1. 7.9.1. Company Overview
      2. 7.9.2. Product/Service Portfolio
      3. 7.9.3. Reade International Corporation Sales, Revenue, Price, and Gross Margin
      4. 7.9.4. Reade International Corporation Revenue and Growth Rate
      5. 7.9.5. Reade International Corporation Market Share
      6. 7.9.6. Recent Initiatives, Funding/VC Activities, and Technological Innovations
    10. 7.10. SkySpring Nanomaterials, Inc.
      1. 7.10.1. Company Overview
      2. 7.10.2. Product/Service Portfolio
      3. 7.10.3. SkySpring Nanomaterials, Inc. Sales, Revenue, Price, and Gross Margin
      4. 7.10.4. SkySpring Nanomaterials, Inc. Revenue and Growth Rate
      5. 7.10.5. SkySpring Nanomaterials, Inc. Market Share
      6. 7.10.6. Recent Initiatives, Funding/VC Activities, and Technological Innovations
    11. 7.11. Cytodiagnostics, Inc.
      1. 7.11.1. Company Overview
      2. 7.11.2. Product/Service Portfolio
      3. 7.11.3. Cytodiagnostics, Inc. Sales, Revenue, Price, and Gross Margin
      4. 7.11.4. Cytodiagnostics, Inc. Revenue and Growth Rate
      5. 7.11.5. Cytodiagnostics, Inc. Market Share
      6. 7.11.6. Recent Initiatives, Funding/VC Activities, and Technological Innovations
    12. 7.12. NanoMaterials Technology Pte Ltd.
      1. 7.12.1. Company Overview
      2. 7.12.2. Product/Service Portfolio
      3. 7.12.3. NanoMaterials Technology Pte Ltd. Sales, Revenue, Price, and Gross Margin
      4. 7.12.4. NanoMaterials Technology Pte Ltd. Revenue and Growth Rate
      5. 7.12.5. NanoMaterials Technology Pte Ltd. Market Share
      6. 7.12.6. Recent Initiatives, Funding/VC Activities, and Technological Innovations
    13. 7.13. Nanografi Nano Technology
      1. 7.13.1. Company Overview
      2. 7.13.2. Product/Service Portfolio
      3. 7.13.3. Nanografi Nano Technology Sales, Revenue, Price, and Gross Margin
      4. 7.13.4. Nanografi Nano Technology Revenue and Growth Rate
      5. 7.13.5. Nanografi Nano Technology Market Share
      6. 7.13.6. Recent Initiatives, Funding/VC Activities, and Technological Innovations
    14. 7.14. Nanoshel
      1. 7.14.1. Company Overview
      2. 7.14.2. Product/Service Portfolio
      3. 7.14.3. Nanoshel Sales, Revenue, Price, and Gross Margin
      4. 7.14.4. Nanoshel Revenue and Growth Rate
      5. 7.14.5. Nanoshel Market Share
      6. 7.14.6. Recent Initiatives, Funding/VC Activities, and Technological Innovations
    15. 7.15. Frontier Carbon Corporation
      1. 7.15.1. Company Overview
      2. 7.15.2. Product/Service Portfolio
      3. 7.15.3. Frontier Carbon Corporation Sales, Revenue, Price, and Gross Margin
      4. 7.15.4. Frontier Carbon Corporation Revenue and Growth Rate
      5. 7.15.5. Frontier Carbon Corporation Market Share
      6. 7.15.6. Recent Initiatives, Funding/VC Activities, and Technological Innovations
  8. Chapter 8 Nanomaterials — Industry Analysis
    1. 8.1. Introduction and Taxonomy
    2. 8.2. Nanomaterials Market – Key Trends
      1. 8.2.1. Market Drivers
      2. 8.2.2. Market Restraints
      3. 8.2.3. Market Opportunities
    3. 8.3. Value Chain Analysis
    4. 8.4. Key Mandates and Regulations
    5. 8.5. Technology Roadmap and Timeline
    6. 8.6. Nanomaterials Market – Attractiveness Analysis
      1. 8.6.1. By Type
      2. 8.6.2. By Application
      3. 8.6.3. By Region
  9. Chapter 9 Raw Material Analysis
    1. 9.1. Nanomaterials Key Raw Material Analysis
      1. 9.1.1. Key Raw Materials
      2. 9.1.2. Price Trend of Key Raw Materials
    2. 9.2. Key Suppliers of Raw Materials
    3. 9.3. Proportion of Manufacturing Cost Structure
      1. 9.3.1. Raw Materials Cost
      2. 9.3.2. Labor Cost
      3. 9.3.3. Manufacturing Expenses
      4. 9.3.4. Miscellaneous Expenses
    4. 9.4. Manufacturing Cost Analysis of Nanomaterials
  10. Chapter 10 Industrial Chain, Sourcing Strategy, and Downstream Buyers
    1. 10.1. Nanomaterials Industrial Chain Analysis
    2. 10.2. Upstream Raw Materials Sourcing
      1. 10.2.1. Risk Mitigation:
      2. 10.2.2. Supplier Relationships:
      3. 10.2.3. Business Processes:
      4. 10.2.4. Securing the Product:
    3. 10.3. Raw Materials Sources of Nanomaterials Major Manufacturers
    4. 10.4. Downstream Buyers
    5. 10.5. Distributors/Traders List
  11. Chapter 11 Marketing Strategy Analysis, Distributors
    1. 11.1. Marketing Channel
    2. 11.2. Direct Marketing
    3. 11.3. Indirect Marketing
    4. 11.4. Marketing Channel Development Trends
    5. 11.5. Economic/Political Environmental Change
  12. Chapter 12 Report Conclusion & Key Insights
    1. 12.1. Key Insights from Primary Interviews & Surveys Respondents
    2. 12.2. Key Takeaways from Analysts, Consultants, and Industry Leaders
  13. Chapter 13 Research Approach & Methodology
    1. 13.1. Report Description
    2. 13.2. Research Scope
    3. 13.3. Research Methodology
      1. 13.3.1. Secondary Research
      2. 13.3.2. Primary Research
      3. 13.3.3. Statistical Models
        1. 13.3.3.1. Company Share Analysis Model
        2. 13.3.3.2. Revenue Based Modeling
      4. 13.3.4. Research Limitations

  • List of Figures

    Fig.1 Product Picture of Nanomaterials
    Fig.2 Global Nanomaterials Market, 2016 – 2026 (USD Million)
    Fig.3 Global Nanomaterials Market, 2016 – 2026 (Kilo Tons)
    Fig.4 Global Nanomaterials Market Absolute Revenue Opportunity, 2016 – 2026 (USD Million)
    Fig.5 Global Nanomaterials Market Incremental Revenue Opportunity, 2020 – 2026 (USD Million)
    Fig.6 Global Nanomaterials Market Share, by  Type, 2019 & 2026 (USD Million)
    Fig.7 Global Nanomaterials Market Share, by  Type, 2019 & 2026 (Kilo Tons)
    Fig.8 Global Aluminum Oxide Nanoparticles Nanomaterials Market, 2016 – 2026 (USD Million)
    Fig.9 Global Aluminum Oxide Nanoparticles Nanomaterials Market, 2016 – 2026 (Kilo Tons)
    Fig.10 Global Silicon Dioxide Nanomaterials Market, 2016 – 2026 (USD Million)
    Fig.11 Global Silicon Dioxide Nanomaterials Market, 2016 – 2026 (Kilo Tons)
    Fig.12 Global Antimony Tin Oxide Nanoparticles Nanomaterials Market, 2016 – 2026 (USD Million)
    Fig.13 Global Antimony Tin Oxide Nanoparticles Nanomaterials Market, 2016 – 2026 (Kilo Tons)
    Fig.14 Global Titanium Dioxide Nanoparticles Nanomaterials Market, 2016 – 2026 (USD Million)
    Fig.15 Global Titanium Dioxide Nanoparticles Nanomaterials Market, 2016 – 2026 (Kilo Tons)
    Fig.16 Global Bismuth Oxide Nanoparticles Nanomaterials Market, 2016 – 2026 (USD Million)
    Fig.17 Global Bismuth Oxide Nanoparticles Nanomaterials Market, 2016 – 2026 (Kilo Tons)
    Fig.18 Global Graphene Nanomaterials Market, 2016 – 2026 (USD Million)
    Fig.19 Global Graphene Nanomaterials Market, 2016 – 2026 (Kilo Tons)
    Fig.20 Global Copper Oxide Nanoparticles Nanomaterials Market, 2016 – 2026 (USD Million)
    Fig.21 Global Copper Oxide Nanoparticles Nanomaterials Market, 2016 – 2026 (Kilo Tons)
    Fig.22 Global Carbon Nanotubes Nanomaterials Market, 2016 – 2026 (USD Million)
    Fig.23 Global Carbon Nanotubes Nanomaterials Market, 2016 – 2026 (Kilo Tons)
    Fig.24 Global Fullerene Nanomaterials Market, 2016 – 2026 (USD Million)
    Fig.25 Global Fullerene Nanomaterials Market, 2016 – 2026 (Kilo Tons)
    Fig.26 Global  Cerium Oxide Nanoparticles Nanomaterials Market, 2016 – 2026 (USD Million)
    Fig.27 Global  Cerium Oxide Nanoparticles Nanomaterials Market, 2016 – 2026 (Kilo Tons)
    Fig.28 Global Others Nanomaterials Market, 2016 – 2026 (USD Million)
    Fig.29 Global Others Nanomaterials Market, 2016 – 2026 (Kilo Tons)
    Fig.30 Global Nanomaterials Market Share, by Application, 2019 & 2026 (USD Million)
    Fig.31 Global Nanomaterials Market Share, by Application, 2019 & 2026 (Kilo Tons)
    Fig.32 Global Aerospace Nanomaterials Market, 2016 – 2026 (USD Million)
    Fig.33 Global Aerospace Nanomaterials Market, 2016 – 2026 (Kilo Tons)
    Fig.34 Global  Paints & Coatings Nanomaterials Market, 2016 – 2026 (USD Million)
    Fig.35 Global  Paints & Coatings Nanomaterials Market, 2016 – 2026 (Kilo Tons)
    Fig.36 Global  Automotive Nanomaterials Market, 2016 – 2026 (USD Million)
    Fig.37 Global  Automotive Nanomaterials Market, 2016 – 2026 (Kilo Tons)
    Fig.38 Global Electronics Nanomaterials Market, 2016 – 2026 (USD Million)
    Fig.39 Global Electronics Nanomaterials Market, 2016 – 2026 (Kilo Tons)
    Fig.40 Global  Energy & Power Nanomaterials Market, 2016 – 2026 (USD Million)
    Fig.41 Global  Energy & Power Nanomaterials Market, 2016 – 2026 (Kilo Tons)
    Fig.42 Global Medical Nanomaterials Market, 2016 – 2026 (USD Million)
    Fig.43 Global Medical Nanomaterials Market, 2016 – 2026 (Kilo Tons)
    Fig.44 Global Others Nanomaterials Market, 2016 – 2026 (USD Million)
    Fig.45 Global Others Nanomaterials Market, 2016 – 2026 (Kilo Tons)
    Fig.46 Global Nanomaterials Market Share, by Region, 2019 & 2026 (USD Million)
    Fig.47 Global Nanomaterials Market Share, by Region, 2019 & 2026 (Kilo Tons)
    Fig.48 North America Nanomaterials Market, 2016 – 2026 (USD Million)
    Fig.49 North America Nanomaterials Market, 2016 – 2026 (Kilo Tons)
    Fig.50 U.S. Nanomaterials Market, 2016 – 2026 (USD Million)
    Fig.51 U.S. Nanomaterials  Market, 2016 – 2026 (Kilo Tons)
    Fig.52 Canada Nanomaterials Market, 2016 – 2026 (USD Million)
    Fig.53 Canada Nanomaterials  Market, 2016 – 2026 (Kilo Tons)
    Fig.54 Europe Nanomaterials Market, 2016 – 2026 (USD Million)
    Fig.55 Europe Nanomaterials Market, 2016 – 2026 (Kilo Tons)
    Fig.56 Germany Nanomaterials Market, 2016 – 2026 (USD Million)
    Fig.57 Germany Nanomaterials  Market, 2016 – 2026 (Kilo Tons)
    Fig.58 France Nanomaterials Market, 2016 – 2026 (USD Million)
    Fig.59 France Nanomaterials  Market, 2016 – 2026 (Kilo Tons)
    Fig.60 U.K. Nanomaterials Market, 2016 – 2026 (USD Million)
    Fig.61 U.K. Nanomaterials  Market, 2016 – 2026 (Kilo Tons)
    Fig.62 Italy Nanomaterials Market, 2016 – 2026 (USD Million)
    Fig.63 Italy Nanomaterials  Market, 2016 – 2026 (Kilo Tons)
    Fig.64 Spain Nanomaterials Market, 2016 – 2026 (USD Million)
    Fig.65 Spain Nanomaterials  Market, 2016 – 2026 (Kilo Tons)
    Fig.66 Rest of Europe Nanomaterials Market, 2016 – 2026 (USD Million)
    Fig.67 Rest of Europe Nanomaterials  Market, 2016 – 2026 (Kilo Tons)
    Fig.68 Asia Pacific Nanomaterials Market, 2016 – 2026 (USD Million)
    Fig.69 Asia Pacific Nanomaterials Market, 2016 – 2026 (Kilo Tons)
    Fig.70 China Nanomaterials Market, 2016 – 2026 (USD Million)
    Fig.71 China Nanomaterials  Market, 2016 – 2026 (Kilo Tons)
    Fig.72 Japan Nanomaterials Market, 2016 – 2026 (USD Million)
    Fig.73 Japan Nanomaterials  Market, 2016 – 2026 (Kilo Tons)
    Fig.74 India Nanomaterials Market, 2016 – 2026 (USD Million)
    Fig.75 India Nanomaterials  Market, 2016 – 2026 (Kilo Tons)
    Fig.76 South  Korea Nanomaterials Market, 2016 – 2026 (USD Million)
    Fig.77 South  Korea Nanomaterials  Market, 2016 – 2026 (Kilo Tons)
    Fig.78 South-East Asia Nanomaterials Market, 2016 – 2026 (USD Million)
    Fig.79 South-East Asia Nanomaterials  Market, 2016 – 2026 (Kilo Tons)
    Fig.80 Rest of Asia Pacific Nanomaterials Market, 2016 – 2026 (USD Million)
    Fig.81 Rest of Asia Pacific Nanomaterials  Market, 2016 – 2026 (Kilo Tons)
    Fig.82 Latin America Nanomaterials Market, 2016 – 2026 (USD Million)
    Fig.83 Latin America Nanomaterials Market, 2016 – 2026 (Kilo Tons)
    Fig.84 Brazil Nanomaterials Market, 2016 – 2026 (USD Million)
    Fig.85 Brazil Nanomaterials  Market, 2016 – 2026 (Kilo Tons)
    Fig.86 Mexico Nanomaterials Market, 2016 – 2026 (USD Million)
    Fig.87 Mexico Nanomaterials  Market, 2016 – 2026 (Kilo Tons)
    Fig.88 Rest of Latin America Nanomaterials Market, 2016 – 2026 (USD Million)
    Fig.89 Rest of Latin America Nanomaterials  Market, 2016 – 2026 (Kilo Tons)
    Fig.90 The Middle-East and Africa Nanomaterials Market, 2016 – 2026 (USD Million)
    Fig.91 The Middle-East and Africa Nanomaterials Market, 2016 – 2026 (Kilo Tons)
    Fig.92 GCC Countries Nanomaterials Market, 2016 – 2026 (USD Million)
    Fig.93 GCC Countries Nanomaterials  Market, 2016 – 2026 (Kilo Tons)
    Fig.94 South Africa Nanomaterials Market, 2016 – 2026 (USD Million)
    Fig.95 South Africa Nanomaterials  Market, 2016 – 2026 (Kilo Tons)
    Fig.96 Rest of Middle-East Africa Nanomaterials Market, 2016 – 2026 (USD Million)
    Fig.97 Rest of Middle-East Africa Nanomaterials  Market, 2016 – 2026 (Kilo Tons)
    Fig.98 Global Nanomaterials Production and Consumption, 2016 – 2026 (Kilo Tons)
    Fig.99 North America Nanomaterials Production and Consumption, 2016 – 2026 (USD Million) (Kilo Tons)
    Fig.100 Europe Nanomaterials Production and Consumption, 2016 – 2026 (USD Million) (Kilo Tons)
    Fig.101 Asia Pacific Nanomaterials Production and Consumption, 2016 – 2026 (USD Million) (Kilo Tons)
    Fig.102 Latin America Nanomaterials Production and Consumption, 2016 – 2026 (USD Million) (Kilo Tons)
    Fig.103 The Middle-East and Africa Nanomaterials Production and Consumption, 2016 – 2026 (USD Million) (Kilo Tons)
    Fig.104 Competitor Market Share – Revenue
    Fig.105 Competitor Market Share – Volume
    Fig.106 Strem Chemicals, Inc. Revenue and Growth Rate
    Fig.107 Strem Chemicals, Inc. Market Share
    Fig.108 Nanophase Technologies Corporation Revenue and Growth Rate
    Fig.109 Nanophase Technologies Corporation Market Share
    Fig.110 American Elements Revenue and Growth Rate
    Fig.111 American Elements Market Share
    Fig.112 Nanostructured & Amorphous Materials, Inc. Revenue and Growth Rate
    Fig.113 Nanostructured & Amorphous Materials, Inc. Market Share
    Fig.114 US Research Nanomaterials, Inc. Revenue and Growth Rate
    Fig.115 US Research Nanomaterials, Inc. Market Share
    Fig.116 Hyperion Catalysis International Inc. Revenue and Growth Rate
    Fig.117 Hyperion Catalysis International Inc. Market Share
    Fig.118 Nanocomposix, Inc. Revenue and Growth Rate
    Fig.119 Nanocomposix, Inc. Market Share
    Fig.120 Quantum Materials Corp. Revenue and Growth Rate
    Fig.121 Quantum Materials Corp. Market Share
    Fig.122 Reade International Corporation Revenue and Growth Rate
    Fig.123 Reade International Corporation Market Share
    Fig.124 SkySpring Nanomaterials, Inc. Revenue and Growth Rate
    Fig.125 SkySpring Nanomaterials, Inc. Market Share
    Fig.126 Cytodiagnostics, Inc. Revenue and Growth Rate
    Fig.127 Cytodiagnostics, Inc. Market Share
    Fig.128 NanoMaterials Technology Pte Ltd. Revenue and Growth Rate
    Fig.129 NanoMaterials Technology Pte Ltd. Market Share
    Fig.130 Nanografi Nano Technology Revenue and Growth Rate
    Fig.131 Nanografi Nano Technology Market Share
    Fig.132 Nanoshel Revenue and Growth Rate
    Fig.133 Nanoshel Market Share
    Fig.134 Frontier Carbon Corporation Revenue and Growth Rate
    Fig.135 Frontier Carbon Corporation Market Share
    Fig.136 Market Dynamics
    Fig.137 Global Nanomaterials – Value Chain Analysis
    Fig.138 Key Mandates and Regulations
    Fig.139 Technology Roadmap and Timeline
    Fig.140 Market Attractiveness Analysis – By  Type
    Fig.141 Market Attractiveness Analysis – By Application
    Fig.142 Market Attractiveness Analysis – By Region
    Fig.143 Manufacturing Cost Structure of Nanomaterials
    Fig.144 Nanomaterials Industrial Chain Analysis
    Fig.145 Market Channels
    Fig.146 Marketing Channel Development Trend
    Fig.147 Growth in World Gross Product, 2008-2018

    List of Tables

    Table 1 Global Nanomaterials Market, 2019 & 2026 (USD Million)
    Table 2 Global Nanomaterials Market, by  Type, 2016 – 2026 (USD Million)
    Table 3 Global Nanomaterials Market, by  Type, 2016 – 2026 (Kilo Tons)
    Table 4 Global Nanomaterials Market, by Application, 2016 – 2026 (USD Million)
    Table 5 Global Nanomaterials Market, by Application, 2016 – 2026 (Kilo Tons)
    Table 6 Global Nanomaterials Market, by Region, 2016 – 2026 (USD Million)
    Table 7 Global Nanomaterials Market, by Region, 2016 – 2026 (Kilo Tons)
    Table 8 North America Nanomaterials Market, by Country, 2016 – 2026 (USD Million)
    Table 9 North America Nanomaterials Market, by Country, 2016 – 2026 (Kilo Tons)
    Table 10 North America Nanomaterials Market, by  Type, 2016 – 2026 (USD Million)
    Table 11 North America Nanomaterials Market, by  Type, 2016 – 2026 (Kilo Tons)
    Table 12 North America Nanomaterials Market, by Application, 2016 – 2026 (USD Million)
    Table 13 North America Nanomaterials Market, by Application, 2016 – 2026 (Kilo Tons)
    Table 14 Europe Nanomaterials Market, by Country, 2016 – 2026 (USD Million)
    Table 15 Europe Nanomaterials Market, by Country, 2016 – 2026 (Kilo Tons)
    Table 16 Europe Nanomaterials Market, by  Type, 2016 – 2026 (USD Million)
    Table 17 Europe Nanomaterials Market, by  Type, 2016 – 2026 (Kilo Tons)
    Table 18 Europe Nanomaterials Market, by Application, 2016 – 2026 (USD Million)
    Table 19 Europe Nanomaterials Market, by Application, 2016 – 2026 (Kilo Tons)
    Table 20 Asia Pacific Nanomaterials Market, by Country, 2016 – 2026 (USD Million)
    Table 21 Asia Pacific Nanomaterials Market, by Country, 2016 – 2026 (Kilo Tons)
    Table 22 Asia Pacific Nanomaterials Market, by  Type, 2016 – 2026 (USD Million)
    Table 23 Asia Pacific Nanomaterials Market, by  Type, 2016 – 2026 (Kilo Tons)
    Table 24 Asia Pacific Nanomaterials Market, by Application, 2016 – 2026 (USD Million)
    Table 25 Asia Pacific Nanomaterials Market, by Application, 2016 – 2026 (Kilo Tons)
    Table 26 Latin America Nanomaterials Market, by Country, 2016 – 2026 (USD Million)
    Table 27 Latin America Nanomaterials Market, by Country, 2016 – 2026 (Kilo Tons)
    Table 28 Latin America Nanomaterials Market, by  Type, 2016 – 2026 (USD Million)
    Table 29 Latin America Nanomaterials Market, by  Type, 2016 – 2026 (Kilo Tons)
    Table 30 Latin America Nanomaterials Market, by Application, 2016 – 2026 (USD Million)
    Table 31 Latin America Nanomaterials Market, by Application, 2016 – 2026 (Kilo Tons)
    Table 32 The Middle-East and Africa Nanomaterials Market, by Country, 2016 – 2026 (USD Million)
    Table 33 The Middle-East and Africa Nanomaterials Market, by Country, 2016 – 2026 (Kilo Tons)
    Table 34 The Middle-East and Africa Nanomaterials Market, by  Type, 2016 – 2026 (USD Million)
    Table 35 The Middle-East and Africa Nanomaterials Market, by  Type, 2016 – 2026 (Kilo Tons)
    Table 36 The Middle-East and Africa Nanomaterials Market, by Application, 2016 – 2026 (USD Million)
    Table 37 The Middle-East and Africa Nanomaterials Market, by Application, 2016 – 2026 (Kilo Tons)
    Table 38 North America Nanomaterials Production, Consumption, Export, Import, 2016 – 2019
    Table 39 Europe Nanomaterials Production, Consumption, Export, Import, 2016 – 2019
    Table 40 Asia Pacific Nanomaterials Production, Consumption, Export, Import, 2016 – 2019
    Table 41 Latin America Nanomaterials Production, Consumption, Export, Import, 2016 – 2019
    Table 42 The Middle-East and Africa Nanomaterials Production, Consumption, Export, Import, 2016 – 2019
    Table 43 Global Nanomaterials Market - Company Revenue Analysis, 2016 – 2019 (USD Million)
    Table 44 Global Nanomaterials Market - Company Revenue Share Analysis, 2016 – 2019 (%)
    Table 45 Global Nanomaterials Market - Company Volume Analysis, 2016 – 2019 (Kilo Tons)
    Table 46 Global Nanomaterials Market - Company Volume Share Analysis, 2016 – 2019 (%)
    Table 47 Acquisitions and Mergers
    Table 48 Market Drivers – Impact Analysis
    Table 49 Market Restraints
    Table 50 Market Opportunities
    Table 51 Production Base and Market Concentration Rate of Raw Material
    Table 52 Key Suppliers of Raw Materials
    Table 53 Raw Materials Sources of Nanomaterials Major Manufacturers
    Table 54 Major Buyers of Nanomaterials
    Table 55 Distributors/Traders of Nanomaterials by Region
  •  

    Industry Major Market Players

    •  Strem Chemicals Inc.
    •  Nanophase Technologies Corporation
    •  American Elements
    •  Nanostructured & Amorphous Materials Inc.
    •  US Research Nanomaterials Inc.
    •  Hyperion Catalysis International Inc.
    •  Nanocomposix Inc.
    •  Quantum Materials Corp.
    •  Reade International Corporation
    •  SkySpring Nanomaterials Inc.
    •  Cytodiagnostics Inc.
    •  NanoMaterials Technology Pte Ltd.
    •  Nanografi Nano Technology
    •  Nanoshel
    •   Frontier Carbon Corporation