Search Market Research Report

Discover Our Latest Reports
Discover Our Featured Reports
Discover Top Selling Reports

Nanofiber Production Market Size, Share Global Analysis Report, 2019–2026

report img

Nanofiber Production Market By Type (Melt Blown Machine, Electrospinning Equipment, and Others) and By Application (Organic Nanofibers Production and Inorganic Nanofibers Production): Global Industry Perspective, Market Size, Statistical Research, Market Intelligence, Comprehensive Analysis, Historical Trends, and Forecast 2019–2026

Industry Insights

[110+ Pages Report] According to the report published by Facts Factors, the global Nanofiber Production  Market size was worth around USD 1.91 billion in 2022 and is predicted to grow to around USD 3.12 billion by 2030 with a compound annual growth rate (CAGR) of roughly 5.91% between 2023 and 2030. The report analyzes the global nanofiber production market drivers, restraints/challenges, and the effect they have on the demands during the projection period. In addition, the report explores emerging opportunities in the nanofiber production market. 

Nanofiber Production Market Size

To know more about this report | Request Free Sample Copy


logoKey Insights from Primary Research

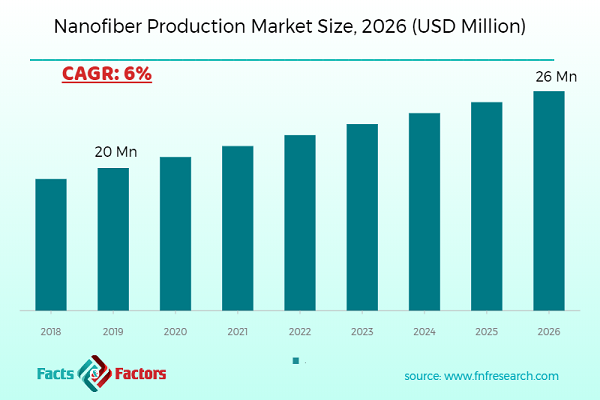
  • As per the analysis shared by our primary respondents, the nanofiber production machines market is expected to grow annually at a rate of around 6%.
  • Through our primary sources, the market value of the nanofiber production machines was around USD 20 million in 2019.
  • The “Electrospinning Equipment” category, on the basis of type segmentation, was the leading revenue generator that accounted for around 73% share, in 2019.
  • The “Organic Nanofibers Production” category, on the basis of application segmentation, was the leading revenue generator that accounted for around 77% share, in 2019.

logoKey Recommendations from Analysts

  • As per our analysis, the demand for nanofiber production machines is growing on a larger scale due to the growing demand of nanofibers that are versatile and can be used in multiple sectors.
  • The growing population with their growing demands for technology and infrastructure helps the market of nanofiber production machines to grow and flourish in the Asian Pacific region.
  • With a growing CAGR of around 6%, the nanofiber production machines market gives good opportunities for all people who are planning to invest in this market.
  • With the growing demand for these nanofiber production machines, there is a continuous advancement in the technology making it much easier for the production of nanofibers.
  • The segments of “Electrospinning Equipment” and “Organic nanofibers production” are considered to be leading, and can prove to be a good option for investments.

logoMarket Attractiveness – By Region

Nanofiber-Production-Market

To know more about this report | Request Free Sample Copy


We have included various industry analysis models in our report and extensively demonstrated the key business strategies and competitive landscape of the Nanofiber Production Market in our study.

Our study also includes an analysis of Porter’s Five Forces framework for understanding the competitive strategies adopted by various stakeholders involved in the entire value chain of the Nanofiber Production Market. It also encompasses PESTLE analysis and SWOT analysis.

The report also offers an in-depth analysis of the market shares of each industry player and gives an outline of the market position of key players in the Nanofiber Production Market. Moreover, the study offers wide coverage of key strategic advances witnessed in the market such as new product launches, acquisitions & mergers, collaborations & joint ventures, funding & VC activities, agreements, partnerships, R&D activities, and regional expansion of key players of the Nanofiber Production Market.

The research study provides a critical assessment of the Nanofiber Production Market by logically segmenting the market on the basis of Type, Application, and region. Based on the past, present, and future trends, all the segments were analyzed from the bottom up, and the market sizes have been estimated from 2020 to 2026. The regional segmentation of the Nanofiber Production Market includes the holistic bifurcation of all five major continents including North America, Europe, Asia Pacific, Latin America, and the Middle East & Africa.

Nanofiber technology is famous for its versatile properties of strength, flexibility, and durability. Hence, the nanofiber production machines market is in huge demand to fulfill the demand for these smart fibers. Out of the various types of production machines, the electrospinning equipment is expected to provide the maximum share for its high productivity with fewer errors, as compared with the other types available in the market. Organic nanofibers production is expected to be high in demand as compared with inorganic nanofibers production due to its low cost and low consumption of power. The market of nanofiber production machines is expected to get a boost in the Asian-Pacific region due to the growing industries in this region.

The Nanofiber Production Market is segmented based on Type and Application. On the basis of type segmentation, the market is classified into Melt Blown Machines, Electrospinning Equipment, and Others. In terms of Application segmentation, the market is classified into Organic Nanofibers Production and Inorganic Nanofibers Production.

logoReport Scope

Report Attribute

Details

Market Size in 2019

USD 20 Million

Projected Market Size in 2026

USD 26 Million

CAGR Growth Rate

6% CAGR

Base Year

2020

Forecast Years

2020-2026

Key Market Players

Contipro, Elmarco ,Nabond Technologies Co. Ltd, Nanoflux Pte. Ltd, Tong Li Tech Co. Ltd, Inovenso, Kato Tech Co. Ltd, M-TechXInc

Key Segment

By Type, By Applications, and By Region

Major Regions Covered

North America, Europe, Asia Pacific, Latin America, and the Middle East & Africa

Purchase Options

Request customized purchase options to meet your research needs. Explore purchase options

logoSome of the essential players operating in the Nanofiber Production Market are as follows:

  • Contipro
  • Elmarco
  • Nabond Technologies Co. Ltd
  • Nanoflux Pte. Ltd
  • Tong Li Tech Co. Ltd
  • Inovenso
  • Kato Tech Co. Ltd
  • M-TechXInc

The taxonomy of the nanofiber Production Market by its scope and segmentation is as follows:

logo By Type Segmentation Analysis

  • Melt Blown Machine
  • Electrospinning Equipment
  • Others

logo By Application Segmentation Analysis

  • Organic Nanofibers Production
  • Inorganic Nanofibers Production

logo Regional Segmentation Analysis

  • North America
    • The U.S.
    • Canada
  • Europe
    • Germany
    • France
    • UK
    • Italy
    • Spain
    • Rest Of Europe
  • Asia Pacific
    • China
    • Japan
    • India
    • South Korea
    • Southeast Asia
    • Rest of Asia Pacific
  • Latin America
    • Brazil
    • Mexico
    • Rest of Latin America
  • The Middle East & Africa
    • GCC Countries
    • South Africa

Rest of the Middle East & Africa

logoKEY BUSINESS POINTERS ADDRESSED & FOREMOST REASONS TO PROCURE THE REPORT:

  • Statistical Analysis of the Past, Current, and Future Trends of the Industry with Validated Market Sizes Data
  • Direct and Indirect Rationales Impacting the Industry
  • In-depth and Micro Analysis of Viable Segments and Sub-segments
  • Companies and Vendors Market Share, Competitive Landscape, and Player Positioning Analysis
  • Demand Side (Consumption) and Supply Side (Production) Perspective and Analysis wherever applicable
  • Key Buyers and End-Users Analysis
  • Value Chain and Manufacturing Cost Structure Analysis wherever relevant
  • Key Marketing Strategies as well as Key Sales Channels adopted in the market
  • Investment Opportunity Analysis & Patents Analysis wherever feasible
  • Technological Road Map & Technical Analysis
  • Robust Research Methodology comprising a dynamic mix (65%~35%) of Extensive Primary Research (primary interviews, ad-hoc surveys, questionnaires) and Protracted Secondary Research (proprietary in-house database, paid external databases, publically available validated sources)

Table of Content

  1. CHAPTER 1. Executive Summary
  2. CHAPTER 2. Nanofiber Production Machines Market – Type Analysis
    1. 2.1. Global Nanofiber Production Machines Market Share, by Type, 2015-2025 (USD Million)
    2. 2.2. Global Nanofiber Production Machines Market share, by Type, 2015-2025 (K Units)
    3. 2.3. Melt Blown Machine
      1. 2.3.1. Global Melt Blown Machine Market, 2015-2025 (USD Million)
      2. 2.3.2. Global Melt Blown Machine Market, 2015-2025 (K Units)
    4. 2.4. Electrospinning Equipment
      1. 2.4.1. Global Electrospinning Equipment Market, 2015-2025 (USD Million)
      2. 2.4.2. Global Electrospinning Equipment Market, 2015-2025 (K Units)
    5. 2.5. Others
      1. 2.5.1. Global Other Nanofiber Production Machines Market, 2015-2025 (USD Million)
      2. 2.5.2. Global Other Nanofiber Production Machines Market, 2015-2025 (K Units)
  3. CHAPTER 3. Nanofiber Production Machines Market – Application Analysis
    1. 3.1. Global Nanofiber Production Machines Market Share, by Application, 2015-2025 (USD Million)
    2. 3.2. Global Nanofiber Production Machines Market share, by Application, 2015-2025 (K Units)
    3. 3.3. Organic Nanofibers Production
      1. 3.3.1. Global Nanofiber Production Machines Market for Organic Nanofibers Production, 2015-2025 (USD Million)
      2. 3.3.2. Global Nanofiber Production Machines Market for Organic Nanofibers Production, 2015-2025 (K Units)
    4. 3.4. Inorganic Nanofibers Production
      1. 3.4.1. Global Nanofiber Production Machines Market for Inorganic Nanofibers Production, 2015-2025 (USD Million)
      2. 3.4.2. Global Nanofiber Production Machines Market for Inorganic Nanofibers Production, 2015-2025 (K Units)
  4. CHAPTER 4. Nanofiber Production Machines Market – Regional Analysis
    1. 4.1. Global Nanofiber Production Machines Market Share, by Region, 2015-2025 (Value)
    2. 4.2. Global Nanofiber Production Machines Market Share, by Region, 2015-2025 (Volume)
    3. 4.3. North America
      1. 4.3.1. North America Nanofiber Production Machines Market Size and Forecast, 2015-2025
      2. 4.3.2. North America Nanofiber Production Machines Market, by Country, 2015-2025 (USD Million)
      3. 4.3.3. North America Market Size and Forecast, 2015-2025 (K Units)
      4. 4.3.4. North America Nanofiber Production Machines Market, by Country, 2015-2025 (K Units)
      5. 4.3.5. North America Nanofiber Production Machines Market, by Type, 2015-2025
        1. 4.3.5.1. North America Nanofiber Production Machines Market, by Type, 2015-2025 (USD Million)
        2. 4.3.5.2. North America Nanofiber Production Machines Market, by Type, 2015-2025 (K Units)
      6. 4.3.6. North America Nanofiber Production Machines Market, by Application, 2015-2025
        1. 4.3.6.1. North America Nanofiber Production Machines Market, by Application, 2015-2025 (USD Million)
        2. 4.3.6.2. North America Nanofiber Production Machines Market, by Application, 2015-2025 (K Units)
      7. 4.3.7. U.S.
        1. 4.3.7.1. U.S. Market Size and Forecast, 2015-2025 (USD Million)
        2. 4.3.7.2. U.S. Market Size and Forecast, 2015-2025 (K Units)
      8. 4.3.8. Canada
        1. 4.3.8.1. Canada Market Size and Forecast, 2015-2025 (USD Million)
        2. 4.3.8.2. Canada Market Size and Forecast, 2015-2025 (K Units)
    4. 4.4. Europe
      1. 4.4.1. Europe Nanofiber Production Machines Market Size and Forecast, 2015-2025
      2. 4.4.2. Europe Nanofiber Production Machines Market, by Country, 2015-2025 (USD Million)
      3. 4.4.3. Europe Market Size and Forecast, 2015-2025 (K Units)
      4. 4.4.4. Europe Nanofiber Production Machines Market, by Country, 2015-2025 (K Units)
      5. 4.4.5. Europe Nanofiber Production Machines Market, by Type, 2015-2025
        1. 4.4.5.1. Europe Nanofiber Production Machines Market, by Type, 2015-2025 (USD Million)
        2. 4.4.5.2. Europe Nanofiber Production Machines Market, by Type, 2015-2025 (K Units)
      6. 4.4.6. Europe Nanofiber Production Machines Market, by Application, 2015-2025
        1. 4.4.6.1. Europe Nanofiber Production Machines Market, by Application, 2015-2025 (USD Million)
        2. 4.4.6.2. Europe Nanofiber Production Machines Market, by Application, 2015-2025 (K Units)
      7. 4.4.7. Germany
        1. 4.4.7.1. Germany Market Size and Forecast, 2015-2025 (USD Million)
        2. 4.4.7.2. Germany Market Size and Forecast, 2015-2025 (K Units)
      8. 4.4.8. France
        1. 4.4.8.1. France Market Size and Forecast, 2015-2025 (USD Million)
        2. 4.4.8.2. France Market Size and Forecast, 2015-2025 (K Units)
      9. 4.4.9. UK
        1. 4.4.9.1. UK Market Size and Forecast, 2015-2025 (USD Million)
        2. 4.4.9.2. UK Market Size and Forecast, 2015-2025 (K Units)
      10. 4.4.10. Italy
        1. 4.4.10.1. Italy Market Size and Forecast, 2015-2025 (USD Million)
        2. 4.4.10.2. Italy Market Size and Forecast, 2015-2025 (K Units)
      11. 4.4.11. Spain
        1. 4.4.11.1. Spain Market Size and Forecast, 2015-2025 (USD Million)
        2. 4.4.11.2. Spain Market Size and Forecast, 2015-2025 (K Units)
      12. 4.4.12. Rest of Europe
        1. 4.4.12.1. Rest of Europe Market Size and Forecast, 2015-2025 (USD Million)
        2. 4.4.12.2. Rest of Europe Market Size and Forecast, 2015-2025 (K Units)
    5. 4.5. Asia Pacific
      1. 4.5.1. Asia Pacific Nanofiber Production Machines Market Size and Forecast, 2015-2025
      2. 4.5.2. Asia Pacific Nanofiber Production Machines Market, by Country, 2015-2025 (USD Million)
      3. 4.5.3. Asia Pacific Market Size and Forecast, 2015-2025 (K Units)
      4. 4.5.4. Asia Pacific Nanofiber Production Machines Market, by Country, 2015-2025 (K Units)
      5. 4.5.5. Asia Pacific Nanofiber Production Machines Market, by Type, 2015-2025
        1. 4.5.5.1. Asia Pacific Nanofiber Production Machines Market, by Type, 2015-2025 (USD Million)
        2. 4.5.5.2. Asia Pacific Nanofiber Production Machines Market, by Type, 2015-2025 (K Units)
      6. 4.5.6. Asia Pacific Nanofiber Production Machines Market, by Application, 2015-2025
        1. 4.5.6.1. Asia Pacific Nanofiber Production Machines Market, by Application, 2015-2025 (USD Million)
        2. 4.5.6.2. Asia Pacific Nanofiber Production Machines Market, by Application, 2015-2025 (K Units)
      7. 4.5.7. China
        1. 4.5.7.1. China Market Size and Forecast, 2015-2025 (USD Million)
        2. 4.5.7.2. China Market Size and Forecast, 2015-2025 (K Units)
      8. 4.5.8. Japan
        1. 4.5.8.1. Japan Market Size and Forecast, 2015-2025 (USD Million)
        2. 4.5.8.2. Japan Market Size and Forecast, 2015-2025 (K Units)
      9. 4.5.9. India
        1. 4.5.9.1. India Market Size and Forecast, 2015-2025 (USD Million)
        2. 4.5.9.2. India Market Size and Forecast, 2015-2025 (K Units)
      10. 4.5.10. South Korea
        1. 4.5.10.1. South Korea Market Size and Forecast, 2015-2025 (USD Million)
        2. 4.5.10.2. South Korea Market Size and Forecast, 2015-2025 (K Units)
      11. 4.5.11. Southeast Asia
        1. 4.5.11.1. Southeast Asia Market Size and Forecast, 2015-2025 (USD Million)
        2. 4.5.11.2. Southeast Asia Market Size and Forecast, 2015-2025 (K Units)
      12. 4.5.12. Rest of Asia Pacific
        1. 4.5.12.1. Rest of Asia Pacific Market Size and Forecast, 2015-2025 (USD Million)
        2. 4.5.12.2. Rest of Asia Pacific Market Size and Forecast, 2015-2025 (K Units)
    6. 4.6. Latin America
      1. 4.6.1. Latin America Nanofiber Production Machines Market Size and Forecast, 2015-2025
      2. 4.6.2. Latin America Nanofiber Production Machines Market, by Country, 2015-2025 (USD Million)
      3. 4.6.3. Latin America Market Size and Forecast, 2015-2025 (K Units)
      4. 4.6.4. Latin America Nanofiber Production Machines Market, by Country, 2015-2025 (K Units)
      5. 4.6.5. Latin America Nanofiber Production Machines Market, by Type, 2015-2025
        1. 4.6.5.1. Latin America Nanofiber Production Machines Market, by Type, 2015-2025 (USD Million)
        2. 4.6.5.2. Latin America Nanofiber Production Machines Market, by Type, 2015-2025 (K Units)
      6. 4.6.6. Latin America Nanofiber Production Machines Market, by Application, 2015-2025
        1. 4.6.6.1. Latin America Nanofiber Production Machines Market, by Application, 2015-2025 (USD Million)
        2. 4.6.6.2. Latin America Nanofiber Production Machines Market, by Application, 2015-2025 (K Units)
      7. 4.6.7. Brazil
        1. 4.6.7.1. Brazil Market Size and Forecast, 2015-2025 (USD Million)
        2. 4.6.7.2. Brazil Market Size and Forecast, 2015-2025 (K Units)
      8. 4.6.8. Mexico
        1. 4.6.8.1. Mexico Market Size and Forecast, 2015-2025 (USD Million)
        2. 4.6.8.2. Mexico Market Size and Forecast, 2015-2025 (K Units)
      9. 4.6.9. Rest of Latin America
        1. 4.6.9.1. Rest of Latin America Market Size and Forecast, 2015-2025 (USD Million)
        2. 4.6.9.2. Rest of Latin America Market Size and Forecast, 2015-2025 (K Units)
    7. 4.7. The Middle East Africa
      1. 4.7.1. The Middle East & Africa Nanofiber Production Machines Market Size and Forecast, 2015-2025
      2. 4.7.2. The Middle East & Africa Nanofiber Production Machines Market, by Country, 2015-2025 (USD Million)
      3. 4.7.3. The Middle East & Africa Market Size and Forecast, 2015-2025 (K Units)
      4. 4.7.4. The Middle East & Africa Nanofiber Production Machines Market, by Country, 2015-2025 (K Units)
      5. 4.7.5. The Middle East & Africa Nanofiber Production Machines Market, by Type, 2015-2025
        1. 4.7.5.1. The Middle East & Africa Nanofiber Production Machines Market, by Type, 2015-2025 (USD Million)
        2. 4.7.5.2. The Middle East & Africa Nanofiber Production Machines Market, by Type, 2015-2025 (K Units)
      6. 4.7.6. The Middle East & Africa Nanofiber Production Machines Market, by Application, 2015-2025
        1. 4.7.6.1. The Middle East & Africa Nanofiber Production Machines Market, by Application, 2015-2025 (USD Million)
        2. 4.7.6.2. The Middle East & Africa Nanofiber Production Machines Market, by Application, 2015-2025 (K Units)
      7. 4.7.7. GCC Countries
        1. 4.7.7.1. GCC Countries Market Size and Forecast, 2015-2025 (USD Million)
        2. 4.7.7.2. GCC Countries Market Size and Forecast, 2015-2025 (K Units)
      8. 4.7.8. South Africa
        1. 4.7.8.1. South Africa Market Size and Forecast, 2015-2025 (USD Million)
        2. 4.7.8.2. South Africa Market Size and Forecast, 2015-2025 (K Units)
      9. 4.7.9. Rest of The Middle East & Africa
        1. 4.7.9.1. Rest of The Middle East & Africa Market Size and Forecast, 2015-2025 (USD Million)
        2. 4.7.9.2. Rest of Asia Pacific Market Size and Forecast, 2015-2025 (K Units)
  5. CHAPTER 5. Nanofiber Production Machines Market – Competitive Landscape
    1. 5.1. Competitor Market Share – Revenue
    2. 5.2. Competitor Market Share – Volume
  6. CHAPTER 6. Company Profiles
    1. 6.1. Contipro
      1. 6.1.1. Company Overview
      2. 6.1.2. Contipro Sales, Revenue, Price, and Gross Margin
      3. 6.1.3. Product portfolio
    2. 6.2. Elmarco
      1. 6.2.1. Company Overview
      2. 6.2.2. Elmarco Sales, Revenue, and Gross Margin
      3. 6.2.3. Product portfolio
      4. 6.2.4. Recent initiatives
    3. 6.3. Nabond Technologies Co. Ltd
      1. 6.3.1. Company Overview
      2. 6.3.2. Nabond Technologies Co. Ltd Sales, Revenue, Price, and Gross Margin
      3. 6.3.3. Product portfolio
    4. 6.4. Nanoflux Pte. Ltd.
      1. 6.4.1. Company Overview
      2. 6.4.2. Nanoflux Pte. Ltd. Sales, Revenue, Price, and Gross Margin
      3. 6.4.3. Product portfolio
    5. 6.5. TONG LI TECH CO. LTD
      1. 6.5.1. Company Overview
      2. 6.5.2. TONG LI TECH CO. LTD Sales, Revenue, Price, and Gross Margin
      3. 6.5.3. Product portfolio
    6. 6.6. Inovenso
      1. 6.6.1. Company Overview
      2. 6.6.2. Inovenso Sales, Revenue, Price, and Gross Margin
      3. 6.6.3. Product portfolio
    7. 6.7. Kato Tech Co. Ltd
      1. 6.7.1. Company Overview
      2. 6.7.2. Product portfolio
    8. 6.8. M-TEchX Inc.
      1. 6.8.1. Company Overview
      2. 6.8.2. Product portfolio
  7. CHAPTER 7. Nanofiber Production Machines — Industry Analysis
    1. 7.1. Introduction and taxonomy
    2. 7.2. Nanofiber Production Machines Market – Key Trends
      1. 7.2.1. Market Drivers
      2. 7.2.2. Market Restraints
      3. 7.2.3. Market Opportunities
    3. 7.3. Value Chain Analysis
    4. 7.4. Key Mandates and Regulations
    5. 7.5. Technology Roadmap and Timeline
    6. 7.6. Nanofiber Production Machines market – Attractiveness Analysis
      1. 7.6.1. By Type
      2. 7.6.2. By Application
      3. 7.6.3. By Region
  8. CHAPTER 8. Raw Material analysis
    1. 8.1. Nanofiber Production Machines Key Raw Material Analysis
      1. 8.1.1. Key Raw Materials
    2. 8.2. Key Suppliers of Raw Materials
    3. 8.3. Proportion of Manufacturing Cost Structure
      1. 8.3.1. Raw Material
      2. 8.3.2. Labor Cost
    4. 8.4. Manufacturing Expenses Analysis of Nanofiber Production Machines
  9. CHAPTER 9. Industrial Chain, Sourcing Strategy, and Downstream Buyers
    1. 9.1. Nanofiber Production Machines Industrial Chain Analysis
    2. 9.2. Upstream Raw Materials Sourcing
      1. 9.2.1. Risk Mitigation:
      2. 9.2.2. Supplier Relationships:
      3. 9.2.3. Business Processes:
      4. 9.2.4. Securing the Product:
    3. 9.3. Raw Materials Sources of Nanofiber Production Machines Major Manufacturers in 2016
    4. 9.4. Downstream Buyers
    5. 9.5. Distributors/Traders List
  10. CHAPTER 10. Marketing Strategy Analysis, Distributors
    1. 10.1. Marketing Channel
    2. 10.2. Direct Marketing
    3. 10.3. Indirect Marketing
    4. 10.4. Marketing Channel Development Trend
    5. 10.5. Economic/Political Environmental Change
  11. CHAPTER 11. Report Conclusion
  12. CHAPTER 12. Research Approach & Methodology
    1. 12.1. Report Description
    2. 12.2. Research Scope
    3. 12.3. Research Methodology
      1. 12.3.1. Secondary Research
      2. 12.3.2. Primary Research
      3. 12.3.3. Models
        1. 12.3.3.1. Company Share Analysis Model
        2. 12.3.3.2. Revenue Based Modeling
        3. 12.3.3.3. Research Limitations

  • List of Figures

    FIG. 1    Global Nanofiber Production Machines Market, 2015-2025 (USD Million)
    FIG. 2    Global Melt Blown Machine Market, 2015-2025 (USD Million)
    FIG. 3    Global Melt Blown Machine Market, 2015-2025 (K Units)
    FIG. 4    Global Electrospinning Equipment Market, 2015-2025 (USD Million)
    FIG. 5    Global Electrospinning Equipment   Market, 2015-2025 (K Units)
    FIG. 6    Global Other Nanofiber Production Machines Market, 2015-2025 (USD Million)
    FIG. 7    Global Other Nanofiber Production Machines Market, 2015-2025 (K Units)
    FIG. 8    Global Nanofiber Production Machines Market for Organic Nanofibers Production, 2015-2025 (USD Million)
    FIG. 9    Global Nanofiber Production Machines Market for Organic Nanofibers Production, 2015-2025 (K Units)
    FIG. 10    Global Nanofiber Production Machines Market for Inorganic Nanofibers Production, 2015-2025 (USD Million)
    FIG. 11    Global Nanofiber Production Machines Market for Inorganic Nanofibers Production, 2015-2025 (K Units)
    FIG. 12    North America Nanofiber Production Machines Market, 2015-2025
    FIG. 13    North America Nanofiber Production Machines Market, 2015-2025 (K Units)
    FIG. 14    U.S. Nanofiber Production Machines Market, 2015-2025
    FIG. 15    U.S. Nanofiber Production Machines   Market, 2015-2025 (K Units)
    FIG. 16    Canada Nanofiber Production Machines Market, 2015-2025
    FIG. 17    Canada Nanofiber Production Machines   Market, 2015-2025 (K Units)
    FIG. 18    Europe Nanofiber Production Machines Market, 2015-2025
    FIG. 19    Europe Nanofiber Production Machines Market, 2015-2025 (K Units)
    FIG. 20    Germany Nanofiber Production Machines Market, 2015-2025
    FIG. 21    Germany Nanofiber Production Machines   Market, 2015-2025 (K Units)
    FIG. 22    France Nanofiber Production Machines Market, 2015-2025
    FIG. 23    France Nanofiber Production Machines   Market, 2015-2025 (K Units)
    FIG. 24    UK Nanofiber Production Machines Market, 2015-2025
    FIG. 25    UK Nanofiber Production Machines   Market, 2015-2025 (K Units)
    FIG. 26    Italy Nanofiber Production Machines Market, 2015-2025
    FIG. 27    Italy Nanofiber Production Machines   Market, 2015-2025 (K Units)
    FIG. 28    Spain Nanofiber Production Machines Market, 2015-2025
    FIG. 29    Spain Nanofiber Production Machines   Market, 2015-2025 (K Units)
    FIG. 30    Rest of Europe Nanofiber Production Machines Market, 2015-2025
    FIG. 31    Rest of Europe Nanofiber Production Machines Market, 2015-2025 (K Units)
    FIG. 32    Asia Pacific Nanofiber Production Machines Market, 2015-2025
    FIG. 33    Asia Pacific Nanofiber Production Machines Market, 2015-2025 (K Units)
    FIG. 34    China Nanofiber Production Machines Market, 2015-2025
    FIG. 35    China Nanofiber Production Machines   Market, 2015-2025 (K Units)
    FIG. 36    Japan Nanofiber Production Machines Market, 2015-2025
    FIG. 37    Japan Nanofiber Production Machines   Market, 2015-2025 (K Units)
    FIG. 38    India Nanofiber Production Machines Market, 2015-2025
    FIG. 39    India Nanofiber Production Machines   Market, 2015-2025 (K Units)
    FIG. 40    South Korea Nanofiber Production Machines Market, 2015-2025
    FIG. 41    South Korea Nanofiber Production Machines Market, 2015-2025 (K Units)
    FIG. 42    Southeast Asia Nanofiber Production Machines Market, 2015-2025
    FIG. 43    Southeast Asia Nanofiber Production Machines   Market, 2015-2025 (K Units)
    FIG. 44    Rest of Asia Pacific Nanofiber Production Machines Market, 2015-2025
    FIG. 45    Rest of Asia Pacific Nanofiber Production Machines Market, 2015-2025 (K Units)
    FIG. 46    Latin America Nanofiber Production Machines Market, 2015-2025
    FIG. 47    Latin America Nanofiber Production Machines Market, 2015-2025 (K Units)
    FIG. 48    Brazil Nanofiber Production Machines Market, 2015-2025
    FIG. 49    Brazil Nanofiber Production Machines   Market, 2015-2025 (K Units)
    FIG. 50    Mexico Nanofiber Production Machines Market, 2015-2025
    FIG. 51    Mexico Nanofiber Production Machines   Market, 2015-2025 (K Units)
    FIG. 52    Rest of Latin America Nanofiber Production Machines Market, 2015-2025
    FIG. 53    Rest of Latin America Nanofiber Production Machines Market, 2015-2025 (K Units)
    FIG. 54    The Middle East & Africa Nanofiber Production Machines Market, 2015-2025
    FIG. 55    The Middle East & Africa Nanofiber Production Machines Market, 2015-2025 (K Units)
    FIG. 56    GCC Countries Nanofiber Production Machines Market, 2015-2025
    FIG. 57    GCC Countries Nanofiber Production Machines   Market, 2015-2025 (K Units)
    FIG. 58    South Africa Nanofiber Production Machines Market, 2015-2025
    FIG. 59    South Africa Nanofiber Production Machines   Market, 2015-2025 (K Units)
    FIG. 60    Rest of The Middle East & Africa Nanofiber Production Machines Market, 2015-2025
    FIG. 61    Rest of The Middle East & Africa Nanofiber Production Machines Market, 2015-2025 (K Units)
    FIG. 62    Competitor Market Share – Revenue
    FIG. 63    Competitor Market Share – Volume
    FIG. 64    Contipro Revenue and Growth Rate
    FIG. 65    Contipro Market Share
    FIG. 66    Elmarco Revenue and Growth Rate
    FIG. 67    Elmarco Market Share
    FIG. 68    Nabond Technologies Co. Ltd Revenue and Growth Rate
    FIG. 69    Nabond Technologies Co. Ltd Market Share
    FIG. 70    Nanoflux Pte. Ltd. Revenue and Growth Rate
    FIG. 71    Nanoflux Pte. Ltd. Market Share
    FIG. 72    TONG LI TECH CO. LTD Revenue and Growth Rate
    FIG. 73    TONG LI TECH CO. LTD Market Share
    FIG. 74    Inovenso Revenue and Growth Rate
    FIG. 75    Inovenso Market Share
    FIG. 76    Market Dynamics
    FIG. 77    Global Nanofiber Production Machines  – Value Chain Analysis
    FIG. 78    Key Mandates and Regulations
    FIG. 79    Technology Roadmap and Timeline
    FIG. 80    Market Attractiveness Analysis – By Type
    FIG. 81    Market Attractiveness Analysis – By Application
    FIG. 82    Market Attractiveness Analysis – By Region
    FIG. 83    Manufacturing Cost Structure of Nanofiber Production Machines
    FIG. 84    Nanofiber Production Machines Industrial Chain Analysis
    FIG. 85    Market Channel


    List of Tables

    TABLE 1    Global Nanofiber Production Machines Market, 2015-2025 (USD Million)
    TABLE 2    Global Nanofiber Production Machines Market, by Type, 2015-2025 (USD Million)
    TABLE 3    Global Nanofiber Production Machines Market, by Type, 2015-2025 (K Units)
    TABLE 4    Global Nanofiber Production Machines Market, by Application, 2015-2025 (USD Million)
    TABLE 5    Global Nanofiber Production Machines Market, by Application, 2015-2025 (K Units)
    TABLE 6    Global Nanofiber Production Machines Market, by Region, 2015-2025 (USD Million)
    TABLE 7    Global Nanofiber Production Machines Market, by Region, 2015-2025 (K Units)
    TABLE 8    North America Nanofiber Production Machines Market, by Type, 2015-2025 (USD Million)
    TABLE 9    North America Nanofiber Production Machines Market, by Type, 2015-2025 (K Units)
    TABLE 10    North America Nanofiber Production Machines Market, by Application, 2015-2025 (USD Million)
    TABLE 11    North America Nanofiber Production Machines Market, by Application, 2015-2025 (K Units)
    TABLE 12    Europe Nanofiber Production Machines Market, by Type, 2015-2025 (USD Million)
    TABLE 13    Europe Nanofiber Production Machines Market, by Type, 2015-2025 (K Units)
    TABLE 14    Europe Nanofiber Production Machines Market, by Application, 2015-2025 (USD Million)
    TABLE 15    Europe Nanofiber Production Machines Market, by Application, 2015-2025 (K Units)
    TABLE 16    Asia Pacific Nanofiber Production Machines Market, by Type, 2015-2025 (USD Million)
    TABLE 17    Asia Pacific Nanofiber Production Machines Market, by Type, 2015-2025 (K Units)
    TABLE 18    Asia Pacific Nanofiber Production Machines Market, by Application, 2015-2025 (USD Million)
    TABLE 19    Asia Pacific Nanofiber Production Machines Market, by Application, 2015-2025 (K Units)
    TABLE 20    Latin America Nanofiber Production Machines Market, by Type, 2015-2025 (USD Million)
    TABLE 21    Latin America Nanofiber Production Machines Market, by Type, 2015-2025 (K Units)
    TABLE 22    Latin America Nanofiber Production Machines Market, by Application, 2015-2025 (USD Million)
    TABLE 23    Latin America Nanofiber Production Machines Market, by Application, 2015-2025 (K Units)
    TABLE 24    The Middle East & Africa Nanofiber Production Machines Market, by Type, 2015-2025 (USD Million)
    TABLE 25    The Middle East & Africa Nanofiber Production Machines Market, by Type, 2015-2025 (K Units)
    TABLE 26    The Middle East & Africa Nanofiber Production Machines Market, by Application, 2015-2025 (USD Million)
    TABLE 27    The Middle East & Africa Nanofiber Production Machines Market, by Application, 2015-2025 (K Units)
    TABLE 28    Global Nanofiber Production Machines Market - Company Revenue Analysis 2015-2018 (USD Million)
    TABLE 29    Global Nanofiber Production Machines Market - Company Revenue Share Analysis 2015-2018 (%)
    TABLE 30    Global Nanofiber Production Machines Market - Company Volume Analysis 2015-2018 (USD Million)
    TABLE 31    Global Nanofiber Production Machines Market - Company Volume Share Analysis 2015-2018(%)
    TABLE 32    Market Drivers
    TABLE 33    Market Restraints
    TABLE 34    Market Opportunities
    TABLE 35    Production Base and Market Concentration Rate of Raw Material
    TABLE 36    Key Suppliers of Raw Materials
    TABLE 37    Raw Materials Sources of Nanofiber Production Machines  Major Manufacturers in 2016
    TABLE 38    Major Buyers of Nanofiber Production Machines
    TABLE 39    Distributors/Traders of Nanofiber Production Machines

  • Industry Major Market Players

    • Contipro
    • Elmarco
    • Nabond Technologies Co. Ltd
    • Nanoflux Pte. Ltd
    • Tong Li Tech Co. Ltd
    • Inovenso
    • Kato Tech Co. Ltd
    • M-TechXInc