Search Market Research Report

Discover Our Latest Reports
Discover Our Featured Reports
Discover Top Selling Reports

N-Phenylmaleimide Market Size, Share Global Analysis Report, 2020–2026

report img

N-Phenylmaleimide Market By Application (Natural/Synthetic Rubber, Resin (ABS, PVC, Others), and Others): Global Industry Outlook, Market Size, Business Intelligence, Consumer Preferences, Statistical Surveys, Comprehensive Analysis, Historical Developments, Current Trends, and Forecast 2020–2026

Industry Insights

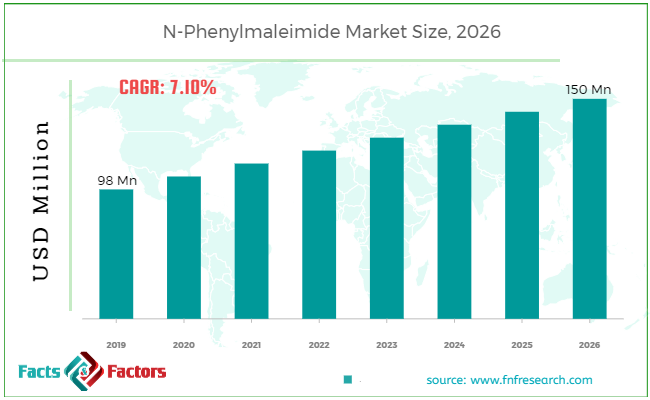
[180+ Pages Report] According to the report published by Facts Factors, the global N-phenylmaleimide market size was worth around USD 98 million in 2019 and is predicted to grow to around USD 150 million by 2026 with a compound annual growth rate (CAGR) of roughly 7.10% between 2020 and 2026. The report analyzes the global N-phenylmaleimide market drivers, restraints/challenges, and the effect they have on the demands during the projection period. In addition, the report explores emerging opportunities in the N-phenylmaleimide market.

N-Phenylmaleimide Market Size

To know more about this report | Request Free Sample Copy

This specialized and expertise oriented industry research report scrutinizes the technical and commercial business outlook of the n-phenylmaleimide industry. The report analyzes and declares the historical and current trends analysis of the n-phenylmaleimide industry and subsequently recommends the projected trends anticipated to be observed in the N-Phenylmaleimide market during the upcoming years.

The n-phenylmaleimide market report analyzes and notifies the industry statistics at the global as well as regional and country levels in order to acquire a thorough perspective of the entire n-phenylmaleimide market. The historical and past insights are provided for FY 2016 to FY 2019 whereas projected trends are delivered for FY 2020 to FY 2026. The quantitative and numerical data is represented in terms of both volume (Units) and value (USD Million) from FY 2016 – 2026.


logoKey Insights from Primary Research

  • As per our primary respondents, the global N-Phenylmaleimide market is set to grow annually at a rate of around 7.10%.
  • It was established through primary research that the N-Phenylmaleimide market was valued at around USD 98 Million in 2019
  • Presently, China is holding the largest revenue share among all the regions and is further expected to maintain its position throughout the forecast period.
  • Based on various applications, the global N-phenylmaleimide market was led by natural synthetic rubber production. It accounted for around 45.0% share of the market in 2019.
  •  The global N-Phenylmaleimide market is expected to reach around USD 150 Million by 2026.

logoKey Recommendations from Analysts

  • As per our analysts, the global N-Phenylmaleimide market is expected to grow significantly over the forecast period.
  • The strategic and competitive advantage provided by the synthetic is anticipated to be the key factor driving this market globally.
  • As per analysts, the growing automotive industry will grow the global N-Phenylmaleimide market.  
  • Our team of analysts has identified, China is expected to be the fastest growing market for N-phenylmaleimide during the years to come.
  • It has been identified by analyst that Japan is a significant producer of N-phenylmaleimide with Nippon Shokubai co. Ltd being as a largest player in the market.

The quantitative data is further underlined and reinforced by comprehensive qualitative data which comprises various across-the-board market dynamics. The rationales which directly or indirectly impact the n-phenylmaleimide industry are exemplified through parameters such as growth drivers, restraints, challenges, and opportunities among other impacting factors.

Throughout our research report, we have encompassed all the proven models and tools of industry analysis and extensively illustrated all the key business strategies and business models adopted in the n-phenylmaleimide industry. The report provides an all-inclusive and detailed competitive landscape prevalent in the n-phenylmaleimide market.

The report utilizes established industry analysis tools and models such as Porter’s Five Forces framework to analyze and recognize critical business strategies adopted by various stakeholders involved in the entire value chain of the n-phenylmaleimide industry. The n-phenylmaleimide market report additionally employs SWOT analysis and PESTLE analysis models for further in-depth analysis.

The report study further includes an in-depth analysis of industry players' market shares and provides an overview of leading players' market position in the n-phenylmaleimide sector. Key strategic developments in the N-Phenylmaleimide market competitive landscape such as acquisitions & mergers, inaugurations of different products and services, partnerships & joint ventures, MoU agreements, VC & funding activities, R&D activities, and geographic expansion among other noteworthy activities by key players of the n-phenylmaleimide market are appropriately highlighted in the report.

Rising automotive industry will cater the n-phenylmaleimide market a lucrative opportunities to earn revenue over the next few years. Increase in production of vehicle will require synthetic rubber for vehicle’s tire and to produce such type of rubbers need n-phenylmaleimide. Thereby, it has been indicated the n-phenylmaleimide market will expand owing to increased production of vehicles. Moreover, synthetic rubbers are used in shoe soles, bowling balls, hockey pucks, bouncing balls, toys, and erasers. As a result, certain factors are driving the sales of n-phenylmaleimide. N-phenylmaleimide is also used in coatings, medicines for light-sensitive resins, binders; farm chemicals, and so on. As an enhancer of thermal resistance agent for ABS resins, acrylic resins, demand for N-phenylmaleimide is rapidly increasing. In addition, the developing polymer and rubber industries across the globe are expected to boost demand for N-phenylmaleimide in the years to come.

The n-phenylmaleimide market research report delivers an acute valuation and taxonomy of the n-phenylmaleimide industry by practically splitting the market on the basis of different types, applications, and regions. Through the analysis of the historical and projected trends, all the segments and sub-segments were evaluated through the bottom-up approach, and different market sizes have been projected for FY 2020 to FY 2026.

logoReport Scope

Report Attribute

Details

Market Size in 2019

USD 98 Billion

Projected Market Size in 2026

USD 150 Billion

CAGR Growth Rate

7.10% CAGR

Base Year

2019

Forecast Years

2020-2026

Key Market Players

Nippon Shokubai, Fuyang Taian Chemical Co. Ltd, Z River Group (CHN), Anhui Jin'ao Chemical Co, Alfa Aesar, TCI Chemical, Sigma-Aldrich and Hangzhou Keli Chemical Co., Ltd, and Others

Key Segment

By Application, and Region

Major Regions Covered

North America, Europe, Asia Pacific, Latin America, and the Middle East & Africa

Purchase Options

Request customized purchase options to meet your research needs.Explore purchase options

The regional segmentation of the n-phenylmaleimide industry includes the complete classification of all the major continents including North America, Latin America, Europe, Asia Pacific, and Middle East & Africa. Further, country-wise data for the n-phenylmaleimide industry is provided for the leading economies of the world.

The N-Phenylmaleimide market has been segmented into application and region. In terms of applications, it has been bifurcated into natural/synthetic rubber, and resin (ABS, PVC, others), among others.

logoSome of the leading players in the global market include

  • Nippon Shokubai
  • Fuyang Taian Chemical Co. Ltd
  • Z River Group (CHN)
  • Anhui Jin'ao Chemical Co
  • Alfa Aesar
  • TCI Chemical
  • Sigma-Aldrich
  • Hangzhou Keli Chemical Co.Ltd

The taxonomy of the n-phenylmaleimide industry by its scope and segmentation is as follows:

logo By Application Segmentation Analysis

  • Natural/Synthetic Rubber
  • Resin(ABS, PVC, Others)
  • Others

logo Regional Segmentation Analysis

  • North America
    • The U.S.
    • Canada
  • Europe
    • Germany
    • The UK
    • France
    • Spain
    • Italy
    • Rest of Europe
  • Asia Pacific
    • China
    • Japan
    • India
    • South Korea
    • Southeast Asia
    • Rest of Asia Pacific
  • Latin America
    • Brazil
    • Mexico
    • Rest of Latin America
  • Middle East & Africa
    • GCC
    • South Africa
    • Rest of Middle East & Africa

Table of Content

  1. CHAPTER 1. Executive Summary
  2. CHAPTER 2. N-Phenylmaleimide market – Application Analysis
    1. 2.1. Global N-Phenylmaleimide Market – Application Overview
    2. 2.2. Global N-Phenylmaleimide Market Share, by Application, 2018 & 2025 (USD Million)
    3. 2.3. Global N-Phenylmaleimide Market share, by Application, 2018 & 2025 (Kilo Tons)
    4. 2.4. Natural/Synthetic Rubber
      1. 2.4.1. Global Natural/Synthetic Rubber N-Phenylmaleimide Market, 2016-2026 (USD Million)
      2. 2.4.2. Global Natural/Synthetic Rubber N-Phenylmaleimide Market, 2016-2026 (Kilo Tons)
    5. 2.5. Resin(ABS, PVC, Others)
      1. 2.5.1. Global Resin(ABS, PVC, Others) N-Phenylmaleimide Market, 2016-2026 (USD Million)
      2. 2.5.2. Global Resin(ABS, PVC, Others) N-Phenylmaleimide Market, 2016-2026 (Kilo Tons)
    6. 2.6. Others
      1. 2.6.1. Global Others N-Phenylmaleimide Market, 2016-2026 (USD Million)
      2. 2.6.2. Global Others N-Phenylmaleimide Market, 2016-2026 (Kilo Tons)
  3. CHAPTER 3. N-Phenylmaleimide market – Regional Analysis
    1. 3.1. Global N-Phenylmaleimide Market Regional Overview
    2. 3.2. Global N-Phenylmaleimide Market Share, by Region, 2018 & 2025 (Value)
    3. 3.3. Global N-Phenylmaleimide Market Share, by Region, 2018 & 2025 (Volume)
    4. 3.4. North America
      1. 3.4.1. North America N-Phenylmaleimide Market size and forecast, 2016-2026
      2. 3.4.2. North America N-Phenylmaleimide Market, by Country, 2018 - 2025 (USD Million)
      3. 3.4.3. North America Market size and forecast, 2016-2026 (Kilo Tons)
      4. 3.4.4. North America N-Phenylmaleimide Market, by Country, 2018 - 2025 (Kilo Tons)
      5. 3.4.5. North America N-Phenylmaleimide Market, by Application, 2016-2026
        1. 3.4.5.1. North America N-Phenylmaleimide Market, by Application, 2016-2026 (USD Million)
        2. 3.4.5.2. North America N-Phenylmaleimide Market, by Application, 2016-2026 (Kilo Tons)
      6. 3.4.6. U.S.
        1. 3.4.6.1. U.S. Market size and forecast, 2016-2026 (USD Million)
        2. 3.4.6.2. U.S. Market size and forecast, 2016-2026 (Kilo Tons)
      7. 3.4.7. Canada
        1. 3.4.7.1. Canada Market size and forecast, 2016-2026 (USD Million)
        2. 3.4.7.2. Canada Market size and forecast, 2016-2026 (Kilo Tons)
    5. 3.5. Europe
      1. 3.5.1. Europe N-Phenylmaleimide Market size and forecast, 2016-2026
      2. 3.5.2. Europe N-Phenylmaleimide Market, by Country, 2018 - 2025 (USD Million)
      3. 3.5.3. Europe Market size and forecast, 2016-2026 (Kilo Tons)
      4. 3.5.4. Europe N-Phenylmaleimide Market, by Country, 2018 - 2025 (Kilo Tons)
      5. 3.5.5. Europe N-Phenylmaleimide Market, by Application, 2016-2026
        1. 3.5.5.1. Europe N-Phenylmaleimide Market, by Application, 2016-2026 (USD Million)
        2. 3.5.5.2. Europe N-Phenylmaleimide Market, by Application, 2016-2026 (Kilo Tons)
      6. 3.5.6. Germany
        1. 3.5.6.1. Germany Market size and forecast, 2016-2026 (USD Million)
        2. 3.5.6.2. Germany Market size and forecast, 2016-2026 (Kilo Tons)
      7. 3.5.7. France
        1. 3.5.7.1. France Market size and forecast, 2016-2026 (USD Million)
        2. 3.5.7.2. France Market size and forecast, 2016-2026 (Kilo Tons)
      8. 3.5.8. U.K.
        1. 3.5.8.1. U.K. Market size and forecast, 2016-2026 (USD Million)
        2. 3.5.8.2. U.K. Market size and forecast, 2016-2026 (Kilo Tons)
      9. 3.5.9. Italy
        1. 3.5.9.1. Italy Market size and forecast, 2016-2026 (USD Million)
        2. 3.5.9.2. Italy Market size and forecast, 2016-2026 (Kilo Tons)
      10. 3.5.10. Spain
        1. 3.5.10.1. Spain Market size and forecast, 2016-2026 (USD Million)
        2. 3.5.10.2. Spain Market size and forecast, 2016-2026 (Kilo Tons)
      11. 3.5.11. Rest of Europe
        1. 3.5.11.1. Rest of Europe Market size and forecast, 2016-2026 (USD Million)
        2. 3.5.11.2. Rest of Europe Market size and forecast, 2016-2026 (Kilo Tons)
    6. 3.6. Asia Pacific
      1. 3.6.1. Asia Pacific N-Phenylmaleimide Market size and forecast, 2016-2026
      2. 3.6.2. Asia Pacific N-Phenylmaleimide Market, by Country, 2018 - 2025 (USD Million)
      3. 3.6.3. Asia Pacific Market size and forecast, 2016-2026 (Kilo Tons)
      4. 3.6.4. Asia Pacific N-Phenylmaleimide Market, by Country, 2018 - 2025 (Kilo Tons)
      5. 3.6.5. Asia Pacific N-Phenylmaleimide Market, by Application, 2016-2026
        1. 3.6.5.1. Asia Pacific N-Phenylmaleimide Market, by Application, 2016-2026 (USD Million)
        2. 3.6.5.2. Asia Pacific N-Phenylmaleimide Market, by Application, 2016-2026 (Kilo Tons)
      6. 3.6.6. China
        1. 3.6.6.1. China Market size and forecast, 2016-2026 (USD Million)
        2. 3.6.6.2. China Market size and forecast, 2016-2026 (Kilo Tons)
      7. 3.6.7. Japan
        1. 3.6.7.1. Japan Market size and forecast, 2016-2026 (USD Million)
        2. 3.6.7.2. Japan Market size and forecast, 2016-2026 (Kilo Tons)
      8. 3.6.8. India
        1. 3.6.8.1. India Market size and forecast, 2016-2026 (USD Million)
        2. 3.6.8.2. India Market size and forecast, 2016-2026 (Kilo Tons)
      9. 3.6.9. South Korea
        1. 3.6.9.1. South Korea Market size and forecast, 2016-2026 (USD Million)
        2. 3.6.9.2. South Korea Market size and forecast, 2016-2026 (Kilo Tons)
      10. 3.6.10. South-East Asia
        1. 3.6.10.1. South-East Asia Market size and forecast, 2016-2026 (USD Million)
        2. 3.6.10.2. South-East Asia Market size and forecast, 2016-2026 (Kilo Tons)
      11. 3.6.11. Rest of Asia Pacific
        1. 3.6.11.1. Rest of Asia Pacific Market size and forecast, 2016-2026 (USD Million)
        2. 3.6.11.2. Rest of Asia Pacific Market size and forecast, 2016-2026 (Kilo Tons)
    7. 3.7. Latin America
      1. 3.7.1. Latin America N-Phenylmaleimide Market size and forecast, 2016-2026
      2. 3.7.2. Latin America N-Phenylmaleimide Market, by Country, 2018 - 2025 (USD Million)
      3. 3.7.3. Latin America Market size and forecast, 2016-2026 (Kilo Tons)
      4. 3.7.4. Latin America N-Phenylmaleimide Market, by Country, 2018 - 2025 (Kilo Tons)
      5. 3.7.5. Latin America N-Phenylmaleimide Market, by Application, 2016-2026
        1. 3.7.5.1. Latin America N-Phenylmaleimide Market, by Application, 2016-2026 (USD Million)
        2. 3.7.5.2. Latin America N-Phenylmaleimide Market, by Application, 2016-2026 (Kilo Tons)
      6. 3.7.6. Brazil
        1. 3.7.6.1. Brazil Market size and forecast, 2016-2026 (USD Million)
        2. 3.7.6.2. Brazil Market size and forecast, 2016-2026 (Kilo Tons)
      7. 3.7.7. Mexico
        1. 3.7.7.1. Mexico Market size and forecast, 2016-2026 (USD Million)
        2. 3.7.7.2. Mexico Market size and forecast, 2016-2026 (Kilo Tons)
      8. 3.7.8. Rest of Latin America
        1. 3.7.8.1. Rest of Latin America Market size and forecast, 2016-2026 (USD Million)
        2. 3.7.8.2. Rest of Latin America Market size and forecast, 2016-2026 (Kilo Tons)
    8. 3.8. The Middle-East and Africa
      1. 3.8.1. The Middle-East and Africa N-Phenylmaleimide Market size and forecast, 2016-2026
      2. 3.8.2. The Middle-East and Africa N-Phenylmaleimide Market, by Country, 2018 - 2025 (USD Million)
      3. 3.8.3. The Middle-East and Africa Market size and forecast, 2016-2026 (Kilo Tons)
      4. 3.8.4. The Middle-East and Africa N-Phenylmaleimide Market, by Country, 2018 - 2025 (Kilo Tons)
      5. 3.8.5. The Middle-East and Africa N-Phenylmaleimide Market, by Application, 2016-2026
        1. 3.8.5.1. The Middle-East and Africa N-Phenylmaleimide Market, by Application, 2016-2026 (USD Million)
        2. 3.8.5.2. The Middle-East and Africa N-Phenylmaleimide Market, by Application, 2016-2026 (Kilo Tons)
      6. 3.8.6. GCC Countries
        1. 3.8.6.1. GCC Countries Market size and forecast, 2016-2026 (USD Million)
        2. 3.8.6.2. GCC Countries Market size and forecast, 2016-2026 (Kilo Tons)
      7. 3.8.7. South Africa
        1. 3.8.7.1. South Africa Market size and forecast, 2016-2026 (USD Million)
        2. 3.8.7.2. South Africa Market size and forecast, 2016-2026 (Kilo Tons)
      8. 3.8.8. Rest of Middle-East Africa
        1. 3.8.8.1. Rest of Middle-East Africa Market size and forecast, 2016-2026 (USD Million)
        2. 3.8.8.2. Rest of Middle-East Africa Market size and forecast, 2016-2026 (Kilo Tons)
  4. CHAPTER 4. N-Phenylmaleimide Production, Consumption, Export, Import by Regions
    1. 4.1. Global N-Phenylmaleimide production and revenue, 2015-2025 (USD Million) (Kilo Tons)
    2. 4.2. Global Import and Export Analysis, by Region
  5. CHAPTER 5. N-Phenylmaleimide market – Competitive Landscape
    1. 5.1. Competitor Market Share – Revenue
    2. 5.2. Market Concentration Rate Analysis, Top 3 and Top 5 Players
    3. 5.3. Competitor Market Share – Volume
    4. 5.4. Strategic Development
      1. 5.4.1. Acquisitions and Mergers
      2. 5.4.2. New Products
      3. 5.4.3. Research & Development Activities
  6. CHAPTER 6. Company Profiles
    1. 6.1. Nippon Shokubai
      1. 6.1.1. Company Overview
      2. 6.1.2. Nippon Shokubai Sales, Revenue, Price, and Gross Margin
      3. 6.1.3. Product portfolio
      4. 6.1.4. Recent initiatives
    2. 6.2. Fuyang Taian Chemical Co. Ltd
      1. 6.2.1. Company Overview
      2. 6.2.2. Fuyang Taian Chemical Co. Ltd Sales, Revenue, Price, and Gross Margin
      3. 6.2.3. Product portfolio
      4. 6.2.4. Recent initiatives
    3. 6.3. Z River Group (CHN)
      1. 6.3.1. Company Overview
      2. 6.3.2. Z River Group (CHN) Sales, Revenue, Price, and Gross Margin
      3. 6.3.3. Product portfolio
      4. 6.3.4. Recent initiatives
    4. 6.4. Anhui Jin'ao Chemical Co
      1. 6.4.1. Company Overview
      2. 6.4.2. Anhui Jin'ao Chemical Co Sales, Revenue, Price, and Gross Margin
      3. 6.4.3. Product portfolio
      4. 6.4.4. Recent initiatives
    5. 6.5. Hangzhou Keli Chemical Co., Ltd
      1. 6.5.1. Company Overview
      2. 6.5.2. Hangzhou Keli Chemical Co., Ltd Sales, Revenue, Price, and Gross Margin
      3. 6.5.3. Product portfolio
      4. 6.5.4. Recent initiatives
    6. 6.6. Alfa Aesar
      1. 6.6.1. Company Overview
      2. 6.6.2. Alfa Aesar Sales, Revenue, Price, and Gross Margin
      3. 6.6.3. Product portfolio
      4. 6.6.4. Recent initiatives
    7. 6.7. TCI Chemical
      1. 6.7.1. Company Overview
      2. 6.7.2. TCI Chemical Sales, Revenue, Price, and Gross Margin
      3. 6.7.3. Product portfolio
      4. 6.7.4. Recent initiatives
    8. 6.8. Sigma-Aldrich
      1. 6.8.1. Company Overview
      2. 6.8.2. Sigma-Aldrich Sales, Revenue, Price, and Gross Margin
      3. 6.8.3. Product portfolio
      4. 6.8.4. Recent initiatives
  7. CHAPTER 7. N-Phenylmaleimide — Industry Analysis
    1. 7.1. Introduction and Taxonomy
    2. 7.2. N-Phenylmaleimide Market – Key Trends
      1. 7.2.1. Market Drivers
      2. 7.2.2. Market Restraints
      3. 7.2.3. Market Opportunities
    3. 7.3. Value Chain Analysis
    4. 7.4. Key Mandates and Regulations
    5. 7.5. Technology Roadmap and Timeline
    6. 7.6. N-Phenylmaleimide market – Attractiveness Analysis
      1. 7.6.1. By Application
      2. 7.6.2. By Region
  8. CHAPTER 8. Raw Material analysis
    1. 8.1. N-Phenylmaleimide Key Raw Material Analysis
      1. 8.1.1. Key Raw Materials
      2. 8.1.2. Price Trend of Key Raw Materials
    2. 8.2. Key Suppliers of Raw Materials
    3. 8.3. Proportion of Manufacturing Cost Structure
      1. 8.3.1. Raw Materials
      2. 8.3.2. Labor Cost
    4. 8.4. Manufacturing Expenses Analysis of N-Phenylmaleimide
  9. CHAPTER 9. Industrial Chain, Sourcing Strategy and Downstream Buyers
    1. 9.1. N-Phenylmaleimide Industrial Chain Analysis
    2. 9.2. Upstream Raw Materials Sourcing
      1. 9.2.1. Risk Mitigation:
      2. 9.2.2. Supplier Relationships:
      3. 9.2.3. Business Processes:
      4. 9.2.4. Securing the Product:
    3. 9.3. Raw Materials Sources of N-Phenylmaleimide Major Manufacturers in 2016
    4. 9.4. Downstream Buyers
    5. 9.5. Distributors/Traders List
  10. CHAPTER 10. Marketing Strategy Analysis, Distributors
    1. 10.1. Marketing Channel
    2. 10.2. Direct Marketing
    3. 10.3. Indirect Marketing
    4. 10.4. Marketing Channel Development Trend
    5. 10.5. Economic/Political Environmental Change
  11. CHAPTER 11. Report Conclusion
  12. CHAPTER 12. Research Approach & Methodology
    1. 12.1. Report Description
    2. 12.2. Research Scope
    3. 12.3. Research Methodology
      1. 12.3.1. Secondary Research
      2. 12.3.2. Primary Research
      3. 12.3.3. Models
        1. 12.3.3.1. Company Share Analysis Model
        2. 12.3.3.2. Revenue Based Modeling
        3. 12.3.3.3. Research Limitations

        List of Figures

        FIG. 1 Global N-Phenylmaleimide Market, 2016-2026 (USD Million)
        FIG. 2 Global N-Phenylmaleimide Market Share, by Application, 2018 & 2025 (USD Million)
        FIG. 3 Global N-Phenylmaleimide Market share, by Application, 2018 & 2025 (Kilo Tons)
        FIG. 4 Global Natural/Synthetic Rubber N-Phenylmaleimide Market, 2016-2026 (USD Million)
        FIG. 5 Global Natural/Synthetic Rubber N-Phenylmaleimide  Market, 2016-2026 (Kilo Tons)
        FIG. 6 Global Resin(ABS, PVC, Others) N-Phenylmaleimide Market, 2016-2026 (USD Million)
        FIG. 7 Global Resin(ABS, PVC, Others) N-Phenylmaleimide  Market, 2016-2026 (Kilo Tons)
        FIG. 8 Global Others N-Phenylmaleimide Market, 2016-2026 (USD Million)
        FIG. 9 Global Others N-Phenylmaleimide  Market, 2016-2026 (Kilo Tons)
        FIG. 10 Global N-Phenylmaleimide Market Share, by Region, 2018 & 2025
        FIG. 11 Global N-Phenylmaleimide Market Share, by Region, 2018 & 2025
        FIG. 12 North America N-Phenylmaleimide Market, 2016-2026
        FIG. 13 North America N-Phenylmaleimide  Market, 2016-2026 (Kilo Tons)
        FIG. 14 U.S. N-Phenylmaleimide Market, 2016-2026
        FIG. 15 U.S. N-Phenylmaleimide  Market, 2016-2026 (Kilo Tons)
        FIG. 16 Canada N-Phenylmaleimide Market, 2016-2026
        FIG. 17 Canada N-Phenylmaleimide  Market, 2016-2026 (Kilo Tons)
        FIG. 18 Europe N-Phenylmaleimide Market, 2016-2026
        FIG. 19 Europe N-Phenylmaleimide  Market, 2016-2026 (Kilo Tons)
        FIG. 20 Germany N-Phenylmaleimide Market, 2016-2026
        FIG. 21 Germany N-Phenylmaleimide  Market, 2016-2026 (Kilo Tons)
        FIG. 22 France N-Phenylmaleimide Market, 2016-2026
        FIG. 23 France N-Phenylmaleimide  Market, 2016-2026 (Kilo Tons)
        FIG. 24 U.K. N-Phenylmaleimide Market, 2016-2026
        FIG. 25 U.K. N-Phenylmaleimide  Market, 2016-2026 (Kilo Tons)
        FIG. 26 Italy N-Phenylmaleimide Market, 2016-2026
        FIG. 27 Italy N-Phenylmaleimide  Market, 2016-2026 (Kilo Tons)
        FIG. 28 Spain N-Phenylmaleimide Market, 2016-2026
        FIG. 29 Spain N-Phenylmaleimide  Market, 2016-2026 (Kilo Tons)
        FIG. 30 Rest of Europe N-Phenylmaleimide Market, 2016-2026
        FIG. 31 Rest of Europe N-Phenylmaleimide  Market, 2016-2026 (Kilo Tons)
        FIG. 32 Asia Pacific N-Phenylmaleimide Market, 2016-2026
        FIG. 33 Asia Pacific N-Phenylmaleimide  Market, 2016-2026 (Kilo Tons)
        FIG. 34 China N-Phenylmaleimide Market, 2016-2026
        FIG. 35 China N-Phenylmaleimide  Market, 2016-2026 (Kilo Tons)
        FIG. 36 Japan N-Phenylmaleimide Market, 2016-2026
        FIG. 37 Japan N-Phenylmaleimide  Market, 2016-2026 (Kilo Tons)
        FIG. 38 India N-Phenylmaleimide Market, 2016-2026
        FIG. 39 India N-Phenylmaleimide  Market, 2016-2026 (Kilo Tons)
        FIG. 40 South  Korea N-Phenylmaleimide Market, 2016-2026
        FIG. 41 South  Korea N-Phenylmaleimide  Market, 2016-2026 (Kilo Tons)
        FIG. 42 South-East Asia N-Phenylmaleimide Market, 2016-2026
        FIG. 43 South-East Asia N-Phenylmaleimide  Market, 2016-2026 (Kilo Tons)
        FIG. 44 Rest of Asia Pacific N-Phenylmaleimide Market, 2016-2026
        FIG. 45 Rest of Asia Pacific N-Phenylmaleimide  Market, 2016-2026 (Kilo Tons)
        FIG. 46 Latin America N-Phenylmaleimide Market, 2016-2026
        FIG. 47 Latin America N-Phenylmaleimide  Market, 2016-2026 (Kilo Tons)
        FIG. 48 Brazil N-Phenylmaleimide Market, 2016-2026
        FIG. 49 Brazil N-Phenylmaleimide  Market, 2016-2026 (Kilo Tons)
        FIG. 50 Mexico N-Phenylmaleimide Market, 2016-2026
        FIG. 51 Mexico N-Phenylmaleimide  Market, 2016-2026 (Kilo Tons)
        FIG. 52 Rest of Latin America N-Phenylmaleimide Market, 2016-2026
        FIG. 53 Rest of Latin America N-Phenylmaleimide  Market, 2016-2026 (Kilo Tons)
        FIG. 54 The Middle-East and Africa N-Phenylmaleimide Market, 2016-2026
        FIG. 55 The Middle-East and Africa N-Phenylmaleimide  Market, 2016-2026 (Kilo Tons)
        FIG. 56 GCC Countries N-Phenylmaleimide Market, 2016-2026
        FIG. 57 GCC Countries N-Phenylmaleimide  Market, 2016-2026 (Kilo Tons)
        FIG. 58 South Africa N-Phenylmaleimide Market, 2016-2026
        FIG. 59 South Africa N-Phenylmaleimide  Market, 2016-2026 (Kilo Tons)
        FIG. 60 Rest of Middle-East Africa N-Phenylmaleimide Market, 2016-2026
        FIG. 61 Rest of Middle-East Africa N-Phenylmaleimide  Market, 2016-2026 (Kilo Tons)
        FIG. 62 Global N-Phenylmaleimide production and revenue, 2015-2025 (USD Million) (Kilo Tons)
        FIG. 63 North America N-Phenylmaleimide production and revenue, 2015-2025 (USD Million) (Kilo Tons)
        FIG. 64 Europe N-Phenylmaleimide production and revenue, 2015-2025 (USD Million) (Kilo Tons)
        FIG. 65 Asia Pacific N-Phenylmaleimide production and revenue, 2015-2025 (USD Million) (Kilo Tons)
        FIG. 66 Latin America N-Phenylmaleimide production and revenue, 2015-2025 (USD Million) (Kilo Tons)
        FIG. 67 Middle East and Africa N-Phenylmaleimide production and revenue, 2015-2025 (USD Million) (Kilo Tons)
        FIG. 68 Competitor Market Share – Revenue
        FIG. 69 Competitor Market Share – Volume
        FIG. 70 Nippon Shokubai Revenue and Growth Rate
        FIG. 71 Nippon Shokubai Market Share
        FIG. 72 Fuyang Taian Chemical Co. Ltd Revenue and Growth Rate
        FIG. 73 Fuyang Taian Chemical Co. Ltd Market Share
        FIG. 74 Z River Group (CHN) Revenue and Growth Rate
        FIG. 75 Z River Group (CHN) Market Share
        FIG. 76 Anhui Jin'ao Chemical Co Revenue and Growth Rate
        FIG. 77 Anhui Jin'ao Chemical Co Market Share
        FIG. 78 Hangzhou Keli Chemical Co., Ltd Revenue and Growth Rate
        FIG. 79 Hangzhou Keli Chemical Co., Ltd Market Share
        FIG. 80 Alfa Aesar Revenue and Growth Rate
        FIG. 81 Alfa Aesar Market Share
        FIG. 82 TCI Chemical Revenue and Growth Rate
        FIG. 83 TCI Chemical Market Share
        FIG. 84 Sigma-Aldrich Revenue and Growth Rate
        FIG. 85 Sigma-Aldrich Market Share
        FIG. 86 Market Dynamics
        FIG. 87 Global N-Phenylmaleimide – Value Chain Analysis
        FIG. 88 Key Mandates and Regulations
        FIG. 89 Technology Roadmap and Timeline
        FIG. 90 Market Attractiveness Analysis – By Application
        FIG. 91 Market Attractiveness Analysis – By Region
        FIG. 92 Manufacturing Cost Structure of N-Phenylmaleimide
        FIG. 93 N-Phenylmaleimide Industrial Chain Analysis
        FIG. 94 Market Channel
        FIG. 95 Marketing Channel Development Trend
        FIG. 96 Growth in World Gross Product, 2008-2018

        List of Tables

        TABLE 1 Global N-Phenylmaleimide market, 2018 & 2025 (USD Million)
        TABLE 2 Global N-Phenylmaleimide market, by Application, 2016-2026 (USD Million)
        TABLE 3 Global N-Phenylmaleimide market, by Application, 2016-2026 (Kilo Tons)
        TABLE 4 Global N-Phenylmaleimide market, by region, 2016-2026 (USD Million)
        TABLE 5 Global N-Phenylmaleimide market, by region, 2016-2026 (Kilo Tons)
        TABLE 6 North America N-Phenylmaleimide Market, by Application, 2016-2026 (USD Million)
        TABLE 7 North America N-Phenylmaleimide Market, by Application, 2016-2026 (Kilo Tons)
        TABLE 8 Europe N-Phenylmaleimide Market, by Application, 2016-2026 (USD Million)
        TABLE 9 Europe N-Phenylmaleimide Market, by Application, 2016-2026 (Kilo Tons)
        TABLE 10 Asia Pacific N-Phenylmaleimide Market, by Application, 2016-2026 (USD Million)
        TABLE 11 Asia Pacific N-Phenylmaleimide Market, by Application, 2016-2026 (Kilo Tons)
        TABLE 12 Latin America N-Phenylmaleimide Market, by Application, 2016-2026 (USD Million)
        TABLE 13 Latin America N-Phenylmaleimide Market, by Application, 2016-2026 (Kilo Tons)
        TABLE 14 The Middle-East and Africa N-Phenylmaleimide Market, by Application, 2016-2026 (USD Million)
        TABLE 15 The Middle-East and Africa N-Phenylmaleimide Market, by Application, 2016-2026 (Kilo Tons)
        TABLE 16 North America N-Phenylmaleimide Production, Consumption, Export, Import, 2016-2019
        TABLE 17 Europe N-Phenylmaleimide Production, Consumption, Export, Import, 2016-2019
        TABLE 18 Asia Pacific N-Phenylmaleimide Production, Consumption, Export, Import, 2016-2019
        TABLE 19 Latin America N-Phenylmaleimide Production, Consumption, Export, Import, 2016-2019
        TABLE 20 Middle East & Africa N-Phenylmaleimide Production, Consumption, Export, Import, 2016-2019
        TABLE 21 Global N-Phenylmaleimide Market - Company Revenue Analysis 2016-2019 (USD Million)
        TABLE 22 Global N-Phenylmaleimide Market - Company Revenue Share Analysis 2016-2019(%)
        TABLE 23 Global N-Phenylmaleimide Market - Company Volume Analysis 2016-2019 (Kilo Tons)
        TABLE 24 Global N-Phenylmaleimide Market - Company Volume Share Analysis 2016-2019(%)
        TABLE 25 Acquisitions and Mergers
        TABLE 26 New Product/Service Launch
        TABLE 27 Research & Development Activities
        TABLE 28 Market Drivers
        TABLE 29 Market Restraints
        TABLE 30 Market Opportunities
        TABLE 31 Production Base and Market Concentration Rate of Raw Material
        TABLE 32 Key Suppliers of Raw Materials
        TABLE 33 Raw Materials Sources of N-Phenylmaleimide Major Manufacturers in 2016
        TABLE 34 Major Buyers of N-Phenylmaleimide
        TABLE 35 Distributors/Traders of N-Phenylmaleimide by Region

Industry Major Market Players

  • Nippon Shokubai
  • Fuyang Taian Chemical Co. Ltd
  • Z River Group (CHN)
  • Anhui Jin'ao Chemical Co
  • Alfa Aesar
  • TCI Chemical
  • Sigma-Aldrich
  • Hangzhou Keli Chemical Co.Ltd