Search Market Research Report

Discover Our Latest Reports
Discover Our Featured Reports
Discover Top Selling Reports

Moisture Sensors Market Size, Share Global Analysis Report, 2019 – 2026

report img

Moisture Sensors Market by Type (Halogen Moisture Sensor, Infrared Moisture Sensor, and Microwave Moisture Sensor), and By Application (Food Processing, Pharmaceutical, Environmental, and Chemical Industries): North America and Europe Industry Perspective, Comprehensive Analysis and Forecast 2019 – 2026

Industry Insights

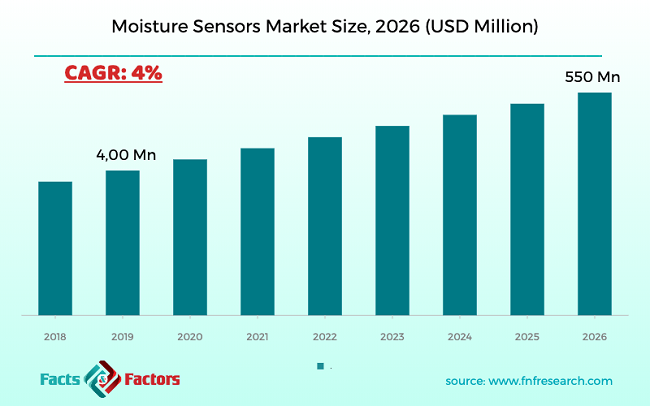
[110+ Pages Report] According to the report published by Facts Factors, the global moisture sensors market size was worth around USD 400 million in 2019 and is predicted to grow to around USD 550 million by 2026 with a compound annual growth rate (CAGR) of roughly 4% between 2020 and 2026. The report analyzes the global moisture sensors market drivers, restraints/challenges, and the effect they have on the demands during the projection period. In addition, the report explores emerging opportunities in the moisture sensors market.

Moisture Sensors Market Size

To know more about this report | Request Free Sample Copy

The report encompasses the forecast as well as an analysis of the moisture sensors market on the global and regional levels. The study displays historical data from 2016 to 2019 along with a forecast from 2020 to 2026 based on revenue (USD Million) and volume (K Units). Additionally, the market growth drivers, opportunities, limitations, and trends are also included in the moisture sensors market report.  

We have included industry analysis models in our report and extensively demonstrated the key business strategies and competitive landscape of the moisture sensors market in our study.


logoKey Insights from Primary Research

  • As per our primary respondents, the U.S. moisture sensors market is set to grow annually at a rate of around 4%
  • It was established through primary research that the U.S. moisture sensors market was valued at around USD 400 million in 2019
  • In terms of volume, the North America moisture sensors market stood at approximately 300 K Units, in 2019.
  • The “microwave moisture sensor” category, on the basis of type segmentation, was the leading revenue-generating category accounting for around 40% share, in 2019.
  • On the basis of application segmentation, the “pharmaceutical” category held the leading share at more than 30%, in 2019

logoKey Recommendations from Analysts

  • Growing at a CAGR of around 4%, the U.S. moisture sensors market provides numerous opportunities for all of the involved stakeholders across the entire value chain
  • Our analysts have identified “microwave moisture sensor” and “pharmaceutical” categories as the leading investment pockets for the U.S. moisture sensors market in terms of type and application segmentations respectively
  • The high preference for halogenated moisture sensors in the food processing industry is anticipated to propel the U.S. moisture sensors market within the forecast period.
  • The U.S. has a key role in driving both North American production and exports, as the major manufacturer and exporter of manufactured moisture sensors in North America, with high cross-border integration of production chains.
  • Ongoing research and development with investment in microwave sensors is anticipated to fuel the future U.S. moisture sensors market growth in the upcoming years

logo
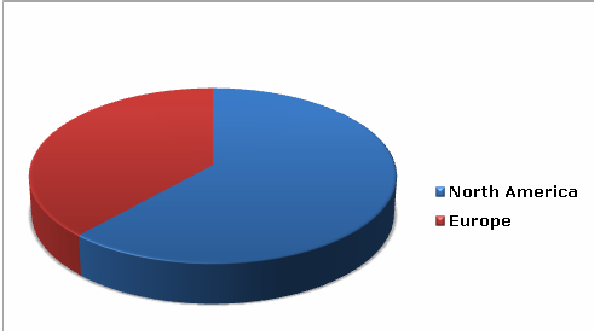
North America and Europe Moisture Sensor Market Share – By Type

Moisture Sensors Market

To know more about this report | Request Free Sample Copy


Our study also includes an analysis of Porter’s Five Forces framework for understanding the competitive strategies used by market competitors. It also encompasses PESTLE analysis and SWOT analysis.

The report also offers an in-depth analysis of the market share of each industry player and gives an outline of the market position of key players in the moisture sensors market. Moreover, the study offers wide coverage of key strategic improvements witnessed in the market such as acquisitions & mergers, new product launches, agreements, partnerships, collaborations & joint ventures, R&D activities, and geographical expansion of key players of the moisture sensors market.

The study provides a decisive view of the moisture sensors market by segmenting the moisture sensors market based on type, application, distribution channel, and region. All the segments have been analyzed based on present and future trends and the market is estimated from 2020 to 2026. The regional segmentation includes the current and forecast demand for North America, Europe, Asia Pacific, Latin America, and the Middle East and Africa.

The global moisture sensors market is experiencing significant growth that is expected to continue over the upcoming years. A massive rise in the demand for moisture control in application industries along with the advancement of manufacturing processes and technologies is likely to act as a key driver of the market.

logoReport Scope

Report Attribute

Details

Market Size in 2019

USD 400 Million

Projected Market Size in 2026

USD 550.00 Million

CAGR Growth Rate

4% CAGR

Base Year

2019

Forecast Years

2020-2026

Key Market Players

Hydronix, Ludwig & Co, SWR-Engineering, Sartorius AG, BERTHOLD TECHNOLOGIES GmbH & Company KG, Muentec Instruments, Liebherr-International AG, Ohaus Corporation, Thermo Fisher, Michell Instruments Ltd, AMETEK, General Electric Company, CEM Ltd, Sinar Technology, Gow-Mac Instrument Co, Hach, Precisa Gravimetrics AG, PCE Instruments, Torbal, Adam Equipment, Inc, and Arizona Instrument LLC, and Others

Key Segment

By Type, Application, and Region

Major Regions Covered

North America, Europe, Asia Pacific, Latin America, and the Middle East & Africa

Purchase Options

Request customized purchase options to meet your research needs.Explore purchase options

The rise in the number of health concerns associated with the ingestion of normal high-calorie sugar, diabetic patients, and rising obesity rates, is anticipated to fuel the global moisture sensors market in the upcoming years. Rising investment in food processing, textile, chemical, pharmaceutical, and renewable energy industries is expected to increase the demand for moisture sensors in the years to come.

The moisture sensors market is segmented based on type, application, and distribution channel.  Type-wise, the market is classified into halogen moisture sensors, infrared moisture sensors, and microwave moisture sensors. In terms of application, the market segment is sectored into food processing, pharmaceutical, environmental, and chemical industries.

logoSome of the leading players in the global market include

  • Hydronix
  • Ludwig & Co
  • SWR-Engineering
  • Sartorius AG
  • BERTHOLD TECHNOLOGIES GmbH & Company KG
  • Muentec Instruments
  • Liebherr-International AG
  • Ohaus Corporation
  • Thermo Fisher
  • Michell Instruments Ltd
  • AMETEK
  • General Electric Company
  • CEM Ltd
  • Sinar Technology
  • Gow-Mac Instrument Co
  • Hach
  • Precisa Gravimetrics AG
  • PCE Instruments
  • Torbal
  • Adam Equipment Inc
  • Arizona Instrument LLC

This report segments North America and Europe Moisture Sensors Market as follows:

logoBy Type Analysis

  • Halogen Moisture Sensor
  • Infrared Moisture Sensor
  • Microwave Moisture Sensor

logoBy Application Analysis

  • Vertical Analysis
  • Food processing
  • Pharmaceutical
  • Environmental
  • Chemical Industries

logoBy Regional Analysis

  • North America
  • Europe

logoKey Pointers Addressed by the Report

  • Historical data and forecast analysis of the market
  • Drivers and Restraints affecting market dynamics
  • Exhaustive analysis of the future market trends
  • Comprehensive information about the leading market segments and region
  • Strategic developments made by the competitive players and in-depth analysis of its impact on market growth

Table of Content

  1. CHAPTER 1. Executive Summary
  2. CHAPTER 2. Moisture Sensors market – Type Analysis
    1. 2.1. North America and Europe Moisture Sensors Market – Type Overview
    2. 2.2. North America and Europe Moisture Sensors Market Share, by Type, 2019 & 2026 (USD Million)
    3. 2.3. North America and Europe Moisture Sensors Market share, by Type, 2019 & 2026 (K Units)
    4. 2.4. Halogen Moisture Sensor
      1. 2.4.1. North America and Europe Halogen Moisture Sensor Moisture Sensors Market, 2016-2026 (USD Million)
      2. 2.4.2. North America and Europe Halogen Moisture Sensor Moisture Sensors Market, 2016-2026 (K Units)
    5. 2.5. Infrared Moisture Sensor
      1. 2.5.1. North America and Europe Infrared Moisture Sensor Moisture Sensors Market, 2016-2026 (USD Million)
      2. 2.5.2. North America and Europe Infrared Moisture Sensor Moisture Sensors Market, 2016-2026 (K Units)
    6. 2.6. Microwave Moisture Sensor
      1. 2.6.1. North America and Europe Microwave Moisture Sensor Moisture Sensors Market, 2016-2026 (USD Million)
      2. 2.6.2. North America and Europe Microwave Moisture Sensor Moisture Sensors Market, 2016-2026 (K Units)
  3. CHAPTER 3. Moisture Sensors market – Application Analysis
    1. 3.1. North America and Europe Moisture Sensors Market – Application Overview
    2. 3.2. North America and Europe Moisture Sensors Market Share, by Application, 2019 & 2026 (USD Million)
    3. 3.3. North America and Europe Moisture Sensors Market share, by Application, 2019 & 2026 (K Units)
    4. 3.4. Food Processing
      1. 3.4.1. North America and Europe Food Processing Moisture Sensors Market, 2016-2026 (USD Million)
      2. 3.4.2. North America and Europe Food Processing Moisture Sensors Market, 2016-2026 (K Units)
    5. 3.5. Pharmaceutical
      1. 3.5.1. North America and Europe Pharmaceutical Moisture Sensors Market, 2016-2026 (USD Million)
      2. 3.5.2. North America and Europe Pharmaceutical Moisture Sensors Market, 2016-2026 (K Units)
    6. 3.6. Environmental
      1. 3.6.1. North America and Europe Environmental Moisture Sensors Market, 2016-2026 (USD Million)
      2. 3.6.2. North America and Europe Environmental Moisture Sensors Market, 2016-2026 (K Units)
    7. 3.7. Chemical Industries
      1. 3.7.1. North America and Europe Chemical Industries Moisture Sensors Market, 2016-2026 (USD Million)
      2. 3.7.2. North America and Europe Chemical Industries Moisture Sensors Market, 2016-2026 (K Units)
  4. CHAPTER 4. Moisture Sensors market – Regional Analysis
    1. 4.1. North America and Europe Moisture Sensors Market Regional Overview
    2. 4.2. North America and Europe Moisture Sensors Market Share, by Region, 2019 & 2026 (Value)
    3. 4.3. North America and Europe Moisture Sensors Market Share, by Region, 2019 & 2026 (Volume)
    4. 4.4. North America
      1. 4.4.1. North America Moisture Sensors Market size and forecast, 2016-2026
      2. 4.4.2. North America Moisture Sensors Market, by Country, 2019 - 2026 (USD Million)
      3. 4.4.3. North America Market size and forecast, 2016-2026 (K Units)
      4. 4.4.4. North America Moisture Sensors Market, by Country, 2019 - 2026 (K Units)
      5. 4.4.5. North America Moisture Sensors Market, by Type, 2016-2026
        1. 4.4.5.1. North America Moisture Sensors Market, by Type, 2016-2026 (USD Million)
        2. 4.4.5.2. North America Moisture Sensors Market, by Type, 2016-2026 (K Units)
      6. 4.4.6. North America Moisture Sensors Market, by Application, 2016-2026
        1. 4.4.6.1. North America Moisture Sensors Market, by Application, 2016-2026 (USD Million)
        2. 4.4.6.2. North America Moisture Sensors Market, by Application, 2016-2026 (K Units)
    5. 4.5. Europe
      1. 4.5.1. Europe Moisture Sensors Market size and forecast, 2016-2026
      2. 4.5.2. Europe Moisture Sensors Market, by Country, 2019 - 2026 (USD Million)
      3. 4.5.3. Europe Market size and forecast, 2016-2026 (K Units)
      4. 4.5.4. Europe Moisture Sensors Market, by Country, 2019 - 2026 (K Units)
      5. 4.5.5. Europe Moisture Sensors Market, by Type, 2016-2026
        1. 4.5.5.1. Europe Moisture Sensors Market, by Type, 2016-2026 (USD Million)
        2. 4.5.5.2. Europe Moisture Sensors Market, by Type, 2016-2026 (K Units)
      6. 4.5.6. Europe Moisture Sensors Market, by Application, 2016-2026
        1. 4.5.6.1. Europe Moisture Sensors Market, by Application, 2016-2026 (USD Million)
        2. 4.5.6.2. Europe Moisture Sensors Market, by Application, 2016-2026 (K Units)
  5. CHAPTER 5. Moisture Sensors Production, Consumption, Export, Import by Regions
    1. 5.1. North America and Europe Moisture Sensors production and revenue, 2015-2025 (USD Million) (K Units)
    2. 5.2. North America and Europe Import and Export Analysis, by Region
  6. CHAPTER 6. Moisture Sensors market – Competitive Landscape
    1. 6.1. Competitor Market Share – Revenue
    2. 6.2. Market Concentration Rate Analysis, Top 3 and Top 5 Players
    3. 6.3. Competitor Market Share – Volume
    4. 6.4. Strategic Development
      1. 6.4.1. Acquisitions and Mergers
      2. 6.4.2. New Products
      3. 6.4.3. Research & Development Activities
  7. CHAPTER 7. Company Profiles
    1. 7.1. Hydronix
      1. 7.1.1. Company Overview
      2. 7.1.2. Hydronix Sales, Revenue, Price, and Gross Margin
      3. 7.1.3. Product portfolio
      4. 7.1.4. Recent initiatives
    2. 7.2. Ludwig & Co
      1. 7.2.1. Company Overview
      2. 7.2.2. Ludwig & Co Sales, Revenue, Price, and Gross Margin
      3. 7.2.3. Product portfolio
      4. 7.2.4. Recent initiatives
    3. 7.3. SWR-Engineering
      1. 7.3.1. Company Overview
      2. 7.3.2. SWR-Engineering Sales, Revenue, Price, and Gross Margin
      3. 7.3.3. Product portfolio
      4. 7.3.4. Recent initiatives
    4. 7.4. Sartorius AG
      1. 7.4.1. Company Overview
      2. 7.4.2. Sartorius AG Sales, Revenue, Price, and Gross Margin
      3. 7.4.3. Product portfolio
      4. 7.4.4. Recent initiatives
    5. 7.5. BERTHOLD TECHNOLOGIES GmbH & Company KG
      1. 7.5.1. Company Overview
      2. 7.5.2. BERTHOLD TECHNOLOGIES GmbH & Company KG Sales, Revenue, Price, and Gross Margin
      3. 7.5.3. Product portfolio
      4. 7.5.4. Recent initiatives
    6. 7.6. Muentec Instruments
      1. 7.6.1. Company Overview
      2. 7.6.2. Muentec Instruments Sales, Revenue, Price, and Gross Margin
      3. 7.6.3. Product portfolio
      4. 7.6.4. Recent initiatives
    7. 7.7. Liebherr-International AG
      1. 7.7.1. Company Overview
      2. 7.7.2. Liebherr-International AG Sales, Revenue, Price, and Gross Margin
      3. 7.7.3. Product portfolio
      4. 7.7.4. Recent initiatives
    8. 7.8. Ohaus Corporation
      1. 7.8.1. Company Overview
      2. 7.8.2. Ohaus Corporation Sales, Revenue, Price, and Gross Margin
      3. 7.8.3. Product portfolio
      4. 7.8.4. Recent initiatives
    9. 7.9. Thermo Fisher
      1. 7.9.1. Company Overview
      2. 7.9.2. Thermo Fisher Sales, Revenue, Price, and Gross Margin
      3. 7.9.3. Product portfolio
      4. 7.9.4. Recent initiatives
    10. 7.10. Michell Instruments Ltd
      1. 7.10.1. Company Overview
      2. 7.10.2. Michell Instruments Ltd Sales, Revenue, Price, and Gross Margin
      3. 7.10.3. Product portfolio
      4. 7.10.4. Recent initiatives
    11. 7.11. AMETEK
      1. 7.11.1. Company Overview
      2. 7.11.2. AMETEK Sales, Revenue, Price, and Gross Margin
      3. 7.11.3. Product portfolio
      4. 7.11.4. Recent initiatives
    12. 7.12. General Electric Company
      1. 7.12.1. Company Overview
      2. 7.12.2. General Electric Company Sales, Revenue, Price, and Gross Margin
      3. 7.12.3. Product portfolio
      4. 7.12.4. Recent initiatives
    13. 7.13. CEM Ltd
      1. 7.13.1. Company Overview
      2. 7.13.2. CEM Ltd Sales, Revenue, Price, and Gross Margin
      3. 7.13.3. Product portfolio
      4. 7.13.4. Recent initiatives
    14. 7.14. Sinar Technology
      1. 7.14.1. Company Overview
      2. 7.14.2. Sinar Technology Sales, Revenue, Price, and Gross Margin
      3. 7.14.3. Product portfolio
      4. 7.14.4. Recent initiatives
    15. 7.15. Gow-Mac Instrument Co
      1. 7.15.1. Company Overview
      2. 7.15.2. Gow-Mac Instrument Co Sales, Revenue, Price, and Gross Margin
      3. 7.15.3. Product portfolio
      4. 7.15.4. Recent initiatives
    16. 7.16. Hach
      1. 7.16.1. Company Overview
      2. 7.16.2. Hach Sales, Revenue, Price, and Gross Margin
      3. 7.16.3. Product portfolio
      4. 7.16.4. Recent initiatives
    17. 7.17. Precisa Gravimetrics AG
      1. 7.17.1. Company Overview
      2. 7.17.2. Precisa Gravimetrics AG Sales, Revenue, Price, and Gross Margin
      3. 7.17.3. Product portfolio
      4. 7.17.4. Recent initiatives
    18. 7.18. PCE Instruments
      1. 7.18.1. Company Overview
      2. 7.18.2. PCE Instruments Sales, Revenue, Price, and Gross Margin
      3. 7.18.3. Product portfolio
      4. 7.18.4. Recent initiatives
    19. 7.19. Torbal
      1. 7.19.1. Company Overview
      2. 7.19.2. Torbal Sales, Revenue, Price, and Gross Margin
      3. 7.19.3. Product portfolio
      4. 7.19.4. Recent initiatives
    20. 7.20. Adam Equipment, Inc
      1. 7.20.1. Company Overview
      2. 7.20.2. Adam Equipment, Inc Sales, Revenue, Price, and Gross Margin
      3. 7.20.3. Product portfolio
      4. 7.20.4. Recent initiatives
    21. 7.21. Arizona Instrument LLC
      1. 7.21.1. Company Overview
      2. 7.21.2. Arizona Instrument LLC Sales, Revenue, Price, and Gross Margin
      3. 7.21.3. Product portfolio
      4. 7.21.4. Recent initiatives
  8. CHAPTER 8. Moisture Sensors — Industry Analysis
    1. 8.1. Introduction and Taxonomy
    2. 8.2. Moisture Sensors Market – Key Trends
      1. 8.2.1. Market Drivers
      2. 8.2.2. Market Restraints
      3. 8.2.3. Market Opportunities
    3. 8.3. Value Chain Analysis
    4. 8.4. Key Mandates and Regulations
    5. 8.5. Technology Roadmap and Timeline
    6. 8.6. Moisture Sensors market – Attractiveness Analysis
      1. 8.6.1. By Type
      2. 8.6.2. By Application
      3. 8.6.3. By Region
  9. CHAPTER 9. Raw Material analysis
    1. 9.1. Moisture Sensors Key Raw Material Analysis
      1. 9.1.1. Key Raw Materials
      2. 9.1.2. Price Trend of Key Raw Materials
    2. 9.2. Key Suppliers of Raw Materials
    3. 9.3. Proportion of Manufacturing Cost Structure
      1. 9.3.1. Raw Materials
      2. 9.3.2. Labor Cost
    4. 9.4. Manufacturing Expenses Analysis of Moisture Sensors
  10. CHAPTER 10. Industrial Chain, Sourcing Strategy and Downstream Buyers
    1. 10.1. Moisture Sensors Industrial Chain Analysis
    2. 10.2. Upstream Raw Materials Sourcing
      1. 10.2.1. Risk Mitigation:
      2. 10.2.2. Supplier Relationships:
      3. 10.2.3. Business Processes:
      4. 10.2.4. Securing the Product:
    3. 10.3. Raw Materials Sources of Moisture Sensors Major Manufacturers in 2018
    4. 10.4. Downstream Buyers
    5. 10.5. Distributors/Traders List
  11. CHAPTER 11. Marketing Strategy Analysis, Distributors
    1. 11.1. Marketing Channel
    2. 11.2. Direct Marketing
    3. 11.3. Indirect Marketing
    4. 11.4. Marketing Channel Development Trend
    5. 11.5. Economic/Political Environmental Change
  12. CHAPTER 12. Report Conclusion
  13. CHAPTER 13. Research Approach & Methodology
    1. 13.1. Report Description
    2. 13.2. Research Scope
    3. 13.3. Research Methodology
      1. 13.3.1. Secondary Research
      2. 13.3.2. Primary Research
      3. 13.3.3. Models
        1. 13.3.3.1. Company Share Analysis Model
        2. 13.3.3.2. Revenue Based Modeling
        3. 13.3.3.3. Research Limitations

  • List of Figures

    FIG. 1    North America and Europe Moisture Sensors Market, 2016-2026 (USD Million)
    FIG. 2    North America and Europe Moisture Sensors Market Share, by Type, 2019 & 2026 (USD Million)
    FIG. 3    North America and Europe Moisture Sensors Market share, by Type, 2019 & 2026 (K Units)
    FIG. 4    North America and Europe Halogen Moisture Sensor Moisture Sensors Market, 2016-2026 (USD Million)
    FIG. 5    North America and Europe Halogen Moisture Sensor Moisture Sensors  Market, 2016-2026 (K Units)
    FIG. 6    North America and Europe Infrared Moisture Sensor Moisture Sensors Market, 2016-2026 (USD Million)
    FIG. 7    North America and Europe Infrared Moisture Sensor Moisture Sensors  Market, 2016-2026 (K Units)
    FIG. 8    North America and Europe Microwave Moisture Sensor Moisture Sensors Market, 2016-2026 (USD Million)
    FIG. 9    North America and Europe Microwave Moisture Sensor Moisture Sensors  Market, 2016-2026 (K Units)
    FIG. 10    North America and Europe Moisture Sensors Market Share, by Application, 2019 & 2026 (USD Million)
    FIG. 11    North America and Europe Moisture Sensors Market share, by Application, 2019 & 2026 (K Units)
    FIG. 12    North America and Europe Food Processing Moisture Sensors Market, 2016-2026 (USD Million)
    FIG. 13    North America and Europe Food Processing Moisture Sensors  Market, 2016-2026 (K Units)
    FIG. 14    North America and Europe Pharmaceutical Moisture Sensors Market, 2016-2026 (USD Million)
    FIG. 15    North America and Europe Pharmaceutical Moisture Sensors  Market, 2016-2026 (K Units)
    FIG. 16    North America and Europe Environmental Moisture Sensors Market, 2016-2026 (USD Million)
    FIG. 17    North America and Europe Environmental Moisture Sensors  Market, 2016-2026 (K Units)
    FIG. 18    North America and Europe Chemical Industries Moisture Sensors Market, 2016-2026 (USD Million)
    FIG. 19    North America and Europe Chemical Industries Moisture Sensors  Market, 2016-2026 (K Units)
    FIG. 20    North America and Europe Moisture Sensors Market Share, by Region, 2019 & 2026
    FIG. 21    North America and Europe Moisture Sensors Market Share, by Region, 2019 & 2026
    FIG. 22    North America Moisture Sensors Market, 2016-2026
    FIG. 23    North America Moisture Sensors  Market, 2016-2026 (K Units)
    FIG. 24    Europe Moisture Sensors Market, 2016-2026
    FIG. 25    Europe Moisture Sensors  Market, 2016-2026 (K Units)
    FIG. 26    North America and Europe Moisture Sensors production and revenue, 2015-2025 (USD Million) (K Units)
    FIG. 27    North America Moisture Sensors production and revenue, 2015-2025 (USD Million) (K Units)
    FIG. 28    Europe Moisture Sensors production and revenue, 2015-2025 (USD Million) (K Units)
    FIG. 29    Asia Pacific Moisture Sensors production and revenue, 2015-2025 (USD Million) (K Units)
    FIG. 30    Latin America Moisture Sensors production and revenue, 2015-2025 (USD Million) (K Units)
    FIG. 31    Middle East and Africa Moisture Sensors production and revenue, 2015-2025 (USD Million) (K Units)
    FIG. 32    Competitor Market Share – Revenue
    FIG. 33    Competitor Market Share – Volume
    FIG. 34    Hydronix Revenue and Growth Rate
    FIG. 35    Hydronix Market Share
    FIG. 36    Ludwig & Co Revenue and Growth Rate
    FIG. 37    Ludwig & Co Market Share
    FIG. 38    SWR-Engineering Revenue and Growth Rate
    FIG. 39    SWR-Engineering Market Share
    FIG. 40    Sartorius AG Revenue and Growth Rate
    FIG. 41    Sartorius AG Market Share
    FIG. 42    BERTHOLD TECHNOLOGIES GmbH & Company KG Revenue and Growth Rate
    FIG. 43    BERTHOLD TECHNOLOGIES GmbH & Company KG Market Share
    FIG. 44    Muentec Instruments Revenue and Growth Rate
    FIG. 45    Muentec Instruments Market Share
    FIG. 46    Liebherr-International AG Revenue and Growth Rate
    FIG. 47    Liebherr-International AG Market Share
    FIG. 48    Ohaus Corporation Revenue and Growth Rate
    FIG. 49    Ohaus Corporation Market Share
    FIG. 50    Thermo Fisher Revenue and Growth Rate
    FIG. 51    Thermo Fisher Market Share
    FIG. 52    Michell Instruments Ltd Revenue and Growth Rate
    FIG. 53    Michell Instruments Ltd Market Share
    FIG. 54    AMETEK Revenue and Growth Rate
    FIG. 55    AMETEK Market Share
    FIG. 56    General Electric Company Revenue and Growth Rate
    FIG. 57    General Electric Company Market Share
    FIG. 58    CEM Ltd Revenue and Growth Rate
    FIG. 59    CEM Ltd Market Share
    FIG. 60    Sinar Technology Revenue and Growth Rate
    FIG. 61    Sinar Technology Market Share
    FIG. 62    Gow-Mac Instrument Co Revenue and Growth Rate
    FIG. 63    Gow-Mac Instrument Co Market Share
    FIG. 64    Hach Revenue and Growth Rate
    FIG. 65    Hach Market Share
    FIG. 66    Precisa Gravimetrics AG Revenue and Growth Rate
    FIG. 67    Precisa Gravimetrics AG Market Share
    FIG. 68    PCE Instruments Revenue and Growth Rate
    FIG. 69    PCE Instruments Market Share
    FIG. 70    Torbal Revenue and Growth Rate
    FIG. 71    Torbal Market Share
    FIG. 72    Adam Equipment, Inc Revenue and Growth Rate
    FIG. 73    Adam Equipment, Inc Market Share
    FIG. 74    Arizona Instrument LLC Revenue and Growth Rate
    FIG. 75    Arizona Instrument LLC Market Share
    FIG. 76    Market Dynamics
    FIG. 77    North America and Europe Moisture Sensors – Value Chain Analysis
    FIG. 78    Key Mandates and Regulations
    FIG. 79    Technology Roadmap and Timeline
    FIG. 80    Market Attractiveness Analysis – By Type
    FIG. 81    Market Attractiveness Analysis – By Application
    FIG. 82    Market Attractiveness Analysis – By Region
    FIG. 83    Manufacturing Cost Structure of Moisture Sensors
    FIG. 84    Moisture Sensors Industrial Chain Analysis
    FIG. 85    Market Channel
    FIG. 86    Marketing Channel Development Trend
    FIG. 87    Growth in World Gross Product, 2008-2018


    List of Tables

    TABLE 1    North America and Europe Moisture Sensors market, 2019 & 2026 (USD Million)
    TABLE 2    North America and Europe Moisture Sensors market, by Type, 2016-2026 (USD Million)
    TABLE 3    North America and Europe Moisture Sensors market, by Type, 2016-2026 (K Units)
    TABLE 4    North America and Europe Moisture Sensors market, by Application, 2016-2026 (USD Million)
    TABLE 5    North America and Europe Moisture Sensors market, by Application, 2016-2026 (K Units)
    TABLE 6    North America and Europe Moisture Sensors market, by region, 2016-2026 (USD Million)
    TABLE 7    North America and Europe Moisture Sensors market, by region, 2016-2026 (K Units)
    TABLE 8    North America Moisture Sensors Market, by Type, 2016-2026 (USD Million)
    TABLE 9    North America Moisture Sensors Market, by Type, 2016-2026 (K Units)
    TABLE 10    North America Moisture Sensors Market, by Application, 2016-2026 (USD Million)
    TABLE 11    North America Moisture Sensors Market, by Application, 2016-2026 (K Units)
    TABLE 12    Europe Moisture Sensors Market, by Type, 2016-2026 (USD Million)
    TABLE 13    Europe Moisture Sensors Market, by Type, 2016-2026 (K Units)
    TABLE 14    Europe Moisture Sensors Market, by Application, 2016-2026 (USD Million)
    TABLE 15    Europe Moisture Sensors Market, by Application, 2016-2026 (K Units)
    TABLE 16    North America Moisture Sensors Production, Consumption, Export, Import, 2016-2019
    TABLE 17    Europe Moisture Sensors Production, Consumption, Export, Import, 2016-2019
    TABLE 18    Asia Pacific Moisture Sensors Production, Consumption, Export, Import, 2016-2019
    TABLE 19    Latin America Moisture Sensors Production, Consumption, Export, Import, 2016-2019
    TABLE 20    Middle East & Africa Moisture Sensors Production, Consumption, Export, Import, 2016-2019
    TABLE 21    North America and Europe Moisture Sensors Market - Company Revenue Analysis 2016-2019 (USD Million)
    TABLE 22    North America and Europe Moisture Sensors Market - Company Revenue Share Analysis 2016-2019(%)
    TABLE 23    North America and Europe Moisture Sensors Market - Company Volume Analysis 2016-2019 (K Units)
    TABLE 24    North America and Europe Moisture Sensors Market - Company Volume Share Analysis 2016-2019(%)
    TABLE 25    Acquisitions and Mergers
    TABLE 26    New Product/Service Launch
    TABLE 27    Research & Development Activities
    TABLE 28    Market Drivers
    TABLE 29    Market Restraints
    TABLE 30    Market Opportunities
    TABLE 31    Production Base and Market Concentration Rate of Raw Material
    TABLE 32    Key Suppliers of Raw Materials
    TABLE 33    Raw Materials Sources of Moisture Sensors Major Manufacturers in 2018
    TABLE 34    Major Buyers of Moisture Sensors
    TABLE 35    Distributors/Traders of Moisture Sensors by Region

  •  

    Industry Major Market Players

    • Hydronix
    • Ludwig & Co
    • SWR-Engineering
    • Sartorius AG
    • BERTHOLD TECHNOLOGIES GmbH & Company KG
    • Muentec Instruments
    • Liebherr-International AG
    • Ohaus Corporation
    • Thermo Fisher
    • Michell Instruments Ltd
    • AMETEK
    • General Electric Company
    • CEM Ltd
    • Sinar Technology
    • Gow-Mac Instrument Co
    • Hach
    • Precisa Gravimetrics AG
    • PCE Instruments
    • Torbal
    • Adam Equipment Inc
    • Arizona Instrument LLC