Search Market Research Report

Discover Our Latest Reports
Discover Our Featured Reports
Discover Top Selling Reports

Military Vehicle Electrification Market Size, Share Global Analysis Report, 2021 – 2026

report img

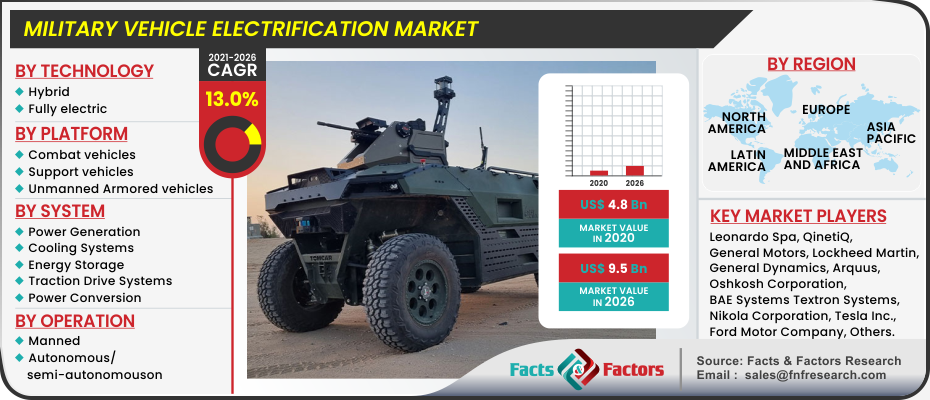
Military Vehicle Electrification Market By Technology (Hybrid, Fully electric), By Platform (Combat Vehicles, Support Vehicles, and Unmanned Armoured Vehicles), By System (Power Generation, Cooling Systems, Energy Storage, Traction Drive Systems, and Power Conversion), and By Operation (Manned, and Autonomous/Semi-autonomous): Global & Regional Industry Perspective, Comprehensive Analysis, and Forecast 2021 – 2026

Industry Insights

[197+ Pages Report] The global military vehicle electrification market was worth around USD 4.8 Billion in 2020, according to a Facts and Factors industry research analysis. It is expected to reach USD 9.5 Billion by 2026, with a CAGR of 13.0% throughout the forecast period.

logoMarket Overview

Electric vehicles have the potential to minimize the Army's reliance on liquid fuels, improve signature management through silent operations, and provide exportable power. Electrification technologies are being developed by armies all around the world and could soon be integrated into their fleets of tactical wheeled vehicles. Countries around the world are investing hugely in research & development of electric military vehicles to acquire stealth, swift and powerful features to their military hardware. The electronic warfare is entering new dimensions every year and hardware electrification is the need of the hour for many armies to attain tactical edge over their respective adversaries.

Military Vehicle Electrification Market

To know more about this report | Request Free Sample Copy

logoIndustry Growth Factors

The market for military vehicle electrification is growing as the concept of alternative energy sources such as batteries and fuel cells gains traction. This necessitates a strong relationship between governments and private sector entities, which should be evident during the projection period. The new emergent security challenges around the world are transnational in character, necessitating a coordinated international response. In this highly competitive economic environment, industries with a global presence and collaborations with local and international military vehicle industry participants and governments are expected to gain. Companies seeking to expand in this industry must be able to detect changing trends in threats and the technologies required to combat them, as well as provide comprehensive solutions that encompass services and equipment for military vehicle electrification.

R&D in military vehicle electrification is continually evolving, and given the current situation, countries lowering their defense budgets may be a barrier to the advancement of this technology. Due to import and export laws, manufacturing activities have suffered operational and operating issues. Controlling the COVID-19 outbreak is currently a global problem and a critical task in many nations.

logoGlobal Military Vehicle Electrification Market: Segmentations

The global military vehicle electrification market has been segmented into technology, platform, system, and operation. Based on technology, the market has been categorized into hybrid, and fully electric. Based on the platform, the market is bifurcated into combat vehicles, support vehicles, and unmanned armoured vehicles. The unmanned armoured vehicle segment is expected to expand at the fastest CAGR during the projection period, based on platform. The Military Vehicle Electrification market is predicted to grow at a proportionately faster rate than the other two platforms. During the projected period, the demand for military vehicle electrification in combat and support vehicles is expected to be similar. On the basis of System, the market is categorized into power generation, cooling systems, energy storage, traction drive systems, and power conversion. The power generating segment is expected to expand at the fastest CAGR during the forecast period, according to systems. The military vehicle electrification market is expected to rise in response to rising demand for power systems as a result of the integration of new technologies and increased power requirements in vehicles. In terms of operation, the market has been segmented manned, and autonomous/semi-autonomous. The autonomous/semi-autonomous military vehicle segment is expected to develop at the fastest CAGR throughout the forecast period.

logoGlobal Military Vehicle Electrification Market: Regional Analysis

Based on regions, the global military vehicle electrification market can be divided into five main regions namely, North America, Europe, Latin America, Asia Pacific, and The Middle East and Africa.

During the forecast period, the Asia Pacific military vehicle electrification market is expected to develop at the fastest rate. The market is growing due to a growing focus on increasing expenditure on military vehicle acquisition by major economies in the area. Furthermore, factors such as rising geopolitical tensions and increased defense-related spending are projected to fuel demand for military vehicle electrification in the region.

Due to growing expenditures in military vehicle electrification technologies by nations in this area, the military vehicle electrification market in North America is likely to rise significantly during the forecast period. European defence ministries are active in the creation of technologically advanced military vehicles as well as the acquisition of new vehicles to expand their fleet size.

logoGlobal Military Vehicle Electrification Market: Competitive Players

logoReport Scope

Report Attribute

Details

Market Size in 2020

USD 4.8 Billion

Projected Market Size in 2026

USD 9.5 Billion

Growth Rate

CAGR 13.0%

Base Year

2020

Forecast Years

2021-2026

Key Market Players

Leonardo Spa, QinetiQ, General Motors, General Dynamics, Arquus, Oshkosh Corporation, BAE Systems Textron Systems, Nikola Corporation, Krauss-Maffei Wegmann GmbH and Co. KG, AeroVironment, Ford Motor Company, Tesla Inc., Lockheed Martin, Milrem Robotics, and Alke among others.

Key Segment

By Technology, By Platform, By System, By Operation

Major Regions Covered

North America, Europe, Asia Pacific, Latin America, and the Middle East & Africa

Purchase Options

Request customized purchase options to meet your research needs. Explore purchase options

logoSome of the key players in the military vehicle electrification market are

  • Leonardo Spa
  • QinetiQ
  • General Motors
  • General Dynamics
  • Arquus
  • Oshkosh Corporation
  • BAE Systems Textron Systems
  • Nikola Corporation
  • Krauss-Maffei Wegmann GmbH and Co. KG
  • AeroVironment
  • Ford Motor Company
  • Tesla Inc.
  • Lockheed Martin
  • Milrem Robotics
  • Alke

logoBy Technology:

  • Hybrid
  • Fully electric

logoBy Platform:

  • Combat vehicles
  • Support vehicles
  • Unmanned Armored vehicles

logoBy System:

  • Power Generation
  • Cooling Systems
  • Energy Storage
  • Traction Drive Systems
  • Power Conversion

logoBy Operation:

  • Manned
  • Autonomous/semi-autonomous

logoBy Region:

  • North America
    • The U.S.
    • Canada
  • Europe
    • The UK
    • France
    • Germany
    • Italy
    • Spain
    • Rest of Europe
  • Asia Pacific
    • China
    • Japan
    • India
    • South Korea
    • Southeast Asia
    • Rest of Asia Pacific
  • Latin America
    • Brazil
    • Mexico
    • Rest of Latin America
  • Middle East & Africa
    • GCC Countries
    • South Africa
    • Rest of Middle East & Africa

Table of Content

  1. Chapter 1 Executive Summary
    1. 1.1. Introduction of Military Vehicle Electrification
    2. 1.2. Global Military Vehicle Electrification Market, 2020 & 2026 (USD Million)
    3. 1.3. Global Military Vehicle Electrification Market, 2016 – 2026 (USD Million)
    4. 1.4. Global Military Vehicle Electrification Market Absolute Revenue Opportunity, 2016 – 2026 (USD Million)
    5. 1.5. Global Military Vehicle Electrification Market Incremental Revenue Opportunity, 2020 – 2026 (USD Million)
  2. Chapter 2 Military Vehicle Electrification Market – Technology Analysis
    1. 2.1. Global Military Vehicle Electrification Market – Technology Overview
    2. 2.2. Global Military Vehicle Electrification Market Share, by Technology, 2020 & 2026 (USD Million)
    3. 2.3. Hybrid
      1. 2.3.1. Global Hybrid Military Vehicle Electrification Market, 2016 – 2026 (USD Million)
    4. 2.4. Fully Electric
      1. 2.4.1. Global Fully Electric Military Vehicle Electrification Market, 2016 – 2026 (USD Million)
  3. Chapter 3 Military Vehicle Electrification Market – Platform Analysis
    1. 3.1. Global Military Vehicle Electrification Market – Platform Overview
    2. 3.2. Global Military Vehicle Electrification Market Share, by Platform, 2020 & 2026 (USD Million)
    3. 3.3. Combat Vehicles
      1. 3.3.1. Global Combat Vehicles Military Vehicle Electrification Market, 2016 – 2026 (USD Million)
    4. 3.4. Support Vehicles
      1. 3.4.1. Global Support Vehicles Military Vehicle Electrification Market, 2016 – 2026 (USD Million)
    5. 3.5. Unmanned Armoured Vehicles
      1. 3.5.1. Global Unmanned Armoured Vehicles Military Vehicle Electrification Market, 2016 – 2026 (USD Million)
  4. Chapter 4 Military Vehicle Electrification Market – System Analysis
    1. 4.1. Global Military Vehicle Electrification Market – System Overview
    2. 4.2. Global Military Vehicle Electrification Market Share, by System, 2020 & 2026 (USD Million)
    3. 4.3. Power Generation
      1. 4.3.1. Global Power Generation Military Vehicle Electrification Market, 2016 – 2026 (USD Million)
    4. 4.4. Cooling Systems
      1. 4.4.1. Global Cooling Systems Military Vehicle Electrification Market, 2016 – 2026 (USD Million)
    5. 4.5. Energy Storage
      1. 4.5.1. Global Energy Storage Military Vehicle Electrification Market, 2016 – 2026 (USD Million)
    6. 4.6. Traction Drive Systems
      1. 4.6.1. Global Traction Drive Systems Military Vehicle Electrification Market, 2016 – 2026 (USD Million)
    7. 4.7. Power Conversion
      1. 4.7.1. Global Power Conversion Military Vehicle Electrification Market, 2016 – 2026 (USD Million)
  5. Chapter 5 Military Vehicle Electrification Market – Operation Analysis
    1. 5.1. Global Military Vehicle Electrification Market – Operation Overview
    2. 5.2. Global Military Vehicle Electrification Market Share, by Operation, 2020 & 2026 (USD Million)
    3. 5.3. Manned
      1. 5.3.1. Global Manned Military Vehicle Electrification Market, 2016 – 2026 (USD Million)
    4. 5.4. Autonomous/Semi-autonomous
      1. 5.4.1. Global Autonomous/Semi-autonomous Military Vehicle Electrification Market, 2016 – 2026 (USD Million)
  6. Chapter 6 Military Vehicle Electrification Market – Regional Analysis
    1. 6.1. Global Military Vehicle Electrification Market Regional Overview
    2. 6.2. Global Military Vehicle Electrification Market Share, by Region, 2020 & 2026 (USD Million)
    3. 6.3. North America
      1. 6.3.1. North America Military Vehicle Electrification Market, 2016 – 2026 (USD Million)
        1. 6.3.1.1. North America Military Vehicle Electrification Market, by Country, 2016 - 2026 (USD Million)
      2. 6.3.2. North America Military Vehicle Electrification Market, by Technology, 2016 – 2026
        1. 6.3.2.1. North America Military Vehicle Electrification Market, by Technology, 2016 – 2026 (USD Million)
      3. 6.3.3. North America Military Vehicle Electrification Market, by Platform, 2016 – 2026
        1. 6.3.3.1. North America Military Vehicle Electrification Market, by Platform, 2016 – 2026 (USD Million)
      4. 6.3.4. North America Military Vehicle Electrification Market, by System, 2016 – 2026
        1. 6.3.4.1. North America Military Vehicle Electrification Market, by System, 2016 – 2026 (USD Million)
      5. 6.3.5. North America Military Vehicle Electrification Market, by Operation, 2016 – 2026
        1. 6.3.5.1. North America Military Vehicle Electrification Market, by Operation, 2016 – 2026 (USD Million)
      6. 6.3.6. U.S.
        1. 6.3.6.1. U.S. Military Vehicle Electrification Market, 2016 – 2026 (USD Million)
      7. 6.3.7. Canada
        1. 6.3.7.1. Canada Military Vehicle Electrification Market, 2016 – 2026 (USD Million)
    4. 6.4. Europe
      1. 6.4.1. Europe Military Vehicle Electrification Market, 2016 – 2026 (USD Million)
        1. 6.4.1.1. Europe Military Vehicle Electrification Market, by Country, 2016 - 2026 (USD Million)
      2. 6.4.2. Europe Military Vehicle Electrification Market, by Technology, 2016 – 2026
        1. 6.4.2.1. Europe Military Vehicle Electrification Market, by Technology, 2016 – 2026 (USD Million)
      3. 6.4.3. Europe Military Vehicle Electrification Market, by Platform, 2016 – 2026
        1. 6.4.3.1. Europe Military Vehicle Electrification Market, by Platform, 2016 – 2026 (USD Million)
      4. 6.4.4. Europe Military Vehicle Electrification Market, by System, 2016 – 2026
        1. 6.4.4.1. Europe Military Vehicle Electrification Market, by System, 2016 – 2026 (USD Million)
      5. 6.4.5. Europe Military Vehicle Electrification Market, by Operation, 2016 – 2026
        1. 6.4.5.1. Europe Military Vehicle Electrification Market, by Operation, 2016 – 2026 (USD Million)
      6. 6.4.6. Germany
        1. 6.4.6.1. Germany Military Vehicle Electrification Market, 2016 – 2026 (USD Million)
      7. 6.4.7. France
        1. 6.4.7.1. France Military Vehicle Electrification Market, 2016 – 2026 (USD Million)
      8. 6.4.8. U.K.
        1. 6.4.8.1. U.K. Military Vehicle Electrification Market, 2016 – 2026 (USD Million)
      9. 6.4.9. Italy
        1. 6.4.9.1. Italy Military Vehicle Electrification Market, 2016 – 2026 (USD Million)
      10. 6.4.10. Spain
        1. 6.4.10.1. Spain Military Vehicle Electrification Market, 2016 – 2026 (USD Million)
      11. 6.4.11. Rest of Europe
        1. 6.4.11.1. Rest of Europe Military Vehicle Electrification Market, 2016 – 2026 (USD Million)
    5. 6.5. Asia Pacific
      1. 6.5.1. Asia Pacific Military Vehicle Electrification Market, 2016 – 2026 (USD Million)
        1. 6.5.1.1. Asia Pacific Military Vehicle Electrification Market, by Country, 2016 - 2026 (USD Million)
      2. 6.5.2. Asia Pacific Military Vehicle Electrification Market, by Technology, 2016 – 2026
        1. 6.5.2.1. Asia Pacific Military Vehicle Electrification Market, by Technology, 2016 – 2026 (USD Million)
      3. 6.5.3. Asia Pacific Military Vehicle Electrification Market, by Platform, 2016 – 2026
        1. 6.5.3.1. Asia Pacific Military Vehicle Electrification Market, by Platform, 2016 – 2026 (USD Million)
      4. 6.5.4. Asia Pacific Military Vehicle Electrification Market, by System, 2016 – 2026
        1. 6.5.4.1. Asia Pacific Military Vehicle Electrification Market, by System, 2016 – 2026 (USD Million)
      5. 6.5.5. Asia Pacific Military Vehicle Electrification Market, by Operation, 2016 – 2026
        1. 6.5.5.1. Asia Pacific Military Vehicle Electrification Market, by Operation, 2016 – 2026 (USD Million)
      6. 6.5.6. China
        1. 6.5.6.1. China Military Vehicle Electrification Market, 2016 – 2026 (USD Million)
      7. 6.5.7. Japan
        1. 6.5.7.1. Japan Military Vehicle Electrification Market, 2016 – 2026 (USD Million)
      8. 6.5.8. India
        1. 6.5.8.1. India Military Vehicle Electrification Market, 2016 – 2026 (USD Million)
      9. 6.5.9. South Korea
        1. 6.5.9.1. South Korea Military Vehicle Electrification Market, 2016 – 2026 (USD Million)
      10. 6.5.10. South-East Asia
        1. 6.5.10.1. South-East Asia Military Vehicle Electrification Market, 2016 – 2026 (USD Million)
      11. 6.5.11. Rest of Asia Pacific
        1. 6.5.11.1. Rest of Asia Pacific Military Vehicle Electrification Market, 2016 – 2026 (USD Million)
    6. 6.6. Latin America
      1. 6.6.1. Latin America Military Vehicle Electrification Market, 2016 – 2026 (USD Million)
        1. 6.6.1.1. Latin America Military Vehicle Electrification Market, by Country, 2016 - 2026 (USD Million)
      2. 6.6.2. Latin America Military Vehicle Electrification Market, by Technology, 2016 – 2026
        1. 6.6.2.1. Latin America Military Vehicle Electrification Market, by Technology, 2016 – 2026 (USD Million)
      3. 6.6.3. Latin America Military Vehicle Electrification Market, by Platform, 2016 – 2026
        1. 6.6.3.1. Latin America Military Vehicle Electrification Market, by Platform, 2016 – 2026 (USD Million)
      4. 6.6.4. Latin America Military Vehicle Electrification Market, by System, 2016 – 2026
        1. 6.6.4.1. Latin America Military Vehicle Electrification Market, by System, 2016 – 2026 (USD Million)
      5. 6.6.5. Latin America Military Vehicle Electrification Market, by Operation, 2016 – 2026
        1. 6.6.5.1. Latin America Military Vehicle Electrification Market, by Operation, 2016 – 2026 (USD Million)
      6. 6.6.6. Brazil
        1. 6.6.6.1. Brazil Military Vehicle Electrification Market, 2016 – 2026 (USD Million)
      7. 6.6.7. Mexico
        1. 6.6.7.1. Mexico Military Vehicle Electrification Market, 2016 – 2026 (USD Million)
      8. 6.6.8. Rest of Latin America
        1. 6.6.8.1. Rest of Latin America Military Vehicle Electrification Market, 2016 – 2026 (USD Million)
    7. 6.7. The Middle-East and Africa
      1. 6.7.1. The Middle-East and Africa Military Vehicle Electrification Market, 2016 – 2026 (USD Million)
        1. 6.7.1.1. The Middle-East and Africa Military Vehicle Electrification Market, by Country, 2016 - 2026 (USD Million)
      2. 6.7.2. The Middle-East and Africa Military Vehicle Electrification Market, by Technology, 2016 – 2026
        1. 6.7.2.1. The Middle-East and Africa Military Vehicle Electrification Market, by Technology, 2016 – 2026 (USD Million)
      3. 6.7.3. The Middle-East and Africa Military Vehicle Electrification Market, by Platform, 2016 – 2026
        1. 6.7.3.1. The Middle-East and Africa Military Vehicle Electrification Market, by Platform, 2016 – 2026 (USD Million)
      4. 6.7.4. The Middle-East and Africa Military Vehicle Electrification Market, by System, 2016 – 2026
        1. 6.7.4.1. The Middle-East and Africa Military Vehicle Electrification Market, by System, 2016 – 2026 (USD Million)
      5. 6.7.5. The Middle-East and Africa Military Vehicle Electrification Market, by Operation, 2016 – 2026
        1. 6.7.5.1. The Middle-East and Africa Military Vehicle Electrification Market, by Operation, 2016 – 2026 (USD Million)
      6. 6.7.6. GCC Countries
        1. 6.7.6.1. GCC Countries Military Vehicle Electrification Market, 2016 – 2026 (USD Million)
      7. 6.7.7. South Africa
        1. 6.7.7.1. South Africa Military Vehicle Electrification Market, 2016 – 2026 (USD Million)
      8. 6.7.8. Rest of Middle-East Africa
        1. 6.7.8.1. Rest of Middle-East Africa Military Vehicle Electrification Market, 2016 – 2026 (USD Million)
  7. Chapter 7 Military Vehicle Electrification Market – Competitive Landscape
    1. 7.1. Competitor Market Share – Revenue
    2. 7.2. Market Concentration Rate Analysis, Top 3 and Top 5 Players
    3. 7.3. Strategic Developments
      1. 7.3.1. Acquisitions and Mergers
      2. 7.3.2. New Products
      3. 7.3.3. Research & Development Activities
  8. Chapter 8 Company Profiles
    1. 8.1. Leonardo Spa
      1. 8.1.1. Company Overview
      2. 8.1.2. Product/Service Portfolio
      3. 8.1.3. Leonardo Spa Sales, Revenue, and Gross Margin
      4. 8.1.4. Leonardo Spa Revenue and Growth Rate
      5. 8.1.5. Leonardo Spa Market Share
      6. 8.1.6. Recent Initiatives, Funding/VC Activities, and Technological Innovations
    2. 8.2. QinetiQ
      1. 8.2.1. Company Overview
      2. 8.2.2. Product/Service Portfolio
      3. 8.2.3. QinetiQ Sales, Revenue, and Gross Margin
      4. 8.2.4. QinetiQ Revenue and Growth Rate
      5. 8.2.5. QinetiQ Market Share
      6. 8.2.6. Recent Initiatives, Funding/VC Activities, and Technological Innovations
    3. 8.3. General Motors
      1. 8.3.1. Company Overview
      2. 8.3.2. Product/Service Portfolio
      3. 8.3.3. General Motors Sales, Revenue, and Gross Margin
      4. 8.3.4. General Motors Revenue and Growth Rate
      5. 8.3.5. General Motors Market Share
      6. 8.3.6. Recent Initiatives, Funding/VC Activities, and Technological Innovations
    4. 8.4. General Dynamics
      1. 8.4.1. Company Overview
      2. 8.4.2. Product/Service Portfolio
      3. 8.4.3. General Dynamics Sales, Revenue, and Gross Margin
      4. 8.4.4. General Dynamics Revenue and Growth Rate
      5. 8.4.5. General Dynamics Market Share
      6. 8.4.6. Recent Initiatives, Funding/VC Activities, and Technological Innovations
    5. 8.5. Arquus
      1. 8.5.1. Company Overview
      2. 8.5.2. Product/Service Portfolio
      3. 8.5.3. Arquus Sales, Revenue, and Gross Margin
      4. 8.5.4. Arquus Revenue and Growth Rate
      5. 8.5.5. Arquus Market Share
      6. 8.5.6. Recent Initiatives, Funding/VC Activities, and Technological Innovations
    6. 8.6. Oshkosh Corporation
      1. 8.6.1. Company Overview
      2. 8.6.2. Product/Service Portfolio
      3. 8.6.3. Oshkosh Corporation Sales, Revenue, and Gross Margin
      4. 8.6.4. Oshkosh Corporation Revenue and Growth Rate
      5. 8.6.5. Oshkosh Corporation Market Share
      6. 8.6.6. Recent Initiatives, Funding/VC Activities, and Technological Innovations
    7. 8.7. BAE Systems
      1. 8.7.1. Company Overview
      2. 8.7.2. Product/Service Portfolio
      3. 8.7.3. BAE Systems Sales, Revenue, and Gross Margin
      4. 8.7.4. BAE Systems Revenue and Growth Rate
      5. 8.7.5. BAE Systems Market Share
      6. 8.7.6. Recent Initiatives, Funding/VC Activities, and Technological Innovations
    8. 8.8. Textron Systems
      1. 8.8.1. Company Overview
      2. 8.8.2. Product/Service Portfolio
      3. 8.8.3. Textron Systems Sales, Revenue, and Gross Margin
      4. 8.8.4. Textron Systems Revenue and Growth Rate
      5. 8.8.5. Textron Systems Market Share
      6. 8.8.6. Recent Initiatives, Funding/VC Activities, and Technological Innovations
    9. 8.9. Nikola Corporation
      1. 8.9.1. Company Overview
      2. 8.9.2. Product/Service Portfolio
      3. 8.9.3. Nikola Corporation Sales, Revenue, and Gross Margin
      4. 8.9.4. Nikola Corporation Revenue and Growth Rate
      5. 8.9.5. Nikola Corporation Market Share
      6. 8.9.6. Recent Initiatives, Funding/VC Activities, and Technological Innovations
    10. 8.10. Krauss-Maffei Wegmann GmbH and Co. KG
      1. 8.10.1. Company Overview
      2. 8.10.2. Product/Service Portfolio
      3. 8.10.3. Krauss-Maffei Wegmann GmbH and Co. KG Sales, Revenue, and Gross Margin
      4. 8.10.4. Krauss-Maffei Wegmann GmbH and Co. KG Revenue and Growth Rate
      5. 8.10.5. Krauss-Maffei Wegmann GmbH and Co. KG Market Share
      6. 8.10.6. Recent Initiatives, Funding/VC Activities, and Technological Innovations
    11. 8.11. AeroVironment
      1. 8.11.1. Company Overview
      2. 8.11.2. Product/Service Portfolio
      3. 8.11.3. AeroVironment Sales, Revenue, and Gross Margin
      4. 8.11.4. AeroVironment Revenue and Growth Rate
      5. 8.11.5. AeroVironment Market Share
      6. 8.11.6. Recent Initiatives, Funding/VC Activities, and Technological Innovations
    12. 8.12. Ford Motor Company
      1. 8.12.1. Company Overview
      2. 8.12.2. Product/Service Portfolio
      3. 8.12.3. Ford Motor Company Sales, Revenue, and Gross Margin
      4. 8.12.4. Ford Motor Company Revenue and Growth Rate
      5. 8.12.5. Ford Motor Company Market Share
      6. 8.12.6. Recent Initiatives, Funding/VC Activities, and Technological Innovations
    13. 8.13. Tesla Inc.
      1. 8.13.1. Company Overview
      2. 8.13.2. Product/Service Portfolio
      3. 8.13.3. Tesla Inc. Sales, Revenue, and Gross Margin
      4. 8.13.4. Tesla Inc. Revenue and Growth Rate
      5. 8.13.5. Tesla Inc. Market Share
      6. 8.13.6. Recent Initiatives, Funding/VC Activities, and Technological Innovations
    14. 8.14. Lockheed Martin
      1. 8.14.1. Company Overview
      2. 8.14.2. Product/Service Portfolio
      3. 8.14.3. Lockheed Martin Sales, Revenue, and Gross Margin
      4. 8.14.4. Lockheed Martin Revenue and Growth Rate
      5. 8.14.5. Lockheed Martin Market Share
      6. 8.14.6. Recent Initiatives, Funding/VC Activities, and Technological Innovations
    15. 8.15. Milrem Robotics
      1. 8.15.1. Company Overview
      2. 8.15.2. Product/Service Portfolio
      3. 8.15.3. Milrem Robotics Sales, Revenue, and Gross Margin
      4. 8.15.4. Milrem Robotics Revenue and Growth Rate
      5. 8.15.5. Milrem Robotics Market Share
      6. 8.15.6. Recent Initiatives, Funding/VC Activities, and Technological Innovations
    16. 8.16. Alke
      1. 8.16.1. Company Overview
      2. 8.16.2. Product/Service Portfolio
      3. 8.16.3. Alke Sales, Revenue, and Gross Margin
      4. 8.16.4. Alke Revenue and Growth Rate
      5. 8.16.5. Alke Market Share
      6. 8.16.6. Recent Initiatives, Funding/VC Activities, and Technological Innovations
  9. Chapter 9 Military Vehicle Electrification — Industry Analysis
    1. 9.1. Introduction and Taxonomy
    2. 9.2. Military Vehicle Electrification Market – Key Trends
      1. 9.2.1. Market Drivers
      2. 9.2.2. Market Restraints
      3. 9.2.3. Market Opportunities
    3. 9.3. Value Chain Analysis
    4. 9.4. Key Mandates and Regulations
    5. 9.5. Technology Roadmap and Timeline
    6. 9.6. Military Vehicle Electrification Market – Attractiveness Analysis
      1. 9.6.1. By Technology
      2. 9.6.2. By Platform
      3. 9.6.3. By System
      4. 9.6.4. By Operation
      5. 9.6.5. By Region
  10. Chapter 10 Industrial Chain, Sourcing Strategy, and Downstream Buyers
    1. 10.1. Military Vehicle Electrification Industrial Chain Analysis
    2. 10.2. Downstream Buyers
    3. 10.3. Distributors/Traders List
  11. Chapter 11 Marketing Strategy Analysis
    1. 11.1. Marketing Channel
    2. 11.2. Direct Marketing
    3. 11.3. Indirect Marketing
    4. 11.4. Marketing Channel Development Trends
    5. 11.5. Economic/Political Environmental Change
  12. Chapter 12 Report Conclusion & Key Insights
    1. 12.1. Key Insights from Primary Interviews & Surveys Respondents
    2. 12.2. Key Takeaways from Analysts, Consultants, and Industry Leaders
  13. Chapter 13 Research Approach & Methodology
    1. 13.1. Report Description
    2. 13.2. Research Scope
    3. 13.3. Research Methodology
      1. 13.3.1. Secondary Research
      2. 13.3.2. Primary Research
      3. 13.3.3. Statistical Models
        1. 13.3.3.1. Company Share Analysis Model
        2. 13.3.3.2. Revenue Based Modeling
      4. 13.3.4. Research Limitations

      List of Figures

      Fig.1	Product Picture of Military Vehicle Electrification
      Fig.2	Global Military Vehicle Electrification Market, 2016 – 2026 (USD Million)
      Fig.3	Global Military Vehicle Electrification Market Absolute Revenue Opportunity, 2016 – 2026 (USD Million)
      Fig.4	Global Military Vehicle Electrification Market Incremental Revenue Opportunity, 2020 – 2026 (USD Million)
      Fig.5	Global Military Vehicle Electrification Market Share, by Technology, 2020 & 2026 (USD Million)
      Fig.6	Global Hybrid Military Vehicle Electrification Market, 2016 – 2026 (USD Million)
      Fig.7	Global Fully Electric Military Vehicle Electrification Market, 2016 – 2026 (USD Million)
      Fig.8	Global Military Vehicle Electrification Market Share, by Platform, 2020 & 2026 (USD Million)
      Fig.9	Global Combat Vehicles Military Vehicle Electrification Market, 2016 – 2026 (USD Million)
      Fig.10	Global Support Vehicles Military Vehicle Electrification Market, 2016 – 2026 (USD Million)
      Fig.11	Global Unmanned Armoured Vehicles Military Vehicle Electrification Market, 2016 – 2026 (USD Million)
      Fig.12	Global Military Vehicle Electrification Market Share, by System, 2020 & 2026 (USD Million)
      Fig.13	Global Power Generation Military Vehicle Electrification Market, 2016 – 2026 (USD Million)
      Fig.14	Global Cooling Systems Military Vehicle Electrification Market, 2016 – 2026 (USD Million)
      Fig.15	Global Energy Storage Military Vehicle Electrification Market, 2016 – 2026 (USD Million)
      Fig.16	Global Traction Drive Systems Military Vehicle Electrification Market, 2016 – 2026 (USD Million)
      Fig.17	Global Power Conversion Military Vehicle Electrification Market, 2016 – 2026 (USD Million)
      Fig.18	Global Military Vehicle Electrification Market Share, by Operation, 2020 & 2026 (USD Million)
      Fig.19	Global Manned Military Vehicle Electrification Market, 2016 – 2026 (USD Million)
      Fig.20	Global Autonomous/Semi-autonomous Military Vehicle Electrification Market, 2016 – 2026 (USD Million)
      Fig.21	Global Military Vehicle Electrification Market Share, by Region, 2020 & 2026 (USD Million)
      Fig.22	North America Military Vehicle Electrification Market, 2016 – 2026 (USD Million)
      Fig.23	U.S. Military Vehicle Electrification Market, 2016 – 2026 (USD Million)
      Fig.24	Canada Military Vehicle Electrification Market, 2016 – 2026 (USD Million)
      Fig.25	Europe Military Vehicle Electrification Market, 2016 – 2026 (USD Million)
      Fig.26	Germany Military Vehicle Electrification Market, 2016 – 2026 (USD Million)
      Fig.27	France Military Vehicle Electrification Market, 2016 – 2026 (USD Million)
      Fig.28	U.K. Military Vehicle Electrification Market, 2016 – 2026 (USD Million)
      Fig.29	Italy Military Vehicle Electrification Market, 2016 – 2026 (USD Million)
      Fig.30	Spain Military Vehicle Electrification Market, 2016 – 2026 (USD Million)
      Fig.31	Rest of Europe Military Vehicle Electrification Market, 2016 – 2026 (USD Million)
      Fig.32	Asia Pacific Military Vehicle Electrification Market, 2016 – 2026 (USD Million)
      Fig.33	China Military Vehicle Electrification Market, 2016 – 2026 (USD Million)
      Fig.34	Japan Military Vehicle Electrification Market, 2016 – 2026 (USD Million)
      Fig.35	India Military Vehicle Electrification Market, 2016 – 2026 (USD Million)
      Fig.36	South  Korea Military Vehicle Electrification Market, 2016 – 2026 (USD Million)
      Fig.37	South-East Asia Military Vehicle Electrification Market, 2016 – 2026 (USD Million)
      Fig.38	Rest of Asia Pacific Military Vehicle Electrification Market, 2016 – 2026 (USD Million)
      Fig.39	Latin America Military Vehicle Electrification Market, 2016 – 2026 (USD Million)
      Fig.40	Brazil Military Vehicle Electrification Market, 2016 – 2026 (USD Million)
      Fig.41	Mexico Military Vehicle Electrification Market, 2016 – 2026 (USD Million)
      Fig.42	Rest of Latin America Military Vehicle Electrification Market, 2016 – 2026 (USD Million)
      Fig.43	The Middle-East and Africa Military Vehicle Electrification Market, 2016 – 2026 (USD Million)
      Fig.44	GCC Countries Military Vehicle Electrification Market, 2016 – 2026 (USD Million)
      Fig.45	South Africa Military Vehicle Electrification Market, 2016 – 2026 (USD Million)
      Fig.46	Rest of Middle-East Africa Military Vehicle Electrification Market, 2016 – 2026 (USD Million)
      Fig.47	Competitor Market Share – Revenue
      Fig.48	Leonardo Spa Revenue and Growth Rate
      Fig.49	Leonardo Spa Market Share
      Fig.50	QinetiQ Revenue and Growth Rate
      Fig.51	QinetiQ Market Share
      Fig.52	General Motors Revenue and Growth Rate
      Fig.53	General Motors Market Share
      Fig.54	General Dynamics Revenue and Growth Rate
      Fig.55	General Dynamics Market Share
      Fig.56	Arquus Revenue and Growth Rate
      Fig.57	Arquus Market Share
      Fig.58	Oshkosh Corporation Revenue and Growth Rate
      Fig.59	Oshkosh Corporation Market Share
      Fig.60	BAE Systems Revenue and Growth Rate
      Fig.61	BAE Systems Market Share
      Fig.62	Textron Systems Revenue and Growth Rate
      Fig.63	Textron Systems Market Share
      Fig.64	Nikola Corporation Revenue and Growth Rate
      Fig.65	Nikola Corporation Market Share
      Fig.66	Krauss-Maffei Wegmann GmbH and Co. KG Revenue and Growth Rate
      Fig.67	Krauss-Maffei Wegmann GmbH and Co. KG Market Share
      Fig.68	AeroVironment Revenue and Growth Rate
      Fig.69	AeroVironment Market Share
      Fig.70	Ford Motor Company Revenue and Growth Rate
      Fig.71	Ford Motor Company Market Share
      Fig.72	Tesla Inc. Revenue and Growth Rate
      Fig.73	Tesla Inc. Market Share
      Fig.74	Lockheed Martin Revenue and Growth Rate
      Fig.75	Lockheed Martin Market Share
      Fig.76	Milrem Robotics Revenue and Growth Rate
      Fig.77	Milrem Robotics Market Share
      Fig.78	Alke Revenue and Growth Rate
      Fig.79	Alke Market Share
      Fig.80	Market Dynamics
      Fig.81	Global Military Vehicle Electrification – Value Chain Analysis
      Fig.82	Key Mandates and Regulations
      Fig.83	Technology Roadmap and Timeline
      Fig.84	Market Attractiveness Analysis – By Technology
      Fig.85	Market Attractiveness Analysis – By Platform
      Fig.86	Market Attractiveness Analysis – By System
      Fig.87	Market Attractiveness Analysis – By Operation
      Fig.88	Market Attractiveness Analysis – By Region
      Fig.89	Military Vehicle Electrification Industrial Chain Analysis
      Fig.90	Market Channels
      Fig.91	Marketing Channel Development Trend
      Fig.92	Growth in World Gross Product, 2008-2018
      

      List of Tables

      	
      Table 1	Global Military Vehicle Electrification Market, 2020 & 2026 (USD Million)
      Table 2	Global Military Vehicle Electrification Market, by Technology, 2016 – 2026 (USD Million)
      Table 3	Global Military Vehicle Electrification Market, by Platform, 2016 – 2026 (USD Million)
      Table 4	Global Military Vehicle Electrification Market, by System, 2016 – 2026 (USD Million)
      Table 5	Global Military Vehicle Electrification Market, by Operation, 2016 – 2026 (USD Million)
      Table 6	Global Military Vehicle Electrification Market, by Region, 2016 – 2026 (USD Million)
      Table 7	North America Military Vehicle Electrification Market, by Country, 2016 – 2026 (USD Million)
      Table 8	North America Military Vehicle Electrification Market, by Technology, 2016 – 2026 (USD Million)
      Table 9	North America Military Vehicle Electrification Market, by Platform, 2016 – 2026 (USD Million)
      Table 10 North America Military Vehicle Electrification Market, by System, 2016 – 2026 (USD Million)
      Table 11 North America Military Vehicle Electrification Market, by Operation, 2016 – 2026 (USD Million)
      Table 12 Europe Military Vehicle Electrification Market, by Country, 2016 – 2026 (USD Million)
      Table 13 Europe Military Vehicle Electrification Market, by Technology, 2016 – 2026 (USD Million)
      Table 14 Europe Military Vehicle Electrification Market, by Platform, 2016 – 2026 (USD Million)
      Table 15 Europe Military Vehicle Electrification Market, by System, 2016 – 2026 (USD Million)
      Table 16 Europe Military Vehicle Electrification Market, by Operation, 2016 – 2026 (USD Million)
      Table 17 Asia Pacific Military Vehicle Electrification Market, by Country, 2016 – 2026 (USD Million)
      Table 18 Asia Pacific Military Vehicle Electrification Market, by Technology, 2016 – 2026 (USD Million)
      Table 19 Asia Pacific Military Vehicle Electrification Market, by Platform, 2016 – 2026 (USD Million)
      Table 20 Asia Pacific Military Vehicle Electrification Market, by System, 2016 – 2026 (USD Million)
      Table 21 Asia Pacific Military Vehicle Electrification Market, by Operation, 2016 – 2026 (USD Million)
      Table 22 Latin America Military Vehicle Electrification Market, by Country, 2016 – 2026 (USD Million)
      Table 23 Latin America Military Vehicle Electrification Market, by Technology, 2016 – 2026 (USD Million)
      Table 24 Latin America Military Vehicle Electrification Market, by Platform, 2016 – 2026 (USD Million)
      Table 25 Latin America Military Vehicle Electrification Market, by System, 2016 – 2026 (USD Million)
      Table 26 Latin America Military Vehicle Electrification Market, by Operation, 2016 – 2026 (USD Million)
      Table 27 The Middle-East and Africa Military Vehicle Electrification Market, by Country, 2016 – 2026 (USD Million)
      Table 28 The Middle-East and Africa Military Vehicle Electrification Market, by Technology, 2016 – 2026 (USD Million)
      Table 29 The Middle-East and Africa Military Vehicle Electrification Market, by Platform, 2016 – 2026 (USD Million)
      Table 30 The Middle-East and Africa Military Vehicle Electrification Market, by System, 2016 – 2026 (USD Million)
      Table 31 The Middle-East and Africa Military Vehicle Electrification Market, by Operation, 2016 – 2026 (USD Million)
      Table 32 Global Military Vehicle Electrification Market - Company Revenue Analysis, 2016 – 2020 (USD Million)
      Table 33 Global Military Vehicle Electrification Market - Company Revenue Share Analysis, 2016 – 2020 (%)
      Table 34 Acquisitions and Mergers
      Table 35 Market Drivers – Impact Analysis
      Table 36 Market Restraints
      Table 37 Market Opportunities
      Table 38 Major Buyers of Military Vehicle Electrification
      Table 39 Distributors/Traders of Military Vehicle Electrification by Region
      

Industry Major Market Players

  • Leonardo Spa
  • QinetiQ
  • General Motors
  • General Dynamics
  • Arquus
  • Oshkosh Corporation
  • BAE Systems Textron Systems
  • Nikola Corporation
  • Krauss-Maffei Wegmann GmbH and Co. KG
  • AeroVironment
  • Ford Motor Company
  • Tesla Inc.
  • Lockheed Martin
  • Milrem Robotics
  • Alke