![]()
Search Market Research Report
Military Ammunition Market Size, Share Global Analysis Report, 2019 – 2027

Military Ammunition Market By Product (Bullets, Mortar Ammunition, Aerial Bombs, Artillery Shells, and Grenades), By Category (Ball, Full Metal Jacket, Armor Piercing, and Jacketed Hollow Point), By Application (Training and Combat), and By Size (Small Caliber, Large Caliber, and Medium Caliber): Global Industry Perspective, Comprehensive Analysis, and Forecast 2019 – 2027
Industry Insights
The report covers the forecast and analysis of the Military Ammunition market on a global and regional level. The study provides historical data from 2015 to 2018 along with a forecast from 2019 to 2027 based on revenue (USD Million). The study includes drivers and restraints of the Military Ammunition market along with the impact they have on the demand over the forecast period. Additionally, the report includes the study of opportunities available in the Military Ammunition market on a global level.
In order to give the users of this report a comprehensive view of the Military Ammunition market, we have included a competitive landscape and an analysis of Porter’s Five Forces model for the market. The study encompasses a market attractiveness analysis, wherein all the segments are benchmarked based on their market size, growth rate, and general attractiveness.
The report provides company market share analysis to give a broader overview of the key players in the market. In addition, the report also covers key strategic developments of the market including acquisitions & mergers, new service & product launches, agreements, partnerships, collaborations & joint ventures, research & development, and regional expansion of major participants involved in the market on a global and regional basis.
The study provides a decisive view of the Military Ammunition market by segmenting the market based on product, category, application, size, and regions. All the segments have been analyzed based on present and future trends and the market is estimated from 2019 to 2027. The regional segmentation includes the current and forecast demand for North America, Europe, Asia Pacific, Latin America, and the Middle East and Africa.
The massive launching of initiatives pertaining to the modernization of defense activities across major countries is set to push the expansion of the military ammunition industry during the forecast timeline. Apart from this, many countries are trying to fulfill their military needs along with competing for military exports with other countries. This, in turn, will nurture the market surge during the forecast timeline. Nevertheless, firearms trafficking will restrict the growth of the industry during the forecast timeline. However, the rise in the number of global defense suppliers will offer new growth avenues for the market during the period from 2019 to 2027.
 Report Scope
Report Attribute |
Details |
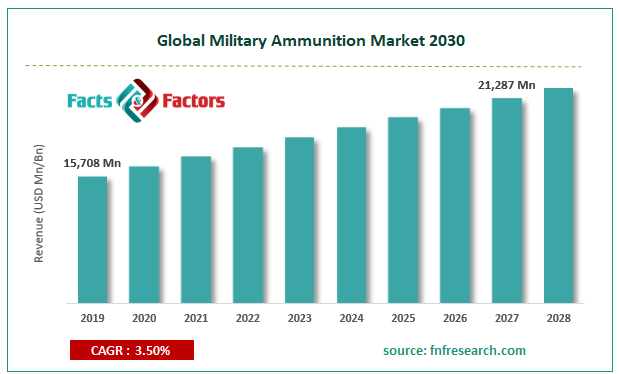
Market Size in 2019 |
USD 15,708 Million |
Projected Market Size in 2027 |
USD 21,287 Million |
Growth Rate |
CAGR 3.5% |
Base Year |
2017 |
Forecast Years |
2018-2027 |
Key Market Players |
BAE Systems, CBC Global Ammunition, Federal Ammunition, General Dynamics Ordnance, and Tactical Systems, Lockheed Martin Corporation, Nammo AS, Nexter group KNDS, Northrop Grumman Corporation, Olin Corporation, Poongsan Corporation, Rheinmetall AG, RUAG Group, VISTA OUTDOOR OPERATIONS LLC., Winchester Ammunition, Black Hills Ammunition, Hornady and Others |
Key Segment |
By Product, By Category, By Application, By Size and By Region |
Major Regions Covered |
North America, Europe, Asia Pacific, Latin America, and the Middle East & Africa |
Purchase Options |
Request customized purchase options to meet your research needs. Explore purchase options |
Competitive Landscape
- BAE Systems
- CBC Global Ammunition
- Federal Ammunition
- General Dynamics Ordnance and Tactical Systems
- Lockheed Martin Corporation
- Nammo AS
- Nexter group KNDS
- Northrop Grumman Corporation
- Olin Corporation
- Poongsan Corporation
- Rheinmetall AG
- RUAG Group
- VISTA OUTDOOR OPERATIONS LLC.
- Winchester Ammunition
- Black Hills Ammunition
- Hornady
Key Segment
By Product, By Category, By Application, By Size and By Region
Major Regions Covered
North America, Europe, Asia Pacific, Latin America, and the Middle East & Africa
Purchase Options
Request customized purchase options to meet your research needs. Explore purchase options
Based on the product, the market for military ammunition is segregated into Bullets, Mortar Ammunition, Aerial Bombs, Artillery Shells, and Grenades. On the basis of category, the market is divided into Ball, Full Metal Jacket, Armor Piercing, and Jacketed Hollow Point. Application-wise, the military ammunition industry is classified into Training and Combat. In terms of size, the market is segmented into Small Caliber, Large Caliber, and Medium Caliber.
Table of Content

Industry Major Market Players
- BAE Systems,
- CBC Global Ammunition,
- Federal Ammunition,
- General Dynamics Ordnance Tactical Systems,
- Lockheed Martin Corporation,
- Nammo AS,
- Nexter group KNDS,
- Northrop Grumman Corporation,
- Olin Corporation,
- Poongsan Corporation,
- Rheinmetall AG,
- RUAG Group,
- VISTA OUTDOOR OPERATIONS LLC.,
- Winchester Ammunition,
- Black Hills Ammunition,
- Hornady.


Copyright © 2025 - 2026, All Rights Reserved, Facts and Factors