Search Market Research Report

Discover Our Latest Reports
Discover Our Featured Reports
Discover Top Selling Reports

Mica Market Size, Share Global Analysis Report, 2020–2026

report img

Mica Market By Type (Natural and Synthetic), Grade (Ground Mica, Sheet Mica, and Built-Up Mica) and By End-User (Electrical &Electronics, Cosmetics & Personal Care, Construction, Paint & Coating, and Others): Global Industry Outlook, Market Size, Business Intelligence, Consumer Preferences, Statistical Surveys, Comprehensive Analysis, Historical Developments, Current Trends, and Forecast 2020–2026

Industry Insights

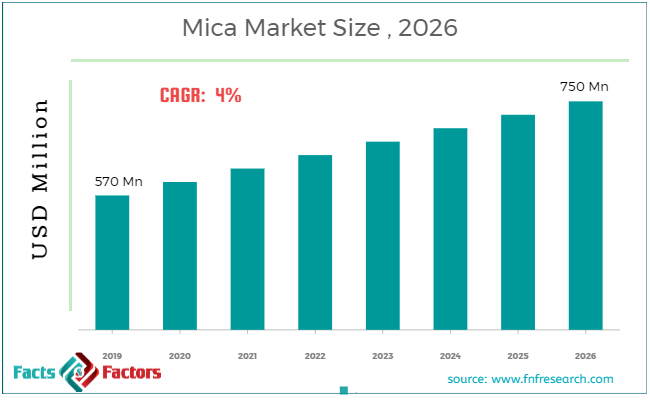
 According to the report published by Facts & Factors, the global Mica Market size was worth around USD 570 million in 2019 and is predicted to grow around USD 750 million by 2026 with a compound annual growth rate (CAGR) of roughly 4% between 2020 and 2026. The report analyzes the global Mica Market drivers, restraints/challenges, and the effect they have on the demands during the projection period. In addition, the report explores emerging opportunities in the Mica Market.

This specialized and expertise oriented industry research report scrutinizes the technical and commercial business outlook of the mica industry. The report analyzes and declares the historical and current trends analysis of the mica industry and subsequently recommends the projected trends anticipated to be observed in the mica market during the upcoming years.

The mica market report analyzes and notifies the industry statistics at the global as well as regional and country levels in order to acquire a thorough perspective of the entire mica market. The historical and past insights are provided for FY 2016 to FY 2019 whereas projected trends are delivered for FY 2020 to FY 2026. The quantitative and numerical data is represented in terms of both volume (Kilo Tons) and value (USD Million) from FY 2016 – 2026.

Mica Market Size

To know more about this report | Request Free Sample Copy

logoKey Insights from Primary Research

  • According to the primary respondents, the global mica market is set to grow annually at a rate of around 4%
  • The market was valued at around USD 570 million, in 2019 and is projected to reach around USD 750 million, in 2026.
  • The “natural mica” category was the dominating type segmentation of the market, in 2019 and is estimated to maintain its dominance in the next few years as well.
  • “Ground mica” category of the grade segment is expected to grow significantly in the upcoming years owing to the increasing use in construction, paints & coatings, plastic, rubber, and cosmetics industries.
  • Based on the application segmentation, the “electrical & electronics” category held the largest share, in 2019.
  • The Asia Pacific region dominated the global mica market, in 2019. China was the largest contributing country within the region.

logoKey Recommendations from Analysts

  • As per our analysts, the global mica market is projected to grow significantly in the future. The growing consumption of mica in large number industries such as construction, electrical & electronics, paints & coatings, and cosmetics industries.
  • The surge in the demand Formica in the automotive industry for various applications such as brake pads, clutch pads, silencers, batteries, led lamps, and electronic parts, is projected to boost the market growth.
  • The Asia Pacific is the potential region for the global mica market. The surging construction industry in developing countries like China, India, Japan, Philippines, and Indonesia is estimated to increase the demand for mica.
  • Growing at a CAGR around 4%, the global mica market provides several opportunities for suppliers, manufacturers, and distributors across the globe.
  • Our analysts have identified “electrical & electronics” and “paint & coating” categories are the major consumers of the mica, globally.
  • The major players of the mica market are focusing on product innovation and strategic alliances to maintain its position in the market. Moreover, with the rising demand for mica, the players are also focusing on the pricing of the product. For instance, Imerys announced the increase in its product prices ranging from 4.0% to 9.0%, based on product type, packaging type, and delivery terms. The price increases will apply across all Mica, Diatomite, Kaolin, Calcium Carbonate, Wollastonite, and Perlite products among others.

The quantitative data is further underlined and reinforced by comprehensive qualitative data which comprises various across-the-board market dynamics. The rationales which directly or indirectly impact the mica industry are exemplified through parameters such as growth drivers, restraints, challenges, and opportunities among other impacting factors.

Throughout our research report, we have encompassed all the proven models and tools of industry analysis and extensively illustrated all the key business strategies and business models adopted in the mica industry. The report provides an all-inclusive and detailed competitive landscape prevalent in the mica market.

The report utilizes established industry analysis tools and models such as Porter’s Five Forces framework to analyze and recognize critical business strategies adopted by various stakeholders involved in the entire value chain of the mica industry. The mica market report additionally employs SWOT analysis and PESTLE analysis models for further in-depth analysis.

logoReport Scope

Report Attribute

Details

Market Size in 2019

USD 570 Million

Projected Market Size in 2026

USD 750 Million

CAGR Growth Rate

4% CAGR

Base Year

2019

Forecast Years

2020-2026

Key Market Players

COGEBI, BASF Catalysts, Daruka Minerals, Premier Mica Company, Mica Manufacturing, Gunpatroy, Cleveland Mica Company, Franklin Industrial Minerals, Asheville-Schoonmaker Mica, and Imerysamong others.

Key Segment

By Component, Distribution Channel, and Region

Major Regions Covered

North America, Europe, Asia Pacific, Latin America, and the Middle East &, Africa

Purchase Options

Request customized purchase options to meet your research needs. Explore purchase options

The report study further includes an in-depth analysis of industry players' market shares and provides an overview of leading players' market position in the mica sector. Key strategic developments in the mica market competitive landscape such as acquisitions & mergers, inaugurations of different products and services, partnerships & joint ventures, MoU agreements, VC & funding activities, R&D activities, and geographic expansion among other noteworthy activities by key players of the mica market are appropriately highlighted in the report.

The growing construction and electrical & electronics industries across the globe are further projected to boost the global mica market. In the construction industry, mica is extensively used for wallboards, cladding, joint compounds, and plasters. Moreover, the rising application of mica in the electrical & electronics for producing electronic products such as toasters, LED lights, hairdryers, lighting equipment, and smoke detectors is likely to propel the mica market growth in the upcoming years as well.

The mica market research report delivers an acute valuation and taxonomy of the mica industry by practically splitting the market on the basis of different types, grades, applications, and regions. Through the analysis of the historical and projected trends, all the segments and sub-segments were evaluated through the bottom-up approach, and different market sizes have been projected for FY 2020 to FY 2026. The regional segmentation of the mica industry includes the complete classification of all the major continents including North America, Latin America, Europe, Asia Pacific, and Middle East & Africa. Further, country-wise data for the mica industry is provided for the leading economies of the world.

The mica market is segmented based on Type, Grade, and Application. On the basis of type segmentation, the market is classified as intonatural and synthetic. Based on the grade, the market is segregated into ground mica, sheet mica, and built-up mica. In terms of end-user segmentation, the market is bifurcated into the electrical & electronics, cosmetics & personal care, construction, paint & coating, and others.

logoSome of the essential players operating in the mica market, but not restricted to include

  • COGEBI
  •  BASF Catalysts
  •  Daruka Minerals
  •  Premier Mica Company
  •  Mica Manufacturing
  •  Gunpatroy
  • Cleveland Mica Company
  • Franklin Industrial Minerals
  • Asheville-Schoonmaker Mica
  • Imerysamong

The taxonomy of the mica market by its scope and segmentation is as follows:

logo By Type Segmentation Analysis

  • Natural
  • Synthetic

logo By Grade Segmentation Analysis

  • Ground Mica
  • Sheet Mica
  • Built-Up Mica

logo By End-User Segmentation Analysis

  • Electrical & Electronics
  • Cosmetics & Personal Care
  • Construction
  • Paint & Coating
  • Others

logo Regional Segmentation Analysis

  • North America
    • The U.S.
    • Canada
  • Europe
    • Germany
    • The UK
    • France
    • Spain
    • Italy
    • Rest of Europe
  • Asia Pacific
    • China
    • Japan
    • India
    • South Korea
    • Southeast Asia
    • Rest of Asia Pacific
  • Latin America
    • Brazil
    • Mexico
    • Rest of Latin America
  • Middle East & Africa
    • GCC
    • South Africa
    • Rest of Middle East & Africa

Table of Content

  1. CHAPTER 1. Executive Summary
  2. CHAPTER 2. Mica market – Type Analysis
    1. 2.1. Global Mica Market – Type Overview
    2. 2.2. Global Mica Market Share, by Type, 2019 & 2026 (USD Million)
    3. 2.3. Global Mica Market share, by Type, 2019 & 2026 (Kilo Tons)
    4. 2.4. Natural
      1. 2.4.1. Global Natural Mica Market, 2016-2026 (USD Million)
      2. 2.4.2. Global Natural Mica Market, 2016-2026 (Kilo Tons)
    5. 2.5. Synthetic
      1. 2.5.1. Global Synthetic Mica Market, 2016-2026 (USD Million)
      2. 2.5.2. Global Synthetic Mica Market, 2016-2026 (Kilo Tons)
  3. CHAPTER 3. Mica market – Grade Analysis
    1. 3.1. Global Mica Market – Grade Overview
    2. 3.2. Global Mica Market Share, by Grade, 2019 & 2026 (USD Million)
    3. 3.3. Global Mica Market share, by Grade, 2019 & 2026 (Kilo Tons)
    4. 3.4. Ground Mica
      1. 3.4.1. Global Ground Mica Market, 2016-2026 (USD Million)
      2. 3.4.2. Global Ground Mica Market, 2016-2026 (Kilo Tons)
    5. 3.5. Sheet Mica
      1. 3.5.1. Global Sheet Mica Market, 2016-2026 (USD Million)
      2. 3.5.2. Global Sheet Mica Market, 2016-2026 (Kilo Tons)
    6. 3.6. Built-Up Mica
      1. 3.6.1. Global Built-Up Mica Market, 2016-2026 (USD Million)
      2. 3.6.2. Global Built-Up Mica Market, 2016-2026 (Kilo Tons)
  4. CHAPTER 4. Mica market – End-User Analysis
    1. 4.1. Global Mica Market – End-User Overview
    2. 4.2. Global Mica Market Share, by End-User, 2019 & 2026 (USD Million)
    3. 4.3. Global Mica Market share, by End-User, 2019 & 2026 (Kilo Tons)
    4. 4.4. Electrical & Electronics
      1. 4.4.1. Global Electrical & Electronics Mica Market, 2016-2026 (USD Million)
      2. 4.4.2. Global Electrical & Electronics Mica Market, 2016-2026 (Kilo Tons)
    5. 4.5. Cosmetics & Personal Care
      1. 4.5.1. Global Cosmetics & Personal Care Mica Market, 2016-2026 (USD Million)
      2. 4.5.2. Global Cosmetics & Personal Care Mica Market, 2016-2026 (Kilo Tons)
    6. 4.6. Construction
      1. 4.6.1. Global Construction Mica Market, 2016-2026 (USD Million)
      2. 4.6.2. Global Construction Mica Market, 2016-2026 (Kilo Tons)
    7. 4.7. Paint & Coating
      1. 4.7.1. Global Paint & Coating Mica Market, 2016-2026 (USD Million)
      2. 4.7.2. Global Paint & Coating Mica Market, 2016-2026 (Kilo Tons)
    8. 4.8. Others
      1. 4.8.1. Global Others Mica Market, 2016-2026 (USD Million)
      2. 4.8.2. Global Others Mica Market, 2016-2026 (Kilo Tons)
  5. CHAPTER 5. Mica market – Regional Analysis
    1. 5.1. Global Mica Market Regional Overview
    2. 5.2. Global Mica Market Share, by Region, 2019 & 2026 (Value)
    3. 5.3. Global Mica Market Share, by Region, 2019 & 2026 (Volume)
    4. 5.4. North America
      1. 5.4.1. North America Mica Market size and forecast, 2016-2026
      2. 5.4.2. North America Mica Market, by Country, 2016-2026 (USD Million)
      3. 5.4.3. North America Market size and forecast, 2016-2026 (Kilo Tons)
      4. 5.4.4. North America Mica Market, by Country, 2016-2026 (Kilo Tons)
      5. 5.4.5. North America Mica Market, by Type, 2016-2026
        1. 5.4.5.1. North America Mica Market, by Type, 2016-2026 (USD Million)
        2. 5.4.5.2. North America Mica Market, by Type, 2016-2026 (Kilo Tons)
      6. 5.4.6. North America Mica Market, by Grade, 2016-2026
        1. 5.4.6.1. North America Mica Market, by Grade, 2016-2026 (USD Million)
        2. 5.4.6.2. North America Mica Market, by Grade, 2016-2026 (Kilo Tons)
      7. 5.4.7. North America Mica Market, by End-User, 2016-2026
        1. 5.4.7.1. North America Mica Market, by End-User, 2016-2026 (USD Million)
        2. 5.4.7.2. North America Mica Market, by End-User, 2016-2026 (Kilo Tons)
      8. 5.4.8. U.S.
        1. 5.4.8.1. U.S. Market size and forecast, 2016-2026 (USD Million)
        2. 5.4.8.2. U.S. Market size and forecast, 2016-2026 (Kilo Tons)
      9. 5.4.9. Canada
        1. 5.4.9.1. Canada Market size and forecast, 2016-2026 (USD Million)
        2. 5.4.9.2. Canada Market size and forecast, 2016-2026 (Kilo Tons)
    5. 5.5. Europe
      1. 5.5.1. Europe Mica Market size and forecast, 2016-2026
      2. 5.5.2. Europe Mica Market, by Country, 2016-2026 (USD Million)
      3. 5.5.3. Europe Market size and forecast, 2016-2026 (Kilo Tons)
      4. 5.5.4. Europe Mica Market, by Country, 2016-2026 (Kilo Tons)
      5. 5.5.5. Europe Mica Market, by Type, 2016-2026
        1. 5.5.5.1. Europe Mica Market, by Type, 2016-2026 (USD Million)
        2. 5.5.5.2. Europe Mica Market, by Type, 2016-2026 (Kilo Tons)
      6. 5.5.6. Europe Mica Market, by Grade, 2016-2026
        1. 5.5.6.1. Europe Mica Market, by Grade, 2016-2026 (USD Million)
        2. 5.5.6.2. Europe Mica Market, by Grade, 2016-2026 (Kilo Tons)
      7. 5.5.7. Europe Mica Market, by End-User, 2016-2026
        1. 5.5.7.1. Europe Mica Market, by End-User, 2016-2026 (USD Million)
        2. 5.5.7.2. Europe Mica Market, by End-User, 2016-2026 (Kilo Tons)
      8. 5.5.8. Germany
        1. 5.5.8.1. Germany Market size and forecast, 2016-2026 (USD Million)
        2. 5.5.8.2. Germany Market size and forecast, 2016-2026 (Kilo Tons)
      9. 5.5.9. France
        1. 5.5.9.1. France Market size and forecast, 2016-2026 (USD Million)
        2. 5.5.9.2. France Market size and forecast, 2016-2026 (Kilo Tons)
      10. 5.5.10. U.K.
        1. 5.5.10.1. U.K. Market size and forecast, 2016-2026 (USD Million)
        2. 5.5.10.2. U.K. Market size and forecast, 2016-2026 (Kilo Tons)
      11. 5.5.11. Italy
        1. 5.5.11.1. Italy Market size and forecast, 2016-2026 (USD Million)
        2. 5.5.11.2. Italy Market size and forecast, 2016-2026 (Kilo Tons)
      12. 5.5.12. Spain
        1. 5.5.12.1. Spain Market size and forecast, 2016-2026 (USD Million)
        2. 5.5.12.2. Spain Market size and forecast, 2016-2026 (Kilo Tons)
      13. 5.5.13. Rest of Europe
        1. 5.5.13.1. Rest of Europe Market size and forecast, 2016-2026 (USD Million)
        2. 5.5.13.2. Rest of Europe Market size and forecast, 2016-2026 (Kilo Tons)
    6. 5.6. Asia Pacific
      1. 5.6.1. Asia Pacific Mica Market size and forecast, 2016-2026
      2. 5.6.2. Asia Pacific Mica Market, by Country, 2016-2026 (USD Million)
      3. 5.6.3. Asia Pacific Market size and forecast, 2016-2026 (Kilo Tons)
      4. 5.6.4. Asia Pacific Mica Market, by Country, 2016-2026 (Kilo Tons)
      5. 5.6.5. Asia Pacific Mica Market, by Type, 2016-2026
        1. 5.6.5.1. Asia Pacific Mica Market, by Type, 2016-2026 (USD Million)
        2. 5.6.5.2. Asia Pacific Mica Market, by Type, 2016-2026 (Kilo Tons)
      6. 5.6.6. Asia Pacific Mica Market, by Grade, 2016-2026
        1. 5.6.6.1. Asia Pacific Mica Market, by Grade, 2016-2026 (USD Million)
        2. 5.6.6.2. Asia Pacific Mica Market, by Grade, 2016-2026 (Kilo Tons)
      7. 5.6.7. Asia Pacific Mica Market, by End-User, 2016-2026
        1. 5.6.7.1. Asia Pacific Mica Market, by End-User, 2016-2026 (USD Million)
        2. 5.6.7.2. Asia Pacific Mica Market, by End-User, 2016-2026 (Kilo Tons)
      8. 5.6.8. China
        1. 5.6.8.1. China Market size and forecast, 2016-2026 (USD Million)
        2. 5.6.8.2. China Market size and forecast, 2016-2026 (Kilo Tons)
      9. 5.6.9. Japan
        1. 5.6.9.1. Japan Market size and forecast, 2016-2026 (USD Million)
        2. 5.6.9.2. Japan Market size and forecast, 2016-2026 (Kilo Tons)
      10. 5.6.10. India
        1. 5.6.10.1. India Market size and forecast, 2016-2026 (USD Million)
        2. 5.6.10.2. India Market size and forecast, 2016-2026 (Kilo Tons)
      11. 5.6.11. South Korea
        1. 5.6.11.1. South Korea Market size and forecast, 2016-2026 (USD Million)
        2. 5.6.11.2. South Korea Market size and forecast, 2016-2026 (Kilo Tons)
      12. 5.6.12. South-East Asia
        1. 5.6.12.1. South-East Asia Market size and forecast, 2016-2026 (USD Million)
        2. 5.6.12.2. South-East Asia Market size and forecast, 2016-2026 (Kilo Tons)
      13. 5.6.13. Rest of Asia Pacific
        1. 5.6.13.1. Rest of Asia Pacific Market size and forecast, 2016-2026 (USD Million)
        2. 5.6.13.2. Rest of Asia Pacific Market size and forecast, 2016-2026 (Kilo Tons)
    7. 5.7. Latin America
      1. 5.7.1. Latin America Mica Market size and forecast, 2016-2026
      2. 5.7.2. Latin America Mica Market, by Country, 2016-2026 (USD Million)
      3. 5.7.3. Latin America Market size and forecast, 2016-2026 (Kilo Tons)
      4. 5.7.4. Latin America Mica Market, by Country, 2016-2026 (Kilo Tons)
      5. 5.7.5. Latin America Mica Market, by Type, 2016-2026
        1. 5.7.5.1. Latin America Mica Market, by Type, 2016-2026 (USD Million)
        2. 5.7.5.2. Latin America Mica Market, by Type, 2016-2026 (Kilo Tons)
      6. 5.7.6. Latin America Mica Market, by Grade, 2016-2026
        1. 5.7.6.1. Latin America Mica Market, by Grade, 2016-2026 (USD Million)
        2. 5.7.6.2. Latin America Mica Market, by Grade, 2016-2026 (Kilo Tons)
      7. 5.7.7. Latin America Mica Market, by End-User, 2016-2026
        1. 5.7.7.1. Latin America Mica Market, by End-User, 2016-2026 (USD Million)
        2. 5.7.7.2. Latin America Mica Market, by End-User, 2016-2026 (Kilo Tons)
      8. 5.7.8. Brazil
        1. 5.7.8.1. Brazil Market size and forecast, 2016-2026 (USD Million)
        2. 5.7.8.2. Brazil Market size and forecast, 2016-2026 (Kilo Tons)
      9. 5.7.9. Mexico
        1. 5.7.9.1. Mexico Market size and forecast, 2016-2026 (USD Million)
        2. 5.7.9.2. Mexico Market size and forecast, 2016-2026 (Kilo Tons)
      10. 5.7.10. Rest of Latin America
        1. 5.7.10.1. Rest of Latin America Market size and forecast, 2016-2026 (USD Million)
        2. 5.7.10.2. Rest of Latin America Market size and forecast, 2016-2026 (Kilo Tons)
    8. 5.8. The Middle-East and Africa
      1. 5.8.1. The Middle-East and Africa Mica Market size and forecast, 2016-2026
      2. 5.8.2. The Middle-East and Africa Mica Market, by Country, 2016-2026 (USD Million)
      3. 5.8.3. The Middle-East and Africa Market size and forecast, 2016-2026 (Kilo Tons)
      4. 5.8.4. The Middle-East and Africa Mica Market, by Country, 2016-2026 (Kilo Tons)
      5. 5.8.5. The Middle-East and Africa Mica Market, by Type, 2016-2026
        1. 5.8.5.1. The Middle-East and Africa Mica Market, by Type, 2016-2026 (USD Million)
        2. 5.8.5.2. The Middle-East and Africa Mica Market, by Type, 2016-2026 (Kilo Tons)
      6. 5.8.6. The Middle-East and Africa Mica Market, by Grade, 2016-2026
        1. 5.8.6.1. The Middle-East and Africa Mica Market, by Grade, 2016-2026 (USD Million)
        2. 5.8.6.2. The Middle-East and Africa Mica Market, by Grade, 2016-2026 (Kilo Tons)
      7. 5.8.7. The Middle-East and Africa Mica Market, by End-User, 2016-2026
        1. 5.8.7.1. The Middle-East and Africa Mica Market, by End-User, 2016-2026 (USD Million)
        2. 5.8.7.2. The Middle-East and Africa Mica Market, by End-User, 2016-2026 (Kilo Tons)
      8. 5.8.8. GCC Countries
        1. 5.8.8.1. GCC Countries Market size and forecast, 2016-2026 (USD Million)
        2. 5.8.8.2. GCC Countries Market size and forecast, 2016-2026 (Kilo Tons)
      9. 5.8.9. South Africa
        1. 5.8.9.1. South Africa Market size and forecast, 2016-2026 (USD Million)
        2. 5.8.9.2. South Africa Market size and forecast, 2016-2026 (Kilo Tons)
      10. 5.8.10. Rest of Middle-East Africa
        1. 5.8.10.1. Rest of Middle-East Africa Market size and forecast, 2016-2026 (USD Million)
        2. 5.8.10.2. Rest of Middle-East Africa Market size and forecast, 2016-2026 (Kilo Tons)
  6. CHAPTER 6. Mica Production, Consumption, Export, Import by Regions
    1. 6.1. Global Mica production and revenue, 2016-2026 (USD Million) (Kilo Tons)
    2. 6.2. Global Import and Export Analysis, by Region
  7. CHAPTER 7. Mica market – Competitive Landscape
    1. 7.1. Competitor Market Share – Revenue
    2. 7.2. Market Concentration Rate Analysis, Top 3 and Top 5 Players
    3. 7.3. Competitor Market Share – Volume
    4. 7.4. Strategic Development
      1. 7.4.1. Acquisitions and Mergers
      2. 7.4.2. New Products
      3. 7.4.3. Research & Development Activities
  8. CHAPTER 8. Company Profiles
    1. 8.1. BASF Catalysts
      1. 8.1.1. Company Overview
      2. 8.1.2. BASF Catalysts Sales, Revenue, Price, and Gross Margin
      3. 8.1.3. Product portfolio
      4. 8.1.4. Recent initiatives
    2. 8.2. Daruka Minerals
      1. 8.2.1. Company Overview
      2. 8.2.2. Daruka Minerals Sales, Revenue, Price, and Gross Margin
      3. 8.2.3. Product portfolio
      4. 8.2.4. Recent initiatives
    3. 8.3. Premier Mica Company
      1. 8.3.1. Company Overview
      2. 8.3.2. Premier Mica Company Sales, Revenue, Price, and Gross Margin
      3. 8.3.3. Product portfolio
      4. 8.3.4. Recent initiatives
    4. 8.4. Mica Manufacturing
      1. 8.4.1. Company Overview
      2. 8.4.2. Mica Manufacturing Sales, Revenue, Price, and Gross Margin
      3. 8.4.3. Product portfolio
      4. 8.4.4. Recent initiatives
    5. 8.5. COGEBI N.V.
      1. 8.5.1. Company Overview
      2. 8.5.2. COGEBI N.V. Sales, Revenue, Price, and Gross Margin
      3. 8.5.3. Product portfolio
      4. 8.5.4. Recent initiatives
    6. 8.6. Gunpatroy Private Limited
      1. 8.6.1. Company Overview
      2. 8.6.2. Gunpatroy Private Limited Sales, Revenue, Price, and Gross Margin
      3. 8.6.3. Product portfolio
      4. 8.6.4. Recent initiatives
    7. 8.7. Asheville-Schoonmaker Mica Company
      1. 8.7.1. Company Overview
      2. 8.7.2. Asheville-Schoonmaker Mica Company Sales, Revenue, Price, and Gross Margin
      3. 8.7.3. Product portfolio
      4. 8.7.4. Recent initiatives
    8. 8.8. Cleveland Mica Company
      1. 8.8.1. Company Overview
      2. 8.8.2. Cleveland Mica Company Sales, Revenue, Price, and Gross Margin
      3. 8.8.3. Product portfolio
      4. 8.8.4. Recent initiatives
    9. 8.9. Franklin Industrial Minerals Co.
      1. 8.9.1. Company Overview
      2. 8.9.2. Franklin Industrial Minerals Co. Sales, Revenue, Price, and Gross Margin
      3. 8.9.3. Product portfolio
      4. 8.9.4. Recent initiatives
    10. 8.10. Imerys
      1. 8.10.1. Company Overview
      2. 8.10.2. Imerys Sales, Revenue, Price, and Gross Margin
      3. 8.10.3. Product portfolio
      4. 8.10.4. Recent initiatives
    11. 8.11. Others
      1. 8.11.1. Company Overview
      2. 8.11.2. Others Sales, Revenue, Price, and Gross Margin
      3. 8.11.3. Product portfolio
      4. 8.11.4. Recent initiatives
  9. CHAPTER 9. Mica — Industry Analysis
    1. 9.1. Introduction and Taxonomy
    2. 9.2. Mica Market – Key Trends
      1. 9.2.1. Market Drivers
      2. 9.2.2. Market Restraints
      3. 9.2.3. Market Opportunities
    3. 9.3. Value Chain Analysis
    4. 9.4. Key Mandates and Regulations
    5. 9.5. Technology Roadmap and Timeline
    6. 9.6. Mica market – Attractiveness Analysis
      1. 9.6.1. By Type
      2. 9.6.2. By Grade
      3. 9.6.3. By End-User
      4. 9.6.4. By Region
  10. CHAPTER 10. Raw Material analysis
    1. 10.1. Mica Key Raw Material Analysis
      1. 10.1.1. Key Raw Materials
      2. 10.1.2. Price Trend of Key Raw Materials
    2. 10.2. Key Suppliers of Raw Materials
    3. 10.3. Proportion of Manufacturing Cost Structure
      1. 10.3.1. Raw Materials
      2. 10.3.2. Labor Cost
    4. 10.4. Manufacturing Expenses Analysis of Mica
  11. CHAPTER 11. Industrial Chain, Sourcing Strategy and Downstream Buyers
    1. 11.1. Mica Industrial Chain Analysis
    2. 11.2. Upstream Raw Materials Sourcing
      1. 11.2.1. Risk Mitigation:
      2. 11.2.2. Supplier Relationships:
      3. 11.2.3. Business Processes:
      4. 11.2.4. Securing the Product:
    3. 11.3. Raw Materials Sources of Mica Major Manufacturers in 2016
    4. 11.4. Downstream Buyers
    5. 11.5. Distributors/Traders List
  12. CHAPTER 12. Marketing Strategy Analysis, Distributors
    1. 12.1. Marketing Channel
    2. 12.2. Direct Marketing
    3. 12.3. Indirect Marketing
    4. 12.4. Marketing Channel Development Trend
    5. 12.5. Economic/Political Environmental Change
  13. CHAPTER 13. Report Conclusion
  14. CHAPTER 14. Research Approach & Methodology
    1. 14.1. Report Description
    2. 14.2. Research Scope
    3. 14.3. Research Methodology
      1. 14.3.1. Secondary Research
      2. 14.3.2. Primary Research
      3. 14.3.3. Models
        1. 14.3.3.1. Company Share Analysis Model
        2. 14.3.3.2. Revenue Based Modeling
        3. 14.3.3.3. Research Limitations

        List of Figures

        FIG. 1 Global Mica Market, 2016-2026 (USD Million)
        FIG. 2 Global Mica Market Share, by Type, 2019 & 2026 (USD Million)
        FIG. 3 Global Mica Market share, by Type, 2019 & 2026 (Kilo Tons)
        FIG. 4 Global Natural Mica Market, 2016-2026 (USD Million)
        FIG. 5 Global Natural Mica  Market, 2016-2026 (Kilo Tons)
        FIG. 6 Global Synthetic Mica Market, 2016-2026 (USD Million)
        FIG. 7 Global Synthetic Mica  Market, 2016-2026 (Kilo Tons)
        FIG. 8 Global Mica Market Share, by Grade, 2019 & 2026 (USD Million)
        FIG. 9 Global Mica Market share, by Grade, 2019 & 2026 (Kilo Tons)
        FIG. 10 Global Ground Mica Market, 2016-2026 (USD Million)
        FIG. 11 Global Ground Mica  Market, 2016-2026 (Kilo Tons)
        FIG. 12 Global Sheet Mica Market, 2016-2026 (USD Million)
        FIG. 13 Global Sheet Mica  Market, 2016-2026 (Kilo Tons)
        FIG. 14 Global Built-Up Mica Market, 2016-2026 (USD Million)
        FIG. 15 Global Built-Up Mica  Market, 2016-2026 (Kilo Tons)
        FIG. 16 Global Mica Market Share, by End-User, 2019 & 2026 (USD Million)
        FIG. 17 Global Mica Market share, by End-User, 2019 & 2026 (Kilo Tons)
        FIG. 18 Global Electrical & Electronics Mica Market, 2016-2026 (USD Million)
        FIG. 19 Global Electrical & Electronics Mica  Market, 2016-2026 (Kilo Tons)
        FIG. 20 Global Cosmetics & Personal Care Mica Market, 2016-2026 (USD Million)
        FIG. 21 Global Cosmetics & Personal Care Mica  Market, 2016-2026 (Kilo Tons)
        FIG. 22 Global Construction Mica Market, 2016-2026 (USD Million)
        FIG. 23 Global Construction Mica  Market, 2016-2026 (Kilo Tons)
        FIG. 24 Global Paint & Coating Mica Market, 2016-2026 (USD Million)
        FIG. 25 Global Paint & Coating Mica  Market, 2016-2026 (Kilo Tons)
        FIG. 26 Global Others Mica Market, 2016-2026 (USD Million)
        FIG. 27 Global Others Mica  Market, 2016-2026 (Kilo Tons)
        FIG. 28 Global Mica Market Share, by Region, 2019 & 2026
        FIG. 29 Global Mica Market Share, by Region, 2019 & 2026
        FIG. 30 North America Mica Market, 2016-2026
        FIG. 31 North America Mica  Market, 2016-2026 (Kilo Tons)
        FIG. 32 U.S. Mica Market, 2016-2026
        FIG. 33 U.S. Mica  Market, 2016-2026 (Kilo Tons)
        FIG. 34 Canada Mica Market, 2016-2026
        FIG. 35 Canada Mica  Market, 2016-2026 (Kilo Tons)
        FIG. 36 Europe Mica Market, 2016-2026
        FIG. 37 Europe Mica  Market, 2016-2026 (Kilo Tons)
        FIG. 38 Germany Mica Market, 2016-2026
        FIG. 39 Germany Mica  Market, 2016-2026 (Kilo Tons)
        FIG. 40 France Mica Market, 2016-2026
        FIG. 41 France Mica  Market, 2016-2026 (Kilo Tons)
        FIG. 42 U.K. Mica Market, 2016-2026
        FIG. 43 U.K. Mica  Market, 2016-2026 (Kilo Tons)
        FIG. 44 Italy Mica Market, 2016-2026
        FIG. 45 Italy Mica  Market, 2016-2026 (Kilo Tons)
        FIG. 46 Spain Mica Market, 2016-2026
        FIG. 47 Spain Mica  Market, 2016-2026 (Kilo Tons)
        FIG. 48 Rest of Europe Mica Market, 2016-2026
        FIG. 49 Rest of Europe Mica  Market, 2016-2026 (Kilo Tons)
        FIG. 50 Asia Pacific Mica Market, 2016-2026
        FIG. 51 Asia Pacific Mica  Market, 2016-2026 (Kilo Tons)
        FIG. 52 China Mica Market, 2016-2026
        FIG. 53 China Mica  Market, 2016-2026 (Kilo Tons)
        FIG. 54 Japan Mica Market, 2016-2026
        FIG. 55 Japan Mica  Market, 2016-2026 (Kilo Tons)
        FIG. 56 India Mica Market, 2016-2026
        FIG. 57 India Mica  Market, 2016-2026 (Kilo Tons)
        FIG. 58 South  Korea Mica Market, 2016-2026
        FIG. 59 South  Korea Mica  Market, 2016-2026 (Kilo Tons)
        FIG. 60 South-East Asia Mica Market, 2016-2026
        FIG. 61 South-East Asia Mica  Market, 2016-2026 (Kilo Tons)
        FIG. 62 Rest of Asia Pacific Mica Market, 2016-2026
        FIG. 63 Rest of Asia Pacific Mica  Market, 2016-2026 (Kilo Tons)
        FIG. 64 Latin America Mica Market, 2016-2026
        FIG. 65 Latin America Mica  Market, 2016-2026 (Kilo Tons)
        FIG. 66 Brazil Mica Market, 2016-2026
        FIG. 67 Brazil Mica  Market, 2016-2026 (Kilo Tons)
        FIG. 68 Mexico Mica Market, 2016-2026
        FIG. 69 Mexico Mica  Market, 2016-2026 (Kilo Tons)
        FIG. 70 Rest of Latin America Mica Market, 2016-2026
        FIG. 71 Rest of Latin America Mica  Market, 2016-2026 (Kilo Tons)
        FIG. 72 The Middle-East and Africa Mica Market, 2016-2026
        FIG. 73 The Middle-East and Africa Mica  Market, 2016-2026 (Kilo Tons)
        FIG. 74 GCC Countries Mica Market, 2016-2026
        FIG. 75 GCC Countries Mica  Market, 2016-2026 (Kilo Tons)
        FIG. 76 South Africa Mica Market, 2016-2026
        FIG. 77 South Africa Mica  Market, 2016-2026 (Kilo Tons)
        FIG. 78 Rest of Middle-East Africa Mica Market, 2016-2026
        FIG. 79 Rest of Middle-East Africa Mica  Market, 2016-2026 (Kilo Tons)
        FIG. 80 Global Mica production and revenue, 2016-2026 (USD Million) (Kilo Tons)
        FIG. 81 North America Mica production and revenue, 2016-2026 (USD Million) (Kilo Tons)
        FIG. 82 Europe Mica production and revenue, 2016-2026 (USD Million) (Kilo Tons)
        FIG. 83 Asia Pacific Mica production and revenue, 2016-2026 (USD Million) (Kilo Tons)
        FIG. 84 Latin America Mica production and revenue, 2016-2026 (USD Million) (Kilo Tons)
        FIG. 85 Middle East and Africa Mica production and revenue, 2016-2026 (USD Million) (Kilo Tons)
        FIG. 86 Competitor Market Share – Revenue
        FIG. 87 Competitor Market Share – Volume
        FIG. 88 BASF Catalysts Revenue and Growth Rate
        FIG. 89 BASF Catalysts Market Share
        FIG. 90 Daruka Minerals Revenue and Growth Rate
        FIG. 91 Daruka Minerals Market Share
        FIG. 92 Premier Mica Company Revenue and Growth Rate
        FIG. 93 Premier Mica Company Market Share
        FIG. 94 Mica Manufacturing Revenue and Growth Rate
        FIG. 95 Mica Manufacturing Market Share
        FIG. 96 COGEBI N.V. Revenue and Growth Rate
        FIG. 97 COGEBI N.V. Market Share
        FIG. 98 Gunpatroy Private Limited Revenue and Growth Rate
        FIG. 99 Gunpatroy Private Limited Market Share
        FIG. 100 Asheville-Schoonmaker Mica Company Revenue and Growth Rate
        FIG. 101 Asheville-Schoonmaker Mica Company Market Share
        FIG. 102 Cleveland Mica Company Revenue and Growth Rate
        FIG. 103 Cleveland Mica Company Market Share
        FIG. 104 Franklin Industrial Minerals Co. Revenue and Growth Rate
        FIG. 105 Franklin Industrial Minerals Co. Market Share
        FIG. 106 Imerys Revenue and Growth Rate
        FIG. 107 Imerys Market Share
        FIG. 108 Others Revenue and Growth Rate
        FIG. 109 Others Market Share
        FIG. 110 Market Dynamics
        FIG. 111 Global Mica – Value Chain Analysis
        FIG. 112 Key Mandates and Regulations
        FIG. 113 Technology Roadmap and Timeline
        FIG. 114 Market Attractiveness Analysis – By Type
        FIG. 115 Market Attractiveness Analysis – By Grade
        FIG. 116 Market Attractiveness Analysis – By End-User
        FIG. 117 Market Attractiveness Analysis – By Region
        FIG. 118 Manufacturing Cost Structure of Mica
        FIG. 119 Mica Industrial Chain Analysis
        FIG. 120 Market Channel
        FIG. 121 Marketing Channel Development Trend
        FIG. 122 Growth in World Gross Product, 2008-2018

        List of Tables

        TABLE 1 Global Mica market, 2019 & 2026 (USD Million)
        TABLE 2 Global Mica market, by Type, 2016-2026 (USD Million)
        TABLE 3 Global Mica market, by Type, 2016-2026 (Kilo Tons)
        TABLE 4 Global Mica market, by Grade, 2016-2026 (USD Million)
        TABLE 5 Global Mica market, by Grade, 2016-2026 (Kilo Tons)
        TABLE 6 Global Mica market, by End-User, 2016-2026 (USD Million)
        TABLE 7 Global Mica market, by End-User, 2016-2026 (Kilo Tons)
        TABLE 8 Global Mica market, by region, 2016-2026 (USD Million)
        TABLE 9 Global Mica market, by region, 2016-2026 (Kilo Tons)
        TABLE 10 North America Mica Market, by Type, 2016-2026 (USD Million)
        TABLE 11 North America Mica Market, by Type, 2016-2026 (Kilo Tons)
        TABLE 12 North America Mica Market, by Grade, 2016-2026 (USD Million)
        TABLE 13 North America Mica Market, by Grade, 2016-2026 (Kilo Tons)
        TABLE 14 North America Mica Market, by End-User, 2016-2026 (USD Million)
        TABLE 15 North America Mica Market, by End-User, 2016-2026 (Kilo Tons)
        TABLE 16 Europe Mica Market, by Type, 2016-2026 (USD Million)
        TABLE 17 Europe Mica Market, by Type, 2016-2026 (Kilo Tons)
        TABLE 18 Europe Mica Market, by Grade, 2016-2026 (USD Million)
        TABLE 19 Europe Mica Market, by Grade, 2016-2026 (Kilo Tons)
        TABLE 20 Europe Mica Market, by End-User, 2016-2026 (USD Million)
        TABLE 21 Europe Mica Market, by End-User, 2016-2026 (Kilo Tons)
        TABLE 22 Asia Pacific Mica Market, by Type, 2016-2026 (USD Million)
        TABLE 23 Asia Pacific Mica Market, by Type, 2016-2026 (Kilo Tons)
        TABLE 24 Asia Pacific Mica Market, by Grade, 2016-2026 (USD Million)
        TABLE 25 Asia Pacific Mica Market, by Grade, 2016-2026 (Kilo Tons)
        TABLE 26 Asia Pacific Mica Market, by End-User, 2016-2026 (USD Million)
        TABLE 27 Asia Pacific Mica Market, by End-User, 2016-2026 (Kilo Tons)
        TABLE 28 Latin America Mica Market, by Type, 2016-2026 (USD Million)
        TABLE 29 Latin America Mica Market, by Type, 2016-2026 (Kilo Tons)
        TABLE 30 Latin America Mica Market, by Grade, 2016-2026 (USD Million)
        TABLE 31 Latin America Mica Market, by Grade, 2016-2026 (Kilo Tons)
        TABLE 32 Latin America Mica Market, by End-User, 2016-2026 (USD Million)
        TABLE 33 Latin America Mica Market, by End-User, 2016-2026 (Kilo Tons)
        TABLE 34 The Middle-East and Africa Mica Market, by Type, 2016-2026 (USD Million)
        TABLE 35 The Middle-East and Africa Mica Market, by Type, 2016-2026 (Kilo Tons)
        TABLE 36 The Middle-East and Africa Mica Market, by Grade, 2016-2026 (USD Million)
        TABLE 37 The Middle-East and Africa Mica Market, by Grade, 2016-2026 (Kilo Tons)
        TABLE 38 The Middle-East and Africa Mica Market, by End-User, 2016-2026 (USD Million)
        TABLE 39 The Middle-East and Africa Mica Market, by End-User, 2016-2026 (Kilo Tons)
        TABLE 40 North America Mica Production, Consumption, Export, Import, 2016-2019
        TABLE 41 Europe Mica Production, Consumption, Export, Import, 2016-2019
        TABLE 42 Asia Pacific Mica Production, Consumption, Export, Import, 2016-2019
        TABLE 43 Latin America Mica Production, Consumption, Export, Import, 2016-2019
        TABLE 44 The Middle East & Africa Mica Production, Consumption, Export, Import, 2016-2019
        TABLE 45 Global Mica Market - Company Revenue Analysis 2016-2019 (USD Million)
        TABLE 46 Global Mica Market - Company Revenue Share Analysis 2016-2019(%)
        TABLE 47 Global Mica Market - Company Volume Analysis 2016-2019 (Kilo Tons)
        TABLE 48 Global Mica Market - Company Volume Share Analysis 2016-2019(%)
        TABLE 49 Acquisitions and Mergers
        TABLE 50 New Product/Service Launch
        TABLE 51 Research & Development Activities
        TABLE 52 Market Drivers
        TABLE 53 Market Restraints
        TABLE 54 Market Opportunities
        TABLE 55 Production Base and Market Concentration Rate of Raw Material
        TABLE 56 Key Suppliers of Raw Materials
        TABLE 57 Raw Materials Sources of Mica Major Manufacturers in 2016
        TABLE 58 Major Buyers of Mica
        TABLE 59 Distributors/Traders of Mica by Region

Industry Major Market Players

  • COGEBI
  •  BASF Catalysts
  •  Daruka Minerals
  •  Premier Mica Company
  •  Mica Manufacturing
  •  Gunpatroy
  • Cleveland Mica Company
  • Franklin Industrial Minerals
  • Asheville-Schoonmaker Mica
  • Imerysamong