List of Figures
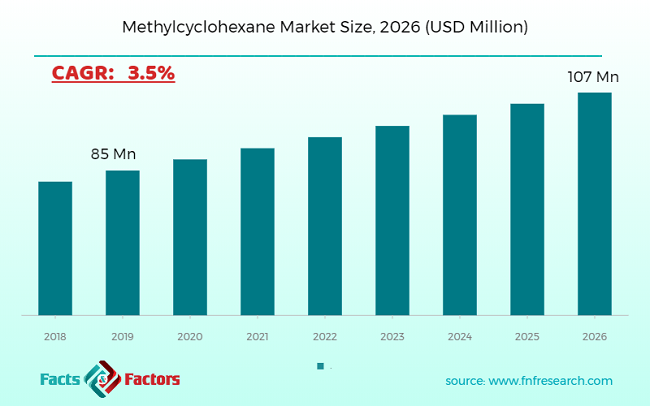
FIG. 1 Global Methylcyclohexane Market, 2013-2024 (USD Million)
FIG. 2 Global Methylcyclohexane Market Share, by Purity, 2018 & 2025 (USD Million)
FIG. 3 Global Methylcyclohexane Market share, by Type, 2018 & 2025 (Kilo Tons)
FIG. 4 Global >99% Methylcyclohexane Market, 2013-2024 (USD Million)
FIG. 5 Global >99% Methylcyclohexane Market, 2013-2024 (Kilo Tons)
FIG. 6 Global 98%-99% Methylcyclohexane Market, 2013-2024 (USD Million)
FIG. 7 Global 98%-99% Methylcyclohexane Market, 2013-2024 (Kilo Tons)
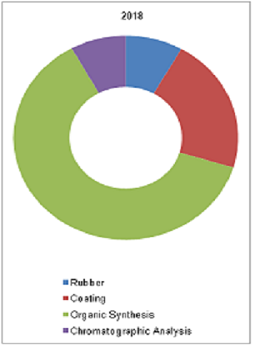
FIG. 8 Global Methylcyclohexane Market Share, by Application, 2018 & 2025 (USD Million)
FIG. 9 Global Methylcyclohexane Market share, by Application, 2018 & 2025 (Kilo Tons)
FIG. 10 Global Rubber Methylcyclohexane Market, 2013-2024 (USD Million)
FIG. 11 Global Rubber Methylcyclohexane Market, 2013-2024 (Kilo Tons)
FIG. 12 Global Coating Methylcyclohexane Market, 2013-2024 (USD Million)
FIG. 13 Global Coating Methylcyclohexane Market, 2013-2024 (Kilo Tons)
FIG. 14 Global Organic Synthesis Methylcyclohexane Market, 2013-2024 (USD Million)
FIG. 15 Global Organic Synthesis Methylcyclohexane Market, 2013-2024 (Kilo Tons)
FIG. 16 Global Chromatographic Analysis Methylcyclohexane Market, 2013-2024 (USD Million)
FIG. 17 Global Chromatographic Analysis Methylcyclohexane Market, 2013-2024 (Kilo Tons)
FIG. 18 Global Methylcyclohexane Market Share, by Sales Channel, 2018 & 2025 (USD Million)
FIG. 19 Global Methylcyclohexane Market share, by Type, 2018 & 2025 (Kilo Tons)
FIG. 20 Global Direct Sales Methylcyclohexane Market, 2013-2024 (USD Million)
FIG. 21 Global Direct Sales Methylcyclohexane Market, 2013-2024 (Kilo Tons)
FIG. 22 Global Distributor Methylcyclohexane Market, 2013-2024 (USD Million)
FIG. 23 Global Distributor Methylcyclohexane Market, 2013-2024 (Kilo Tons)
FIG. 24 Global Methylcyclohexane Market Share, by Region, 2018 & 2025
FIG. 25 Global Methylcyclohexane Market Share, by Region, 2018 & 2025
FIG. 26 North America Methylcyclohexane Market, 2013-2024
FIG. 27 North America Methylcyclohexane Market, 2013-2024 (Kilo Tons)
FIG. 28 U.S. Methylcyclohexane Market, 2013-2024
FIG. 29 U.S. Methylcyclohexane Market, 2013-2024 (Kilo Tons)
FIG. 30 Canada Methylcyclohexane Market, 2013-2024
FIG. 31 Canada Methylcyclohexane Market, 2013-2024 (Kilo Tons)
FIG. 32 Europe Methylcyclohexane Market, 2013-2024
FIG. 33 Europe Methylcyclohexane Market, 2013-2024 (Kilo Tons)
FIG. 34 Germany Methylcyclohexane Market, 2013-2024
FIG. 35 Germany Methylcyclohexane Market, 2013-2024 (Kilo Tons)
FIG. 36 France Methylcyclohexane Market, 2013-2024
FIG. 37 France Methylcyclohexane Market, 2013-2024 (Kilo Tons)
FIG. 38 U.K. Methylcyclohexane Market, 2013-2024
FIG. 39 U.K. Methylcyclohexane Market, 2013-2024 (Kilo Tons)
FIG. 40 Italy Methylcyclohexane Market, 2013-2024
FIG. 41 Italy Methylcyclohexane Market, 2013-2024 (Kilo Tons)
FIG. 42 Spain Methylcyclohexane Market, 2013-2024
FIG. 43 Spain Methylcyclohexane Market, 2013-2024 (Kilo Tons)
FIG. 44 Rest of Europe Methylcyclohexane Market, 2013-2024
FIG. 45 Rest of Europe Methylcyclohexane Market, 2013-2024 (Kilo Tons)
FIG. 46 Asia Pacific Methylcyclohexane Market, 2013-2024
FIG. 47 Asia Pacific Methylcyclohexane Market, 2013-2024 (Kilo Tons)
FIG. 48 China Methylcyclohexane Market, 2013-2024
FIG. 49 China Methylcyclohexane Market, 2013-2024 (Kilo Tons)
FIG. 50 Japan Methylcyclohexane Market, 2013-2024
FIG. 51 Japan Methylcyclohexane Market, 2013-2024 (Kilo Tons)
FIG. 52 India Methylcyclohexane Market, 2013-2024
FIG. 53 India Methylcyclohexane Market, 2013-2024 (Kilo Tons)
FIG. 54 South Korea Methylcyclohexane Market, 2013-2024
FIG. 55 South Korea Methylcyclohexane Market, 2013-2024 (Kilo Tons)
FIG. 56 South-East Asia Methylcyclohexane Market, 2013-2024
FIG. 57 South-East Asia Methylcyclohexane Market, 2013-2024 (Kilo Tons)
FIG. 58 Rest of Asia Pacific Methylcyclohexane Market, 2013-2024
FIG. 59 Rest of Asia Pacific Methylcyclohexane Market, 2013-2024 (Kilo Tons)
FIG. 60 Latin America Methylcyclohexane Market, 2013-2024
FIG. 61 Latin America Methylcyclohexane Market, 2013-2024 (Kilo Tons)
FIG. 62 Brazil Methylcyclohexane Market, 2013-2024
FIG. 63 Brazil Methylcyclohexane Market, 2013-2024 (Kilo Tons)
FIG. 64 Mexico Methylcyclohexane Market, 2013-2024
FIG. 65 Mexico Methylcyclohexane Market, 2013-2024 (Kilo Tons)
FIG. 66 Rest of Latin America Methylcyclohexane Market, 2013-2024
FIG. 67 Rest of Latin America Methylcyclohexane Market, 2013-2024 (Kilo Tons)
FIG. 68 The Middle-East and Africa Methylcyclohexane Market, 2013-2024
FIG. 69 The Middle-East and Africa Methylcyclohexane Market, 2013-2024 (Kilo Tons)
FIG. 70 GCC Countries Methylcyclohexane Market, 2013-2024
FIG. 71 GCC Countries Methylcyclohexane Market, 2013-2024 (Kilo Tons)
FIG. 72 South Africa Methylcyclohexane Market, 2013-2024
FIG. 73 South Africa Methylcyclohexane Market, 2013-2024 (Kilo Tons)
FIG. 74 Rest of Middle-East Africa Methylcyclohexane Market, 2013-2024
FIG. 75 Rest of Middle-East Africa Methylcyclohexane Market, 2013-2024 (Kilo Tons)
FIG. 76 Global Methylcyclohexane Production and Revenue, 2015-2025 (USD Million) (Kilo Tons)
FIG. 77 North America Methylcyclohexane production and revenue, 2015-2025 (USD Million) (Kilo Tons)
FIG. 78 Europe Methylcyclohexane production and revenue, 2015-2025 (USD Million) (Kilo Tons)
FIG. 79 Asia Pacific Methylcyclohexane production and revenue, 2015-2025 (USD Million) (Kilo Tons)
FIG. 80 Latin America Methylcyclohexane production and revenue, 2015-2025 (USD Million) (Kilo Tons)
FIG. 81 Middle East and Africa Methylcyclohexane production and revenue, 2015-2025 (USD Million) (Kilo Tons)
FIG. 82 Competitor Market Share – Revenue
FIG. 83 Competitor Market Share – Volume
FIG. 84 Chevron Philips Chemical Revenue and Growth Rate
FIG. 85 Chevron Philips Chemical Market Share
FIG. 86 Total Revenue and Growth Rate
FIG. 87 Total Market Share
FIG. 88 Huntsman Revenue and Growth Rate
FIG. 89 Huntsman Market Share
FIG. 90 Maruzen Petrochemical Revenue and Growth Rate
FIG. 91 Maruzen Petrochemical Market Share
FIG. 92 SK Revenue and Growth Rate
FIG. 93 SK Market Share
FIG. 94 TASCO Revenue and Growth Rate
FIG. 95 TASCO Market Share
FIG. 96 Jiangsu Yangnong Revenue and Growth Rate
FIG. 97 Jiangsu Yangnong Market Share
FIG. 98 Changde Chemical Revenue and Growth Rate
FIG. 99 Changde Chemical Market Share
FIG. 100 Baling Huaxing Revenue and Growth Rate
FIG. 101 Baling Huaxing Market Share
FIG. 102 Market Dynamics
FIG. 103 Global Methylcyclohexane – Value Chain Analysis
FIG. 104 Key Mandates and Regulations
FIG. 105 Technology Roadmap and Timeline
FIG. 106 Market Attractiveness Analysis – By Purity
FIG. 107 Market Attractiveness Analysis – By Application
FIG. 108 Market Attractiveness Analysis – By Sales Channel
FIG. 109 Market Attractiveness Analysis – By Region
FIG. 110 Methylcyclohexane Price Trend, 2013-2024 (USD/Kg)
FIG. 111 Manufacturing Cost Structure of Methylcyclohexane
FIG. 112 Methylcyclohexane Industrial Chain Analysis
FIG. 113 Market Channel
FIG. 114 Marketing Channel Development Trend
FIG. 115 Growth in World Gross Product, 2008-2018
List of Tables
TABLE 1 Global Methylcyclohexane Market, 2018 & 2025 (USD Million)
TABLE 2 Global Methylcyclohexane Market, by Purity, 2013-2024 (USD Million)
TABLE 3 Global Methylcyclohexane Market, by Purity, 2013-2024 (Kilo Tons)
TABLE 4 Global Methylcyclohexane Market, by Application, 2013-2024 (USD Million)
TABLE 5 Global Methylcyclohexane Market, by Application, 2013-2024 (Kilo Tons)
TABLE 6 Global Methylcyclohexane Market, by Sales Channel, 2013-2024 (USD Million)
TABLE 7 Global Methylcyclohexane Market, by Sales Channel, 2013-2024 (Kilo Tons)
TABLE 8 Global Methylcyclohexane Market, by region, 2013-2024 (USD Million)
TABLE 9 Global Methylcyclohexane Market, by region, 2013-2024 (Kilo Tons)
TABLE 10 North America Methylcyclohexane Market, by Purity, 2013-2024 (USD Million)
TABLE 11 North America Methylcyclohexane Market, by Purity, 2013-2024 (Kilo Tons)
TABLE 12 North America Methylcyclohexane Market, by Application, 2013-2024 (USD Million)
TABLE 13 North America Methylcyclohexane Market, by Application, 2013-2024 (Kilo Tons)
TABLE 14 North America Methylcyclohexane Market, by Sales Channel, 2013-2024 (USD Million)
TABLE 15 North America Methylcyclohexane Market, by Sales Channel, 2013-2024 (Kilo Tons)
TABLE 16 U.S. Methylcyclohexane Market, by Purity, 2013-2024 (USD Million)
TABLE 17 U.S. Methylcyclohexane Market, by Purity, 2013-2024 (Kilo Tons)
TABLE 18 U.S. Methylcyclohexane Market, by Application, 2013-2024 (USD Million)
TABLE 19 U.S. Methylcyclohexane Market, by Application, 2013-2024 (Kilo Tons)
TABLE 20 U.S. Methylcyclohexane Market, by Sales Channel, 2013-2024 (USD Million)
TABLE 21 U.S. Methylcyclohexane Market, by Sales Channel, 2013-2024 (Kilo Tons)
TABLE 22 Canada Methylcyclohexane Market, by Purity, 2013-2024 (USD Million)
TABLE 23 Canada Methylcyclohexane Market, by Purity, 2013-2024 (Kilo Tons)
TABLE 24 Canada Methylcyclohexane Market, by Application, 2013-2024 (USD Million)
TABLE 25 Canada Methylcyclohexane Market, by Application, 2013-2024 (Kilo Tons)
TABLE 26 Canada Methylcyclohexane Market, by Sales Channel, 2013-2024 (USD Million)
TABLE 27 Canada Methylcyclohexane Market, by Sales Channel, 2013-2024 (Kilo Tons)
TABLE 28 Europe Methylcyclohexane Market, by Purity, 2013-2024 (USD Million)
TABLE 29 Europe Methylcyclohexane Market, by Purity, 2013-2024 (Kilo Tons)
TABLE 30 Europe Methylcyclohexane Market, by Application, 2013-2024 (USD Million)
TABLE 31 Europe Methylcyclohexane Market, by Application, 2013-2024 (Kilo Tons)
TABLE 32 Europe Methylcyclohexane Market, by Sales Channel, 2013-2024 (USD Million)
TABLE 33 Europe Methylcyclohexane Market, by Sales Channel, 2013-2024 (Kilo Tons)
TABLE 34 Germany Methylcyclohexane Market, by Purity, 2013-2024 (USD Million)
TABLE 35 Germany Methylcyclohexane Market, by Purity, 2013-2024 (Kilo Tons)
TABLE 36 Germany Methylcyclohexane Market, by Application, 2013-2024 (USD Million)
TABLE 37 Germany Methylcyclohexane Market, by Application, 2013-2024 (Kilo Tons)
TABLE 38 Germany Methylcyclohexane Market, by Sales Channel, 2013-2024 (USD Million)
TABLE 39 Germany Methylcyclohexane Market, by Sales Channel, 2013-2024 (Kilo Tons)
TABLE 40 France Methylcyclohexane Market, by Purity, 2013-2024 (USD Million)
TABLE 41 France Methylcyclohexane Market, by Purity, 2013-2024 (Kilo Tons)
TABLE 42 France Methylcyclohexane Market, by Application, 2013-2024 (USD Million)
TABLE 43 France Methylcyclohexane Market, by Application, 2013-2024 (Kilo Tons)
TABLE 44 France Methylcyclohexane Market, by Sales Channel, 2013-2024 (USD Million)
TABLE 45 France Methylcyclohexane Market, by Sales Channel, 2013-2024 (Kilo Tons)
TABLE 46 U.K. Methylcyclohexane Market, by Purity, 2013-2024 (USD Million)
TABLE 47 U.K. Methylcyclohexane Market, by Purity, 2013-2024 (Kilo Tons)
TABLE 48 U.K. Methylcyclohexane Market, by Application, 2013-2024 (USD Million)
TABLE 49 U.K. Methylcyclohexane Market, by Application, 2013-2024 (Kilo Tons)
TABLE 50 U.K. Methylcyclohexane Market, by Sales Channel, 2013-2024 (USD Million)
TABLE 51 U.K. Methylcyclohexane Market, by Sales Channel, 2013-2024 (Kilo Tons)
TABLE 52 Italy Methylcyclohexane Market, by Purity, 2013-2024 (USD Million)
TABLE 53 Italy Methylcyclohexane Market, by Purity, 2013-2024 (Kilo Tons)
TABLE 54 Italy Methylcyclohexane Market, by Application, 2013-2024 (USD Million)
TABLE 55 Italy Methylcyclohexane Market, by Application, 2013-2024 (Kilo Tons)
TABLE 56 Italy Methylcyclohexane Market, by Sales Channel, 2013-2024 (USD Million)
TABLE 57 Italy Methylcyclohexane Market, by Sales Channel, 2013-2024 (Kilo Tons)
TABLE 58 Spain Methylcyclohexane Market, by Purity, 2013-2024 (USD Million)
TABLE 59 Spain Methylcyclohexane Market, by Purity, 2013-2024 (Kilo Tons)
TABLE 60 Spain Methylcyclohexane Market, by Application, 2013-2024 (USD Million)
TABLE 61 Spain Methylcyclohexane Market, by Application, 2013-2024 (Kilo Tons)
TABLE 62 Spain Methylcyclohexane Market, by Sales Channel, 2013-2024 (USD Million)
TABLE 63 Spain Methylcyclohexane Market, by Sales Channel, 2013-2024 (Kilo Tons)
TABLE 64 Rest of Europe Methylcyclohexane Market, by Purity, 2013-2024 (USD Million)
TABLE 65 Rest of Europe Methylcyclohexane Market, by Purity, 2013-2024 (Kilo Tons)
TABLE 66 Rest of Europe Methylcyclohexane Market, by Application, 2013-2024 (USD Million)
TABLE 67 Rest of Europe Methylcyclohexane Market, by Application, 2013-2024 (Kilo Tons)
TABLE 68 Rest of Europe Methylcyclohexane Market, by Sales Channel, 2013-2024 (USD Million)
TABLE 69 Rest of Europe Methylcyclohexane Market, by Sales Channel, 2013-2024 (Kilo Tons)
TABLE 70 Asia Pacific Methylcyclohexane Market, by Purity, 2013-2024 (USD Million)
TABLE 71 Asia Pacific Methylcyclohexane Market, by Purity, 2013-2024 (Kilo Tons)
TABLE 72 Asia Pacific Methylcyclohexane Market, by Application, 2013-2024 (USD Million)
TABLE 73 Asia Pacific Methylcyclohexane Market, by Application, 2013-2024 (Kilo Tons)
TABLE 74 Asia Pacific Methylcyclohexane Market, by Sales Channel, 2013-2024 (USD Million)
TABLE 75 Asia Pacific Methylcyclohexane Market, by Sales Channel, 2013-2024 (Kilo Tons)
TABLE 76 China Methylcyclohexane Market, by Purity, 2013-2024 (USD Million)
TABLE 77 China Methylcyclohexane Market, by Purity, 2013-2024 (Kilo Tons)
TABLE 78 China Methylcyclohexane Market, by Application, 2013-2024 (USD Million)
TABLE 79 China Methylcyclohexane Market, by Application, 2013-2024 (Kilo Tons)
TABLE 80 China Methylcyclohexane Market, by Sales Channel, 2013-2024 (USD Million)
TABLE 81 China Methylcyclohexane Market, by Sales Channel, 2013-2024 (Kilo Tons)
TABLE 82 Japan Methylcyclohexane Market, by Purity, 2013-2024 (USD Million)
TABLE 83 Japan Methylcyclohexane Market, by Purity, 2013-2024 (Kilo Tons)
TABLE 84 Japan Methylcyclohexane Market, by Application, 2013-2024 (USD Million)
TABLE 85 Japan Methylcyclohexane Market, by Application, 2013-2024 (Kilo Tons)
TABLE 86 Japan Methylcyclohexane Market, by Sales Channel, 2013-2024 (USD Million)
TABLE 87 Japan Methylcyclohexane Market, by Sales Channel, 2013-2024 (Kilo Tons)
TABLE 88 India Methylcyclohexane Market, by Purity, 2013-2024 (USD Million)
TABLE 89 India Methylcyclohexane Market, by Purity, 2013-2024 (Kilo Tons)
TABLE 90 India Methylcyclohexane Market, by Application, 2013-2024 (USD Million)
TABLE 91 India Methylcyclohexane Market, by Application, 2013-2024 (Kilo Tons)
TABLE 92 India Methylcyclohexane Market, by Sales Channel, 2013-2024 (USD Million)
TABLE 93 India Methylcyclohexane Market, by Sales Channel, 2013-2024 (Kilo Tons)
TABLE 94 South Korea Methylcyclohexane Market, by Purity, 2013-2024 (USD Million)
TABLE 95 South Korea Methylcyclohexane Market, by Purity, 2013-2024 (Kilo Tons)
TABLE 96 South Korea Methylcyclohexane Market, by Application, 2013-2024 (USD Million)
TABLE 97 South Korea Methylcyclohexane Market, by Application, 2013-2024 (Kilo Tons)
TABLE 98 South Korea Methylcyclohexane Market, by Sales Channel, 2013-2024 (USD Million)
TABLE 99 South Korea Methylcyclohexane Market, by Sales Channel, 2013-2024 (Kilo Tons)
TABLE 100 South-East Asia Methylcyclohexane Market, by Purity, 2013-2024 (USD Million)
TABLE 101 South-East Asia Methylcyclohexane Market, by Purity, 2013-2024 (Kilo Tons)
TABLE 102 South-East Asia Methylcyclohexane Market, by Application, 2013-2024 (USD Million)
TABLE 103 South-East Asia Methylcyclohexane Market, by Application, 2013-2024 (Kilo Tons)
TABLE 104 South-East Asia Methylcyclohexane Market, by Sales Channel, 2013-2024 (USD Million)
TABLE 105 South-East Asia Methylcyclohexane Market, by Sales Channel, 2013-2024 (Kilo Tons)
TABLE 106 Rest of Asia Pacific Methylcyclohexane Market, by Purity, 2013-2024 (USD Million)
TABLE 107 Rest of Asia Pacific Methylcyclohexane Market, by Purity, 2013-2024 (Kilo Tons)
TABLE 108 Rest of Asia Pacific Methylcyclohexane Market, by Application, 2013-2024 (USD Million)
TABLE 109 Rest of Asia Pacific Methylcyclohexane Market, by Application, 2013-2024 (Kilo Tons)
TABLE 110 Rest of Asia Pacific Methylcyclohexane Market, by Sales Channel, 2013-2024 (USD Million)
TABLE 111 Rest of Asia Pacific Methylcyclohexane Market, by Sales Channel, 2013-2024 (Kilo Tons)
TABLE 112 Latin America Methylcyclohexane Market, by Purity, 2013-2024 (USD Million)
TABLE 113 Latin America Methylcyclohexane Market, by Purity, 2013-2024 (Kilo Tons)
TABLE 114 Latin America Methylcyclohexane Market, by Application, 2013-2024 (USD Million)
TABLE 115 Latin America Methylcyclohexane Market, by Application, 2013-2024 (Kilo Tons)
TABLE 116 Latin America Methylcyclohexane Market, by Sales Channel, 2013-2024 (USD Million)
TABLE 117 Latin America Methylcyclohexane Market, by Sales Channel, 2013-2024 (Kilo Tons)
TABLE 118 Brazil Methylcyclohexane Market, by Purity, 2013-2024 (USD Million)
TABLE 119 Brazil Methylcyclohexane Market, by Purity, 2013-2024 (Kilo Tons)
TABLE 120 Brazil Methylcyclohexane Market, by Application, 2013-2024 (USD Million)
TABLE 121 Brazil Methylcyclohexane Market, by Application, 2013-2024 (Kilo Tons)
TABLE 122 Brazil Methylcyclohexane Market, by Sales Channel, 2013-2024 (USD Million)
TABLE 123 Brazil Methylcyclohexane Market, by Sales Channel, 2013-2024 (Kilo Tons)
TABLE 124 Mexico Methylcyclohexane Market, by Purity, 2013-2024 (USD Million)
TABLE 125 Mexico Methylcyclohexane Market, by Purity, 2013-2024 (Kilo Tons)
TABLE 126 Mexico Methylcyclohexane Market, by Application, 2013-2024 (USD Million)
TABLE 127 Mexico Methylcyclohexane Market, by Application, 2013-2024 (Kilo Tons)
TABLE 128 Mexico Methylcyclohexane Market, by Sales Channel, 2013-2024 (USD Million)
TABLE 129 Mexico Methylcyclohexane Market, by Sales Channel, 2013-2024 (Kilo Tons)
TABLE 130 Rest of Latin America Methylcyclohexane Market, by Purity, 2013-2024 (USD Million)
TABLE 131 Rest of Latin America Methylcyclohexane Market, by Purity, 2013-2024 (Kilo Tons)
TABLE 132 Rest of Latin America Methylcyclohexane Market, by Application, 2013-2024 (USD Million)
TABLE 133 Rest of Latin America Methylcyclohexane Market, by Application, 2013-2024 (Kilo Tons)
TABLE 134 Rest of Latin America Methylcyclohexane Market, by Sales Channel, 2013-2024 (USD Million)
TABLE 135 Rest of Latin America Methylcyclohexane Market, by Sales Channel, 2013-2024 (Kilo Tons)
TABLE 136 The Middle-East and Africa Methylcyclohexane Market, by Purity, 2013-2024 (USD Million)
TABLE 137 The Middle-East and Africa Methylcyclohexane Market, by Purity, 2013-2024 (Kilo Tons)
TABLE 138 The Middle-East and Africa Methylcyclohexane Market, by Application, 2013-2024 (USD Million)
TABLE 139 The Middle-East and Africa Methylcyclohexane Market, by Application, 2013-2024 (Kilo Tons)
TABLE 140 The Middle-East and Africa Methylcyclohexane Market, by Sales Channel, 2013-2024 (USD Million)
TABLE 141 The Middle-East and Africa Methylcyclohexane Market, by Sales Channel, 2013-2024 (Kilo Tons)
TABLE 142 GCC Countries Methylcyclohexane Market, by Purity, 2013-2024 (USD Million)
TABLE 143 GCC Countries Methylcyclohexane Market, by Purity, 2013-2024 (Kilo Tons)
TABLE 144 GCC Countries Methylcyclohexane Market, by Application, 2013-2024 (USD Million)
TABLE 145 GCC Countries Methylcyclohexane Market, by Application, 2013-2024 (Kilo Tons)
TABLE 146 GCC Countries Methylcyclohexane Market, by Sales Channel, 2013-2024 (USD Million)
TABLE 147 GCC Countries Methylcyclohexane Market, by Sales Channel, 2013-2024 (Kilo Tons)
TABLE 148 South Africa Methylcyclohexane Market, by Purity, 2013-2024 (USD Million)
TABLE 149 South Africa Methylcyclohexane Market, by Purity, 2013-2024 (Kilo Tons)
TABLE 150 South Africa Methylcyclohexane Market, by Application, 2013-2024 (USD Million)
TABLE 151 South Africa Methylcyclohexane Market, by Application, 2013-2024 (Kilo Tons)
TABLE 152 South Africa Methylcyclohexane Market, by Sales Channel, 2013-2024 (USD Million)
TABLE 153 South Africa Methylcyclohexane Market, by Sales Channel, 2013-2024 (Kilo Tons)
TABLE 154 Rest of Middle-East Africa Methylcyclohexane Market, by Purity, 2013-2024 (USD Million)
TABLE 155 Rest of Middle-East Africa Methylcyclohexane Market, by Purity, 2013-2024 (Kilo Tons)
TABLE 156 Rest of Middle-East Africa Methylcyclohexane Market, by Application, 2013-2024 (USD Million)
TABLE 157 Rest of Middle-East Africa Methylcyclohexane Market, by Application, 2013-2024 (Kilo Tons)
TABLE 158 Rest of Middle-East Africa Methylcyclohexane Market, by Sales Channel, 2013-2024 (USD Million)
TABLE 159 Rest of Middle-East Africa Methylcyclohexane Market, by Sales Channel, 2013-2024 (Kilo Tons)
TABLE 160 North America Methylcyclohexane Production, Consumption, Export, Import, 2015-2025
TABLE 161 Europe Methylcyclohexane Production, Consumption, Export, Import, 2015-2025
TABLE 162 Asia Pacific Methylcyclohexane Production, Consumption, Export, Import, 2015-2025
TABLE 163 Latin America Methylcyclohexane Production, Consumption, Export, Import, 2015-2025
TABLE 164 Middle East & Africa Methylcyclohexane Production, Consumption, Export, Import, 2015-2025
TABLE 165 Global Methylcyclohexane Market - Company Revenue Analysis 2013-2018 (USD Million)
TABLE 166 Global Methylcyclohexane Market - Company Revenue Share Analysis 2013-2018(%)
TABLE 167 Global Methylcyclohexane Market - Company Sales Volume Analysis 2013-2018 (Kilo Tons)
TABLE 168 Global Methylcyclohexane Market - Company Sales Volume Share Analysis 2013-2018(%)
TABLE 169 Acquisitions and Mergers
TABLE 170 New Product/Service Launch
TABLE 171 Research & Development Activities
TABLE 172 Market Drivers
TABLE 173 Market Restraints
TABLE 174 Market Opportunities
TABLE 175 Production Base and Market Concentration Rate of Raw Material
TABLE 176 Key Suppliers of Raw Materials
TABLE 177 Raw Materials Sources of Methylcyclohexane Major Manufacturers in 2016
TABLE 178 Major Buyers of Methylcyclohexane
TABLE 179 Distributors/Traders of Methylcyclohexane by Region

 Key Insights from Primary Research