Search Market Research Report

Discover Our Latest Reports
Discover Our Featured Reports
Discover Top Selling Reports

Methyl Bromide Market Size, Share Global Analysis Report, 2020–2026

report img

Methyl Bromide Market By Type (100% Purity and 98% Purity) and By Application (Fumigant, Pesticide, and Others): Global Industry Outlook, Market Size, Business Intelligence, Consumer Preferences, Statistical Surveys, Comprehensive Analysis, Historical Developments, Current Trends, and Forecast 2020–2026

Industry Insights

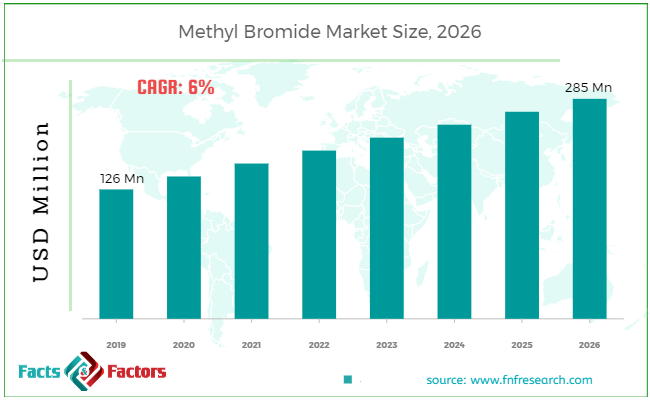
[175+ Pages Report] According to the report published by Facts Factors, the global methyl bromide market size was worth around USD 126 million in 2019 and is predicted to grow to around USD 285 million by 2026 with a compound annual growth rate (CAGR) of roughly 6% between 2020 and 2026. The report analyzes the global methyl bromide market drivers, restraints/challenges, and the effect they have on the demands during the projection period. In addition, the report explores emerging opportunities in the methyl bromide market.

Methyl Bromide Market Size

To know more about this report | Request Free Sample Copy

This specialized and expertise-oriented industry research report scrutinizes the technical and commercial business outlook of the Methyl Bromide industry. The report analyzes and declares the historical and current trends analysis of the Methyl Bromide industry and subsequently recommends the projected trends anticipated to be observed in the Methyl Bromide market during the upcoming years.

The methyl bromide market report analyzes and notifies the industry statistics at the global as well as regional and country levels in order to acquire a thorough perspective of the entire methyl Bromide market. The historical and past insights are provided for FY 2016 to FY 2019 whereas projected trends are delivered for FY 2020 to FY 2026. The quantitative and numerical data is represented in terms of both volume (Kilo Tons) and value (USD Million) from FY 2016 – 2026.


logoKey Insights from Primary Research

  • As per our primary respondents, the Methyl Bromide market is expected to grow annually at a rate of around 6%.
  • Through the analysis, it was established that the Methyl Bromide market was valued at around USD 126 million in 2019.
  • The “98% Purity” category, on the basis of type segmentation, was the leading revenue-generating category in 2019.
  • The “Fumigant” category, on the basis of application segmentation, was the leading revenue-generator category in the year 2019.
  • Methyl Bromide is majorly used for controlling pests in an affected area or as a pesticide to keep the insects away from the crops.

logoKey Recommendations from Analysts

  • As per our analysts, Methyl Bromide primarily used as a fumigant for pest management has a good penetrating ability, takes fast action, and is considered to be highly toxic for bugs and other insects.
  • Methyl Bromide is a harmful chemical and must be used under the guidance of an expert for preventing any kind of environmental hazard.
  • There is a need for innovating the use of Methyl Bromide by making it less harmful to the environment and other living things due to its properties of rapid action and penetrating capabilities.
  • For reducing the emission of methyl bromide, a two-layer system shall be used for collecting methyl bromide particles from the fumigated area.
  • Technological innovations are required in the production of methyl bromide products that are less harmful to the environment and other living things.

The quantitative data is further underlined and reinforced by comprehensive qualitative data which comprises various across-the-board market dynamics. The rationales which directly or indirectly impact the Methyl bromide industry are exemplified through parameters such as growth drivers, restraints, challenges, and opportunities among other impacting factors.

Throughout our research report, we have encompassed all the proven models and tools of industry analysis and extensively illustrated all the key business strategies and business models adopted in the Methyl Bromide industry. The report provides an all-inclusive and detailed competitive landscape prevalent in the Methyl Bromide market.

The report utilizes established industry analysis tools and models such as Porter’s Five Forces framework to analyze and recognize critical business strategies adopted by various stakeholders involved in the entire value chain of the Methyl Bromide industry. The Methyl Bromide market report additionally employs SWOT analysis and PESTLE analysis models for further in-depth analysis.

The report study further includes an in-depth analysis of industry players' market shares and provides an overview of leading players' market position in the Methyl Bromide sector. Key strategic developments in the Methyl Bromide market competitive landscape such as acquisitions & mergers, inaugurations of different products and services, partnerships & joint ventures, MoU agreements, VC & funding activities, R&D activities, and geographic expansion among other noteworthy activities by key players of the Methyl Bromide market are appropriately highlighted in the report.

Methyl Bromide also called Bromomethance is an odorless, colorless gas that is used mainly for pest control. It is an organobromine compound with the molecular formula CH3Br. It is generally considered very harmful and toxic to the environment and other living things. They are mainly used against the attacks of insects, moths, rodents, and nematodes. It is also used to provide protection for fruits, grains, and other products from pests during storage or transportation.

It is mainly used as a Fumigant for the control of pests in the affected areas. It is also used as a pesticide to keep insects away from crops but it is recommended to use it under supervision. Countries of the Asia Pacific region have significantly contributed to the rising demand for methyl bromide as there is suffice increase in the agricultural sector due to various factors such as the growing population and its demands, growing economies, and urbanization.

The Methyl Bromide market research report delivers an acute valuation and taxonomy of the Methyl Bromide industry by practically splitting the market on the basis of different types, applications, and regions. Through the analysis of the historical and projected trends, all the segments and sub-segments were evaluated through the bottom-up approach, and different market sizes have been projected for FY 2020 to FY 2026.

logoReport Scope

Report Attribute

Details

Market Size in 2019

USD 126 Million

Projected Market Size in 2026

USD 285 Million

CAGR Growth Rate

6% CAGR

Base Year

2019

Forecast Years

2020-2026

Key Market Players

Intech, Albemarle, ICL, Dalian Special Gases, CHEMCHINA, Great Lakes, Sunrise, TriveniInterchem, Chemtura, Trical, and Others.

Key Segment

By Type, Application, and Region

Major Regions Covered

North America, Europe, Asia Pacific, Latin America, and the Middle East & Africa

Purchase Options

Request customized purchase options to meet your research needs.Explore purchase options

The regional segmentation of the Methyl Bromide industry includes the complete classification of all the major continents including North America, Latin America, Europe, Asia Pacific, and the Middle East & Africa. Further, country-wise data for the Methyl Bromide industry is provided for the leading economies of the world.

The Methyl Bromide market is segmented based on Type and Application. On the basis of type segmentation, the market is classified into 100% purity and 98% purity. In terms of Application segmentation, the market is bifurcated into Fumigants, Pesticides, and Others.

logoSome of the essential players operating in the Methyl Bromide market, but not restricted to include

  • Intech
  •  Albemarle
  •  ICL
  •  Dalian Special Gases
  •  CHEMCHINA
  •  Great Lakes
  •  Sunrise
  • TriveniInterchem
  • Chemtura
  • Trical

The taxonomy of the Methyl Bromide Market by its scope and segmentation is as follows:

logoBy Type Segmentation Analysis

  • 100% Purity
  • 98% Purity

logoBy Application Segmentation Analysis

  • Fumigant
  • Pesticide
  • Others

logoBy Regional Segmentation Analysis

  • North America
    • The U.S.
    • Canada
  • Europe
    • Germany
    • The UK
    • France
    • Spain
    • Italy
    • Rest of Europe
  • Asia Pacific
    • China
    • Japan
    • India
    • South Korea
    • Southeast Asia
    • Rest of Asia Pacific
  • Latin America
    • Brazil
    • Mexico
    • Rest of Latin America
  • Middle East & Africa
    • GCC
    • South Africa
    • Rest of Middle East & Africa

Table of Content

  1. CHAPTER 1. Executive Summary
  2. CHAPTER 2. Methyl Bromide market – Type Analysis
    1. 2.1. Global Methyl Bromide Market – Type Overview
    2. 2.2. Global Methyl Bromide Market Share, by Type, 2018 & 2025 (USD Million)
    3. 2.3. Global Methyl Bromide Market share, by Type, 2018 & 2025 (Kilo Tons)
    4. 2.4. 100% Purity
      1. 2.4.1. Global 100% Purity Methyl Bromide Market, 2016-2026 (USD Million)
      2. 2.4.2. Global 100% Purity Methyl Bromide Market, 2016-2026 (Kilo Tons)
    5. 2.5. 98% Purity
      1. 2.5.1. Global 98% Purity Methyl Bromide Market, 2016-2026 (USD Million)
      2. 2.5.2. Global 98% Purity Methyl Bromide Market, 2016-2026 (Kilo Tons)
  3. CHAPTER 3. Methyl Bromide market – Application Analysis
    1. 3.1. Global Methyl Bromide Market – Application Overview
    2. 3.2. Global Methyl Bromide Market Share, by Application, 2018 & 2025 (USD Million)
    3. 3.3. Global Methyl Bromide Market share, by Application, 2018 & 2025 (Kilo Tons)
    4. 3.4. Fumigant
      1. 3.4.1. Global Fumigant Methyl Bromide Market, 2016-2026 (USD Million)
      2. 3.4.2. Global Fumigant Methyl Bromide Market, 2016-2026 (Kilo Tons)
    5. 3.5. Pesticide
      1. 3.5.1. Global Pesticide Methyl Bromide Market, 2016-2026 (USD Million)
      2. 3.5.2. Global Pesticide Methyl Bromide Market, 2016-2026 (Kilo Tons)
    6. 3.6. Others
      1. 3.6.1. Global Others Methyl Bromide Market, 2016-2026 (USD Million)
      2. 3.6.2. Global Others Methyl Bromide Market, 2016-2026 (Kilo Tons)
  4. CHAPTER 4. Methyl Bromide market – Regional Analysis
    1. 4.1. Global Methyl Bromide Market Regional Overview
    2. 4.2. Global Methyl Bromide Market Share, by Region, 2018 & 2025 (Value)
    3. 4.3. Global Methyl Bromide Market Share, by Region, 2018 & 2025 (Volume)
    4. 4.4. North America
      1. 4.4.1. North America Methyl Bromide Market size and forecast, 2016-2026
      2. 4.4.2. North America Methyl Bromide Market, by Country, 2018 - 2025 (USD Million)
      3. 4.4.3. North America Market size and forecast, 2016-2026 (Kilo Tons)
      4. 4.4.4. North America Methyl Bromide Market, by Country, 2018 - 2025 (Kilo Tons)
      5. 4.4.5. North America Methyl Bromide Market, by Type, 2016-2026
      6. 4.4.6. North America Methyl Bromide Market, by Application, 2016-2026
      7. 4.4.7. U.S.
      8. 4.4.8. Canada
    5. 4.5. Europe
      1. 4.5.1. Europe Methyl Bromide Market size and forecast, 2016-2026
      2. 4.5.2. Europe Methyl Bromide Market, by Country, 2018 - 2025 (USD Million)
      3. 4.5.3. Europe Market size and forecast, 2016-2026 (Kilo Tons)
      4. 4.5.4. Europe Methyl Bromide Market, by Country, 2018 - 2025 (Kilo Tons)
      5. 4.5.5. Europe Methyl Bromide Market, by Type, 2016-2026
      6. 4.5.6. Europe Methyl Bromide Market, by Application, 2016-2026
      7. 4.5.7. Germany
      8. 4.5.8. France
      9. 4.5.9. U.K.
      10. 4.5.10. Italy
      11. 4.5.11. Spain
      12. 4.5.12. Rest of Europe
    6. 4.6. Asia Pacific
      1. 4.6.1. Asia Pacific Methyl Bromide Market size and forecast, 2016-2026
      2. 4.6.2. Asia Pacific Methyl Bromide Market, by Country, 2018 - 2025 (USD Million)
      3. 4.6.3. Asia Pacific Market size and forecast, 2016-2026 (Kilo Tons)
      4. 4.6.4. Asia Pacific Methyl Bromide Market, by Country, 2018 - 2025 (Kilo Tons)
      5. 4.6.5. Asia Pacific Methyl Bromide Market, by Type, 2016-2026
      6. 4.6.6. Asia Pacific Methyl Bromide Market, by Application, 2016-2026
      7. 4.6.7. China
      8. 4.6.8. Japan
      9. 4.6.9. India
      10. 4.6.10. South Korea
      11. 4.6.11. South-East Asia
      12. 4.6.12. Rest of Asia Pacific
    7. 4.7. Latin America
      1. 4.7.1. Latin America Methyl Bromide Market size and forecast, 2016-2026
      2. 4.7.2. Latin America Methyl Bromide Market, by Country, 2018 - 2025 (USD Million)
      3. 4.7.3. Latin America Market size and forecast, 2016-2026 (Kilo Tons)
      4. 4.7.4. Latin America Methyl Bromide Market, by Country, 2018 - 2025 (Kilo Tons)
      5. 4.7.5. Latin America Methyl Bromide Market, by Type, 2016-2026
      6. 4.7.6. Latin America Methyl Bromide Market, by Application, 2016-2026
      7. 4.7.7. Brazil
      8. 4.7.8. Mexico
      9. 4.7.9. Rest of Latin America
    8. 4.8. The Middle-East and Africa
      1. 4.8.1. The Middle-East and Africa Methyl Bromide Market size and forecast, 2016-2026
      2. 4.8.2. The Middle-East and Africa Methyl Bromide Market, by Country, 2018 - 2025 (USD Million)
      3. 4.8.3. The Middle-East and Africa Market size and forecast, 2016-2026 (Kilo Tons)
      4. 4.8.4. The Middle-East and Africa Methyl Bromide Market, by Country, 2018 - 2025 (Kilo Tons)
      5. 4.8.5. The Middle-East and Africa Methyl Bromide Market, by Type, 2016-2026
      6. 4.8.6. The Middle-East and Africa Methyl Bromide Market, by Application, 2016-2026
      7. 4.8.7. GCC Countries
      8. 4.8.8. South Africa
      9. 4.8.9. Rest of Middle-East Africa
  5. CHAPTER 5. Methyl Bromide Production, Consumption, Export, Import by Regions
    1. 5.1. Global Methyl Bromide production and revenue, 2015-2025 (USD Million) (Kilo Tons)
    2. 5.2. Global Import and Export Analysis, by Region
  6. CHAPTER 6. Methyl Bromide market – Competitive Landscape
    1. 6.1. Competitor Market Share – Revenue
    2. 6.2. Market Concentration Rate Analysis, Top 3 and Top 5 Players
    3. 6.3. Competitor Market Share – Volume
    4. 6.4. Strategic Development
      1. 6.4.1. Acquisitions and Mergers
      2. 6.4.2. New Products
      3. 6.4.3. Research & Development Activities
  7. CHAPTER 7. Company Profiles
    1. 7.1. Intech
      1. 7.1.1. Company Overview
      2. 7.1.2. Intech Sales, Revenue, Price, and Gross Margin
      3. 7.1.3. Product portfolio
      4. 7.1.4. Recent initiatives
    2. 7.2. Albemarle
      1. 7.2.1. Company Overview
      2. 7.2.2. Albemarle Sales, Revenue, Price, and Gross Margin
      3. 7.2.3. Product portfolio
      4. 7.2.4. Recent initiatives
    3. 7.3. ICL
      1. 7.3.1. Company Overview
      2. 7.3.2. ICL Sales, Revenue, Price, and Gross Margin
      3. 7.3.3. Product portfolio
      4. 7.3.4. Recent initiatives
    4. 7.4. Dalian Special Gases
      1. 7.4.1. Company Overview
      2. 7.4.2. Dalian Special Gases Sales, Revenue, Price, and Gross Margin
      3. 7.4.3. Product portfolio
      4. 7.4.4. Recent initiatives
    5. 7.5. CHEMCHINA
      1. 7.5.1. Company Overview
      2. 7.5.2. CHEMCHINA Sales, Revenue, Price, and Gross Margin
      3. 7.5.3. Product portfolio
      4. 7.5.4. Recent initiatives
    6. 7.6. Great Lakes
      1. 7.6.1. Company Overview
      2. 7.6.2. Great Lakes Sales, Revenue, Price, and Gross Margin
      3. 7.6.3. Product portfolio
      4. 7.6.4. Recent initiatives
    7. 7.7. Sunrise
      1. 7.7.1. Company Overview
      2. 7.7.2. Sunrise Sales, Revenue, Price, and Gross Margin
      3. 7.7.3. Product portfolio
      4. 7.7.4. Recent initiatives
    8. 7.8. Triveni Interchem
      1. 7.8.1. Company Overview
      2. 7.8.2. Triveni Interchem Sales, Revenue, Price, and Gross Margin
      3. 7.8.3. Product portfolio
      4. 7.8.4. Recent initiatives
    9. 7.9. Chemtura
      1. 7.9.1. Company Overview
      2. 7.9.2. Chemtura Sales, Revenue, Price, and Gross Margin
      3. 7.9.3. Product portfolio
      4. 7.9.4. Recent initiatives
    10. 7.10. Trical
      1. 7.10.1. Company Overview
      2. 7.10.2. Trical Sales, Revenue, Price, and Gross Margin
      3. 7.10.3. Product portfolio
      4. 7.10.4. Recent initiatives
    11. 7.11. Others
      1. 7.11.1. Company Overview
      2. 7.11.2. Others Sales, Revenue, Price, and Gross Margin
      3. 7.11.3. Product portfolio
      4. 7.11.4. Recent initiatives
  8. CHAPTER 8. Methyl Bromide — Industry Analysis
    1. 8.1. Introduction and Taxonomy
    2. 8.2. Methyl Bromide Market – Key Trends
      1. 8.2.1. Market Drivers
      2. 8.2.2. Market Restraints
      3. 8.2.3. Market Opportunities
    3. 8.3. Value Chain Analysis
    4. 8.4. Key Mandates and Regulations
    5. 8.5. Technology Roadmap and Timeline
    6. 8.6. Methyl Bromide market – Attractiveness Analysis
      1. 8.6.1. By Type
      2. 8.6.2. By Application
      3. 8.6.3. By Region
  9. CHAPTER 9. Raw Material analysis
    1. 9.1. Methyl Bromide Key Raw Material Analysis
      1. 9.1.1. Key Raw Materials
      2. 9.1.2. Price Trend of Key Raw Materials
    2. 9.2. Key Suppliers of Raw Materials
    3. 9.3. Proportion of Manufacturing Cost Structure
      1. 9.3.1. Raw Materials
      2. 9.3.2. Labor Cost
    4. 9.4. Manufacturing Expenses Analysis of Methyl Bromide
  10. CHAPTER 10. Industrial Chain, Sourcing Strategy and Downstream Buyers
    1. 10.1. Methyl Bromide Industrial Chain Analysis
    2. 10.2. Upstream Raw Materials Sourcing
      1. 10.2.1. Risk Mitigation:
      2. 10.2.2. Supplier Relationships:
      3. 10.2.3. Business Processes:
      4. 10.2.4. Securing the Product:
    3. 10.3. Raw Materials Sources of Methyl Bromide Major Manufacturers in 2016
    4. 10.4. Downstream Buyers
    5. 10.5. Distributors/Traders List
  11. CHAPTER 11. Marketing Strategy Analysis, Distributors
    1. 11.1. Marketing Channel
    2. 11.2. Direct Marketing
    3. 11.3. Indirect Marketing
    4. 11.4. Marketing Channel Development Trend
    5. 11.5. Economic/Political Environmental Change
  12. CHAPTER 12. Report Conclusion
  13. CHAPTER 13. Research Approach & Methodology
    1. 13.1. Report Description
    2. 13.2. Research Scope
    3. 13.3. Research Methodology
      1. 13.3.1. Secondary Research
      2. 13.3.2. Primary Research
      3. 13.3.3. Models

      List of Figures

      FIG. 1 Global Methyl Bromide Market, 2016-2026 (USD Million)
      FIG. 2 Global Methyl Bromide Market Share, by Type, 2018 & 2025 (USD Million)
      FIG. 3 Global Methyl Bromide Market share, by Type, 2018 & 2025 (Kilo Tons)
      FIG. 4 Global  100% Purity Methyl Bromide Market, 2016-2026 (USD Million)
      FIG. 5 Global  100% Purity Methyl Bromide  Market, 2016-2026 (Kilo Tons)
      FIG. 6 Global 98% Purity Methyl Bromide Market, 2016-2026 (USD Million)
      FIG. 7 Global 98% Purity Methyl Bromide  Market, 2016-2026 (Kilo Tons)
      FIG. 8 Global Methyl Bromide Market Share, by Application, 2018 & 2025 (USD Million)
      FIG. 9 Global Methyl Bromide Market share, by Application, 2018 & 2025 (Kilo Tons)
      FIG. 10 Global Fumigant Methyl Bromide Market, 2016-2026 (USD Million)
      FIG. 11 Global Fumigant Methyl Bromide  Market, 2016-2026 (Kilo Tons)
      FIG. 12 Global Pesticide Methyl Bromide Market, 2016-2026 (USD Million)
      FIG. 13 Global Pesticide Methyl Bromide  Market, 2016-2026 (Kilo Tons)
      FIG. 14 Global Others Methyl Bromide Market, 2016-2026 (USD Million)
      FIG. 15 Global Others Methyl Bromide  Market, 2016-2026 (Kilo Tons)
      FIG. 16 Global Methyl Bromide Market Share, by Region, 2018 & 2025
      FIG. 17 Global Methyl Bromide Market Share, by Region, 2018 & 2025
      FIG. 18 North America Methyl Bromide Market, 2016-2026
      FIG. 19 North America Methyl Bromide  Market, 2016-2026 (Kilo Tons)
      FIG. 20 U.S. Methyl Bromide Market, 2016-2026
      FIG. 21 U.S. Methyl Bromide  Market, 2016-2026 (Kilo Tons)
      FIG. 22 Canada Methyl Bromide Market, 2016-2026
      FIG. 23 Canada Methyl Bromide  Market, 2016-2026 (Kilo Tons)
      FIG. 24 Europe Methyl Bromide Market, 2016-2026
      FIG. 25 Europe Methyl Bromide  Market, 2016-2026 (Kilo Tons)
      FIG. 26 Germany Methyl Bromide Market, 2016-2026
      FIG. 27 Germany Methyl Bromide  Market, 2016-2026 (Kilo Tons)
      FIG. 28 France Methyl Bromide Market, 2016-2026
      FIG. 29 France Methyl Bromide  Market, 2016-2026 (Kilo Tons)
      FIG. 30 U.K. Methyl Bromide Market, 2016-2026
      FIG. 31 U.K. Methyl Bromide  Market, 2016-2026 (Kilo Tons)
      FIG. 32 Italy Methyl Bromide Market, 2016-2026
      FIG. 33 Italy Methyl Bromide  Market, 2016-2026 (Kilo Tons)
      FIG. 34 Spain Methyl Bromide Market, 2016-2026
      FIG. 35 Spain Methyl Bromide  Market, 2016-2026 (Kilo Tons)
      FIG. 36 Rest of Europe Methyl Bromide Market, 2016-2026
      FIG. 37 Rest of Europe Methyl Bromide  Market, 2016-2026 (Kilo Tons)
      FIG. 38 Asia Pacific Methyl Bromide Market, 2016-2026
      FIG. 39 Asia Pacific Methyl Bromide  Market, 2016-2026 (Kilo Tons)
      FIG. 40 China Methyl Bromide Market, 2016-2026
      FIG. 41 China Methyl Bromide  Market, 2016-2026 (Kilo Tons)
      FIG. 42 Japan Methyl Bromide Market, 2016-2026
      FIG. 43 Japan Methyl Bromide  Market, 2016-2026 (Kilo Tons)
      FIG. 44 India Methyl Bromide Market, 2016-2026
      FIG. 45 India Methyl Bromide  Market, 2016-2026 (Kilo Tons)
      FIG. 46 South  Korea Methyl Bromide Market, 2016-2026
      FIG. 47 South  Korea Methyl Bromide  Market, 2016-2026 (Kilo Tons)
      FIG. 48 South-East Asia Methyl Bromide Market, 2016-2026
      FIG. 49 South-East Asia Methyl Bromide  Market, 2016-2026 (Kilo Tons)
      FIG. 50 Rest of Asia Pacific Methyl Bromide Market, 2016-2026
      FIG. 51 Rest of Asia Pacific Methyl Bromide  Market, 2016-2026 (Kilo Tons)
      FIG. 52 Latin America Methyl Bromide Market, 2016-2026
      FIG. 53 Latin America Methyl Bromide  Market, 2016-2026 (Kilo Tons)
      FIG. 54 Brazil Methyl Bromide Market, 2016-2026
      FIG. 55 Brazil Methyl Bromide  Market, 2016-2026 (Kilo Tons)
      FIG. 56 Mexico Methyl Bromide Market, 2016-2026
      FIG. 57 Mexico Methyl Bromide  Market, 2016-2026 (Kilo Tons)
      FIG. 58 Rest of Latin America Methyl Bromide Market, 2016-2026
      FIG. 59 Rest of Latin America Methyl Bromide  Market, 2016-2026 (Kilo Tons)
      FIG. 60 The Middle-East and Africa Methyl Bromide Market, 2016-2026
      FIG. 61 The Middle-East and Africa Methyl Bromide  Market, 2016-2026 (Kilo Tons)
      FIG. 62 GCC Countries Methyl Bromide Market, 2016-2026
      FIG. 63 GCC Countries Methyl Bromide  Market, 2016-2026 (Kilo Tons)
      FIG. 64 South Africa Methyl Bromide Market, 2016-2026
      FIG. 65 South Africa Methyl Bromide  Market, 2016-2026 (Kilo Tons)
      FIG. 66 Rest of Middle-East Africa Methyl Bromide Market, 2016-2026
      FIG. 67 Rest of Middle-East Africa Methyl Bromide  Market, 2016-2026 (Kilo Tons)
      FIG. 68 Global Methyl Bromide production and revenue, 2015-2025 (USD Million) (Kilo Tons)
      FIG. 69 North America Methyl Bromide production and revenue, 2015-2025 (USD Million) (Kilo Tons)
      FIG. 70 Europe Methyl Bromide production and revenue, 2015-2025 (USD Million) (Kilo Tons)
      FIG. 71 Asia Pacific Methyl Bromide production and revenue, 2015-2025 (USD Million) (Kilo Tons)
      FIG. 72 Latin America Methyl Bromide production and revenue, 2015-2025 (USD Million) (Kilo Tons)
      FIG. 73 Middle East and Africa Methyl Bromide production and revenue, 2015-2025 (USD Million) (Kilo Tons)
      FIG. 74 Competitor Market Share – Revenue
      FIG. 75 Competitor Market Share – Volume
      FIG. 76 Intech Revenue and Growth Rate
      FIG. 77 Intech Market Share
      FIG. 78 Albemarle Revenue and Growth Rate
      FIG. 79 Albemarle Market Share
      FIG. 80 ICL Revenue and Growth Rate
      FIG. 81 ICL Market Share
      FIG. 82 Dalian Special Gases Revenue and Growth Rate
      FIG. 83 Dalian Special Gases Market Share
      FIG. 84 CHEMCHINA Revenue and Growth Rate
      FIG. 85 CHEMCHINA Market Share
      FIG. 86 Great Lakes Revenue and Growth Rate
      FIG. 87 Great Lakes Market Share
      FIG. 88 Sunrise Revenue and Growth Rate
      FIG. 89 Sunrise Market Share
      FIG. 90 Triveni Interchem Revenue and Growth Rate
      FIG. 91 Triveni Interchem Market Share
      FIG. 92 Chemtura Revenue and Growth Rate
      FIG. 93 Chemtura Market Share
      FIG. 94 Trical Revenue and Growth Rate
      FIG. 95 Trical Market Share
      FIG. 96 Others Revenue and Growth Rate
      FIG. 97 Others Market Share
      FIG. 98 Market Dynamics
      FIG. 99 Global Methyl Bromide – Value Chain Analysis
      FIG. 100 Key Mandates and Regulations
      FIG. 101 Technology Roadmap and Timeline
      FIG. 102 Market Attractiveness Analysis – By Type
      FIG. 103 Market Attractiveness Analysis – By Application
      FIG. 104 Market Attractiveness Analysis – By Region
      FIG. 105 Manufacturing Cost Structure of Methyl Bromide
      FIG. 106 Methyl Bromide Industrial Chain Analysis
      FIG. 107 Market Channel
      FIG. 108 Marketing Channel Development Trend
      FIG. 109 Growth in World Gross Product, 2008-2018

      List of Tables

      TABLE 1 Global Methyl Bromide market, 2018 & 2025 (USD Million)
      TABLE 2 Global Methyl Bromide market, by Type, 2016-2026 (USD Million)
      TABLE 3 Global Methyl Bromide market, by Type, 2016-2026 (Kilo Tons)
      TABLE 4 Global Methyl Bromide market, by Application, 2016-2026 (USD Million)
      TABLE 5 Global Methyl Bromide market, by Application, 2016-2026 (Kilo Tons)
      TABLE 6 Global Methyl Bromide market, by region, 2016-2026 (USD Million)
      TABLE 7 Global Methyl Bromide market, by region, 2016-2026 (Kilo Tons)
      TABLE 8 North America Methyl Bromide Market, by Type, 2016-2026 (USD Million)
      TABLE 9 North America Methyl Bromide Market, by Type, 2016-2026 (Kilo Tons)
      TABLE 10 North America Methyl Bromide Market, by Application, 2016-2026 (USD Million)
      TABLE 11 North America Methyl Bromide Market, by Application, 2016-2026 (Kilo Tons)
      TABLE 12 Europe Methyl Bromide Market, by Type, 2016-2026 (USD Million)
      TABLE 13 Europe Methyl Bromide Market, by Type, 2016-2026 (Kilo Tons)
      TABLE 14 Europe Methyl Bromide Market, by Application, 2016-2026 (USD Million)
      TABLE 15 Europe Methyl Bromide Market, by Application, 2016-2026 (Kilo Tons)
      TABLE 16 Asia Pacific Methyl Bromide Market, by Type, 2016-2026 (USD Million)
      TABLE 17 Asia Pacific Methyl Bromide Market, by Type, 2016-2026 (Kilo Tons)
      TABLE 18 Asia Pacific Methyl Bromide Market, by Application, 2016-2026 (USD Million)
      TABLE 19 Asia Pacific Methyl Bromide Market, by Application, 2016-2026 (Kilo Tons)
      TABLE 20 Latin America Methyl Bromide Market, by Type, 2016-2026 (USD Million)
      TABLE 21 Latin America Methyl Bromide Market, by Type, 2016-2026 (Kilo Tons)
      TABLE 22 Latin America Methyl Bromide Market, by Application, 2016-2026 (USD Million)
      TABLE 23 Latin America Methyl Bromide Market, by Application, 2016-2026 (Kilo Tons)
      TABLE 24 The Middle-East and Africa Methyl Bromide Market, by Type, 2016-2026 (USD Million)
      TABLE 25 The Middle-East and Africa Methyl Bromide Market, by Type, 2016-2026 (Kilo Tons)
      TABLE 26 The Middle-East and Africa Methyl Bromide Market, by Application, 2016-2026 (USD Million)
      TABLE 27 The Middle-East and Africa Methyl Bromide Market, by Application, 2016-2026 (Kilo Tons)
      TABLE 28 North America Methyl Bromide Production, Consumption, Export, Import, 2016-2019
      TABLE 29 Europe Methyl Bromide Production, Consumption, Export, Import, 2016-2019
      TABLE 30 Asia Pacific Methyl Bromide Production, Consumption, Export, Import, 2016-2019
      TABLE 31 Latin America Methyl Bromide Production, Consumption, Export, Import, 2016-2019
      TABLE 32 Middle East & Africa Methyl Bromide Production, Consumption, Export, Import, 2016-2019
      TABLE 33 Global Methyl Bromide Market - Company Revenue Analysis 2016-2019 (USD Million)
      TABLE 34 Global Methyl Bromide Market - Company Revenue Share Analysis 2016-2019(%)
      TABLE 35 Global Methyl Bromide Market - Company Volume Analysis 2016-2019 (Kilo Tons)
      TABLE 36 Global Methyl Bromide Market - Company Volume Share Analysis 2016-2019(%)
      TABLE 37 Acquisitions and Mergers
      TABLE 38 New Product/Service Launch
      TABLE 39 Research & Development Activities
      TABLE 40 Market Drivers
      TABLE 41 Market Restraints
      TABLE 42 Market Opportunities
      TABLE 43 Production Base and Market Concentration Rate of Raw Material
      TABLE 44 Key Suppliers of Raw Materials
      TABLE 45 Raw Materials Sources of Methyl Bromide Major Manufacturers in 2016
      TABLE 46 Major Buyers of Methyl Bromide
      TABLE 47 Distributors/Traders of Methyl Bromide by Region

Industry Major Market Players

  • Intech
  •  Albemarle
  •  ICL
  •  Dalian Special Gases
  •  CHEMCHINA
  •  Great Lakes
  •  Sunrise