Search Market Research Report

Discover Our Latest Reports
Discover Our Featured Reports
Discover Top Selling Reports

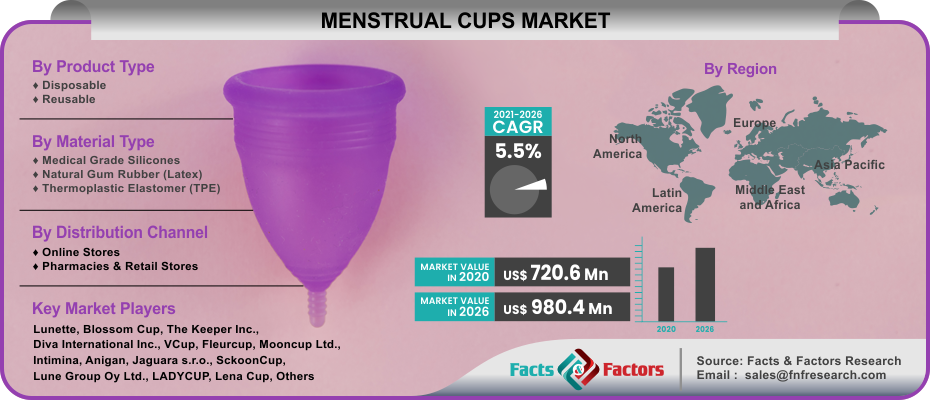
Menstrual Cups Market Size, Share Global Analysis Report, , 2021 – 2026

report img

Menstrual Cups Market By Product Type (Disposable and Reusable), By Material Type (Medical Grade Silicones, Natural Gum Rubber (Latex), and Thermoplastic Elastomer (TPE)), and By Distribution Channel (Online Stores and Pharmacies & Retail Stores): Global Industry Perspective, Comprehensive Analysis, and Forecast, 2021 – 2026

Industry Insights

According to the report published by the Facts & Factors, global demand for the menstrual cups market was estimated at approximately USD 720.6 Million in 2020 and is expected to generate revenue of around USD 980.4 Million by the end of 2026, growing at a CAGR of around 5.5% between 2021 and 2026.

logoReport Overview

A menstrual cup is a female hygiene product that prevents the menstrual fluid from leaking into clothes. It is inserted into the vagina during the menstruation period. The cups are usually made up of flexible silicone that is of superior medical grade material and approved scientifically for use in the body. It does not have harmful chemicals, additives, or absorbency gels in it.

The cups are bell-shaped and have a stem at their top. Also, it helps in easy travel during the menstruation cycle and does not interfere in the normal working as well as cleaning process in your body. In addition, it is easy to use, safe, cost-effective, hygienic, and fully compatible with one’s routine. Besides, the menstrual cups are endorsed as more eco-friendly and reasonable than pads and tampons and are a good option for upgrading from pads and tampons. 

logoIndustry Growth Factors

The global menstrual cup market is anticipated to grow at a significant growth rate during the forecast period. The increase in the adoption of menstrual cups and the growing awareness for superior feminine hygiene products among women are major factors driving the global menstrual cup market.

Additionally, the menstrual cups help in preventing the menstrual odor, are more hygienic in comparison to the pads and tampons and can hold more blood than pads or tampons. Also, these cups are made up of medical-grade researched material, making them safe to be placed in the body. These all aspects are expected to propel the global menstrual cup market expansion in the forthcoming years.

Moreover, the rise in the number of awareness campaigns carried out by women communities, educational institutes, manufacturers is another factor responsible for the market growth. The menstrual cups are obtainable at different prices that are ranging from low to high and offer absolute protection from leaking. Besides, the awareness regarding safety and sanitary protections, the ease of use of menstrual cups in emerging nations will likely create lucrative opportunities for the menstrual cups market.

However, some restraining factors such as the conservative societies in some countries have a low level of acceptance of menstrual cups, and sometimes menstrual cups that are made of latex can cause allergic reactions, these might hamper the market expansion.

Menstrual Cups Market

To know more about this report | Request Free Sample Copy

logoSegmentation Analysis

The global menstrual cups market is classified into product type, material type, and distribution channel.

On the basis of the type of product, the global menstrual cups market is divided into disposable and reusable. Based on the type of material, the global menstrual cups market is divided into natural gum rubber (latex), medical grade silicones, and thermoplastic elastomer (TPE). In terms of the distribution channel, the global menstrual cups market is bifurcated into online stores and pharmacies & retail stores.

logoReport Scope

Report Attribute

Details

Market Size in 2020

USD 720.6 Million

Projected Market Size in 2026

USD 980.4 Million

CAGR Growth Rate

5.5% CAGR

Base Year

2020

Forecast Years

2021-2026

Key Market Players

Blossom Cup, Fleurcup, Diva International Inc., Intimina, SckoonCup, Lune Group Oy Ltd., Jaguara s.r.o., Lunette, VCup, Lena Cup, Saalt LLC, Mooncup Ltd., Me Luna GmbH, Sterne (Si-Line), Anigan, Yuuki Company s.r.o., The Flex Company, FEMCAP, Irisana S.A, LADYCUP, Ruby Life Ltd., The Keeper Inc., and FemyCycle

Key Segment

By Product Type, By Material Type, By Distribution Channel, and By Region

Major Regions Covered

North America, Europe, Asia Pacific, Latin America, and the Middle East & Africa

Purchase Options

Request customized purchase options to meet your research needs. Explore purchase options

logoRegional Analysis

Geographically, the menstrual cups market is classified into North America, Europe, Asia-Pacific, and Latin America, and the Middle East & Africa. In terms of region, North America is contributing to the major market in the global menstrual cup market and is expected to remain dominant in the forthcoming years.

The high growth in this regional market can be attributed to the increasing number of women population along with the growth in the requirement of environment-friendly feminine hygiene products in the region. Moreover, more than 50 percent of the women population base in the United States is in the 12-50 age groups, among which 70 percent uses tampons.

Furthermore, the increase in the awareness associated with the advantages of using menstrual cups, and the availability of high disposable income between the women population is also propelling the regional market growth. Additionally, Latin America and the Middle East & Africa is projected to be the fastest-growing region in the global menstrual cup market owing to the rising campaigns, which are launched to encourage awareness about the benefits of using menstrual cups as well as the growing number of working women populations in the region.

logoCompetitive Players

  • Blossom Cup
  • Fleurcup
  • Diva International Inc.
  • Intimina
  • SckoonCup
  • Lune Group Oy Ltd.
  • Jaguara s.r.o.
  • Lunette
  • VCup
  • Lena Cup
  • Saalt LLC
  • Mooncup Ltd.
  • Me Luna GmbH
  • Sterne (Si-Line)
  • Anigan
  • Yuuki Company s.r.o.
  • The Flex Company
  • FEMCAP
  • Irisana S.A
  • LADYCUP
  • Ruby Life Ltd.
  • The Keeper Inc.
  • FemyCycle 

Moreover, the key companies are providing accessories such as soap strips, hand sanitizer pens, coin tissues, and also menstrual cups are offered in numerous colors to draw customer attention.

logoBy Product Type Segment Analysis

  • Disposable
  • Reusable

logoBy Material Type Segment Analysis

  • Medical Grade Silicones
  • Natural Gum Rubber (Latex)
  • Thermoplastic Elastomer (TPE)

logoBy Distribution Channel Segment Analysis

  • Online Stores
  • Pharmacies & Retail Stores

logoRegional Segment Analysis

  • North America
    • U.S.
    • Canada
  • Europe
    • U.K.
    • France
    • Germany
    • Rest of Europe
  • Asia Pacific
    • China
    • Japan
    • India
    • South Korea
    • Rest of Asia Pacific
  • Latin America
    • Brazil
    • Rest of Latin America
  • The Middle East and Africa
    • GCC Countries
    • South Africa
    • Rest of Middle East Africa

Table of Content

  1. Chapter 1 Executive Summary
    1. 1.1. Introduction of Menstrual Cups
    2. 1.2. Global Menstrual Cups Market, 2020 & 2026 (USD Million)
    3. 1.3. Global Menstrual Cups Market, 2016 – 2026(USD Million)
    4. 1.4. Global Menstrual Cups MarketAbsolute Revenue Opportunity, 2016 – 2026(USD Million)
    5. 1.5. Global Menstrual Cups MarketIncremental Revenue Opportunity, 2020 – 2026(USD Million)
  2. Chapter 2 Menstrual Cups Market – Product Type Analysis
    1. 2.1. Global Menstrual Cups Market – Product Type Overview
    2. 2.2. Global Menstrual Cups Market Share, by Product Type, 2020 & 2026(USD Million)
    3. 2.3. Disposable
      1. 2.3.1. Global Disposable Menstrual Cups Market, 2016 – 2026(USD Million)
    4. 2.4. Reusable
      1. 2.4.1. Global Reusable Menstrual Cups Market, 2016 – 2026(USD Million)
  3. Chapter 3 Menstrual Cups Market – Material Type Analysis
    1. 3.1. Global Menstrual Cups Market – Material Type Overview
    2. 3.2. Global Menstrual Cups Market Share, by Material Type, 2020 & 2026(USD Million)
    3. 3.3. Medical Grade Silicones
      1. 3.3.1. Global Medical Grade Silicones Menstrual Cups Market, 2016 – 2026(USD Million)
    4. 3.4. Natural Gum Rubber (Latex)
      1. 3.4.1. Global Natural Gum Rubber (Latex) Menstrual Cups Market, 2016 – 2026(USD Million)
    5. 3.5. Thermoplastic Elastomer (TPE)
      1. 3.5.1. Global Thermoplastic Elastomer (TPE) Menstrual Cups Market, 2016 – 2026(USD Million)
  4. Chapter 4 Menstrual Cups Market – Distribution Channel Analysis
    1. 4.1. Global Menstrual Cups Market – Distribution Channel Overview
    2. 4.2. Global Menstrual Cups Market Share, by Distribution Channel, 2020 & 2026(USD Million)
    3. 4.3. Online Stores
      1. 4.3.1. Global Online Stores Menstrual Cups Market, 2016 – 2026(USD Million)
    4. 4.4. Pharmacies & Retail Stores
      1. 4.4.1. Global Pharmacies & Retail Stores Menstrual Cups Market, 2016 – 2026(USD Million)
  5. Chapter 5 Menstrual Cups Market – Regional Analysis
    1. 5.1. Global Menstrual Cups Market Regional Overview
    2. 5.2. Global Menstrual Cups Market Share, by Region, 2020 & 2026(USD Million)
    3. 5.3. North America
      1. 5.3.1. North America Menstrual Cups Market, 2016 – 2026(USD Million)
        1. 5.3.1.1. North America Menstrual Cups Market, by Country, 2016 - 2026(USD Million)
      2. 5.3.2. North America Menstrual Cups Market, by Product Type, 2016 – 2026
        1. 5.3.2.1. North America Menstrual Cups Market, by Product Type, 2016 – 2026(USD Million)
      3. 5.3.3. North America Menstrual Cups Market, by Material Type, 2016 – 2026
        1. 5.3.3.1. North America Menstrual Cups Market, by Material Type, 2016 – 2026(USD Million)
      4. 5.3.4. North America Menstrual Cups Market, by Distribution Channel, 2016 – 2026
        1. 5.3.4.1. North America Menstrual Cups Market, by Distribution Channel, 2016 – 2026(USD Million)
      5. 5.3.5. U.S.
        1. 5.3.5.1. U.S. Menstrual Cups Market, 2016 – 2026(USD Million)
      6. 5.3.6. Canada
        1. 5.3.6.1. Canada Menstrual Cups Market, 2016 – 2026(USD Million)
    4. 5.4. Europe
      1. 5.4.1. Europe Menstrual Cups Market, 2016 – 2026(USD Million)
        1. 5.4.1.1. Europe Menstrual Cups Market, by Country, 2016 - 2026(USD Million)
      2. 5.4.2. Europe Menstrual Cups Market, by Product Type, 2016 – 2026
        1. 5.4.2.1. Europe Menstrual Cups Market, by Product Type, 2016 – 2026(USD Million)
      3. 5.4.3. Europe Menstrual Cups Market, by Material Type, 2016 – 2026
        1. 5.4.3.1. Europe Menstrual Cups Market, by Material Type, 2016 – 2026(USD Million)
      4. 5.4.4. Europe Menstrual Cups Market, by Distribution Channel, 2016 – 2026
        1. 5.4.4.1. Europe Menstrual Cups Market, by Distribution Channel, 2016 – 2026(USD Million)
      5. 5.4.5. Germany
        1. 5.4.5.1. Germany Menstrual Cups Market, 2016 – 2026(USD Million)
      6. 5.4.6. France
        1. 5.4.6.1. France Menstrual Cups Market, 2016 – 2026(USD Million)
      7. 5.4.7. U.K.
        1. 5.4.7.1. U.K. Menstrual Cups Market, 2016 – 2026(USD Million)
      8. 5.4.8. Italy
        1. 5.4.8.1. Italy Menstrual Cups Market, 2016 – 2026(USD Million)
      9. 5.4.9. Spain
        1. 5.4.9.1. Spain Menstrual Cups Market, 2016 – 2026(USD Million)
      10. 5.4.10. Rest of Europe
        1. 5.4.10.1. Rest of Europe Menstrual Cups Market, 2016 – 2026(USD Million)
    5. 5.5. Asia Pacific
      1. 5.5.1. Asia Pacific Menstrual Cups Market, 2016 – 2026(USD Million)
        1. 5.5.1.1. Asia Pacific Menstrual Cups Market, by Country, 2016 - 2026(USD Million)
      2. 5.5.2. Asia Pacific Menstrual Cups Market, by Product Type, 2016 – 2026
        1. 5.5.2.1. Asia Pacific Menstrual Cups Market, by Product Type, 2016 – 2026(USD Million)
      3. 5.5.3. Asia Pacific Menstrual Cups Market, by Material Type, 2016 – 2026
        1. 5.5.3.1. Asia Pacific Menstrual Cups Market, by Material Type, 2016 – 2026(USD Million)
      4. 5.5.4. Asia Pacific Menstrual Cups Market, by Distribution Channel, 2016 – 2026
        1. 5.5.4.1. Asia Pacific Menstrual Cups Market, by Distribution Channel, 2016 – 2026(USD Million)
      5. 5.5.5. China
        1. 5.5.5.1. China Menstrual Cups Market, 2016 – 2026(USD Million)
      6. 5.5.6. Japan
        1. 5.5.6.1. Japan Menstrual Cups Market, 2016 – 2026(USD Million)
      7. 5.5.7. India
        1. 5.5.7.1. India Menstrual Cups Market, 2016 – 2026(USD Million)
      8. 5.5.8. South Korea
        1. 5.5.8.1. South Korea Menstrual Cups Market, 2016 – 2026(USD Million)
      9. 5.5.9. South-East Asia
        1. 5.5.9.1. South-East Asia Menstrual Cups Market, 2016 – 2026(USD Million)
      10. 5.5.10. Rest of Asia Pacific
        1. 5.5.10.1. Rest of Asia Pacific Menstrual Cups Market, 2016 – 2026(USD Million)
    6. 5.6. Latin America
      1. 5.6.1. Latin America Menstrual Cups Market, 2016 – 2026(USD Million)
        1. 5.6.1.1. Latin America Menstrual Cups Market, by Country, 2016 - 2026(USD Million)
      2. 5.6.2. Latin America Menstrual Cups Market, by Product Type, 2016 – 2026
        1. 5.6.2.1. Latin America Menstrual Cups Market, by Product Type, 2016 – 2026(USD Million)
      3. 5.6.3. Latin America Menstrual Cups Market, by Material Type, 2016 – 2026
        1. 5.6.3.1. Latin America Menstrual Cups Market, by Material Type, 2016 – 2026(USD Million)
      4. 5.6.4. Latin America Menstrual Cups Market, by Distribution Channel, 2016 – 2026
        1. 5.6.4.1. Latin America Menstrual Cups Market, by Distribution Channel, 2016 – 2026(USD Million)
      5. 5.6.5. Brazil
        1. 5.6.5.1. Brazil Menstrual Cups Market, 2016 – 2026(USD Million)
      6. 5.6.6. Mexico
        1. 5.6.6.1. Mexico Menstrual Cups Market, 2016 – 2026(USD Million)
      7. 5.6.7. Rest of Latin America
        1. 5.6.7.1. Rest of Latin America Menstrual Cups Market, 2016 – 2026(USD Million)
    7. 5.7. The Middle-East and Africa
      1. 5.7.1. The Middle-East and Africa Menstrual Cups Market, 2016 – 2026(USD Million)
        1. 5.7.1.1. The Middle-East and Africa Menstrual Cups Market, by Country, 2016 - 2026(USD Million)
      2. 5.7.2. The Middle-East and Africa Menstrual Cups Market, by Product Type, 2016 – 2026
        1. 5.7.2.1. The Middle-East and Africa Menstrual Cups Market, by Product Type, 2016 – 2026(USD Million)
      3. 5.7.3. The Middle-East and Africa Menstrual Cups Market, by Material Type, 2016 – 2026
        1. 5.7.3.1. The Middle-East and Africa Menstrual Cups Market, by Material Type, 2016 – 2026(USD Million)
      4. 5.7.4. The Middle-East and Africa Menstrual Cups Market, by Distribution Channel, 2016 – 2026
        1. 5.7.4.1. The Middle-East and Africa Menstrual Cups Market, by Distribution Channel, 2016 – 2026(USD Million)
      5. 5.7.5. GCC Countries
        1. 5.7.5.1. GCC Countries Menstrual Cups Market, 2016 – 2026(USD Million)
      6. 5.7.6. South Africa
        1. 5.7.6.1. South Africa Menstrual Cups Market, 2016 – 2026(USD Million)
      7. 5.7.7. Rest of Middle-East Africa
        1. 5.7.7.1. Rest of Middle-East Africa Menstrual Cups Market, 2016 – 2026(USD Million)
  6. Chapter 6 Menstrual Cups Market – Competitive Landscape
    1. 6.1. Competitor Market Share – Revenue
    2. 6.2. Market Concentration Rate Analysis, Top 3 and Top 5 Players
    3. 6.3. Strategic Developments
      1. 6.3.1. Acquisitions and Mergers
      2. 6.3.2. New Products
      3. 6.3.3. Research & Development Activities
  7. Chapter 7 Company Profiles
    1. 7.1. Blossom Cup
      1. 7.1.1. Company Overview
      2. 7.1.2. Product/ServicePortfolio
      3. 7.1.3. Blossom Cup Sales, Revenue, and Gross Margin
      4. 7.1.4. Blossom Cup Revenue and Growth Rate
      5. 7.1.5. Blossom Cup Market Share
      6. 7.1.6. Recent Initiatives, Funding/VC Activities, and Technological Innovations
    2. 7.2. Fleurcup
      1. 7.2.1. Company Overview
      2. 7.2.2. Product/ServicePortfolio
      3. 7.2.3. Fleurcup Sales, Revenue, and Gross Margin
      4. 7.2.4. Fleurcup Revenue and Growth Rate
      5. 7.2.5. Fleurcup Market Share
      6. 7.2.6. Recent Initiatives, Funding/VC Activities, and Technological Innovations
    3. 7.3. Diva International Inc.
      1. 7.3.1. Company Overview
      2. 7.3.2. Product/ServicePortfolio
      3. 7.3.3. Diva International Inc. Sales, Revenue, and Gross Margin
      4. 7.3.4. Diva International Inc. Revenue and Growth Rate
      5. 7.3.5. Diva International Inc. Market Share
      6. 7.3.6. Recent Initiatives, Funding/VC Activities, and Technological Innovations
    4. 7.4. Intimina
      1. 7.4.1. Company Overview
      2. 7.4.2. Product/ServicePortfolio
      3. 7.4.3. Intimina Sales, Revenue, and Gross Margin
      4. 7.4.4. Intimina Revenue and Growth Rate
      5. 7.4.5. Intimina Market Share
      6. 7.4.6. Recent Initiatives, Funding/VC Activities, and Technological Innovations
    5. 7.5. SckoonCup
      1. 7.5.1. Company Overview
      2. 7.5.2. Product/ServicePortfolio
      3. 7.5.3. SckoonCup Sales, Revenue, and Gross Margin
      4. 7.5.4. SckoonCup Revenue and Growth Rate
      5. 7.5.5. SckoonCup Market Share
      6. 7.5.6. Recent Initiatives, Funding/VC Activities, and Technological Innovations
    6. 7.6. Lune Group Oy Ltd.
      1. 7.6.1. Company Overview
      2. 7.6.2. Product/ServicePortfolio
      3. 7.6.3. Lune Group Oy Ltd. Sales, Revenue, and Gross Margin
      4. 7.6.4. Lune Group Oy Ltd. Revenue and Growth Rate
      5. 7.6.5. Lune Group Oy Ltd. Market Share
      6. 7.6.6. Recent Initiatives, Funding/VC Activities, and Technological Innovations
    7. 7.7. Jaguara s.r.o.
      1. 7.7.1. Company Overview
      2. 7.7.2. Product/ServicePortfolio
      3. 7.7.3. Jaguara s.r.o. Sales, Revenue, and Gross Margin
      4. 7.7.4. Jaguara s.r.o. Revenue and Growth Rate
      5. 7.7.5. Jaguara s.r.o. Market Share
      6. 7.7.6. Recent Initiatives, Funding/VC Activities, and Technological Innovations
    8. 7.8. Lunette
      1. 7.8.1. Company Overview
      2. 7.8.2. Product/ServicePortfolio
      3. 7.8.3. Lunette Sales, Revenue, and Gross Margin
      4. 7.8.4. Lunette Revenue and Growth Rate
      5. 7.8.5. Lunette Market Share
      6. 7.8.6. Recent Initiatives, Funding/VC Activities, and Technological Innovations
    9. 7.9. VCup
      1. 7.9.1. Company Overview
      2. 7.9.2. Product/ServicePortfolio
      3. 7.9.3. VCup Sales, Revenue, and Gross Margin
      4. 7.9.4. VCup Revenue and Growth Rate
      5. 7.9.5. VCup Market Share
      6. 7.9.6. Recent Initiatives, Funding/VC Activities, and Technological Innovations
    10. 7.10. Lena Cup
      1. 7.10.1. Company Overview
      2. 7.10.2. Product/ServicePortfolio
      3. 7.10.3. Lena Cup Sales, Revenue, and Gross Margin
      4. 7.10.4. Lena Cup Revenue and Growth Rate
      5. 7.10.5. Lena Cup Market Share
      6. 7.10.6. Recent Initiatives, Funding/VC Activities, and Technological Innovations
    11. 7.11. Saalt LLC
      1. 7.11.1. Company Overview
      2. 7.11.2. Product/ServicePortfolio
      3. 7.11.3. Saalt LLC Sales, Revenue, and Gross Margin
      4. 7.11.4. Saalt LLC Revenue and Growth Rate
      5. 7.11.5. Saalt LLC Market Share
      6. 7.11.6. Recent Initiatives, Funding/VC Activities, and Technological Innovations
    12. 7.12. Mooncup Ltd.
      1. 7.12.1. Company Overview
      2. 7.12.2. Product/ServicePortfolio
      3. 7.12.3. Mooncup Ltd. Sales, Revenue, and Gross Margin
      4. 7.12.4. Mooncup Ltd. Revenue and Growth Rate
      5. 7.12.5. Mooncup Ltd. Market Share
      6. 7.12.6. Recent Initiatives, Funding/VC Activities, and Technological Innovations
    13. 7.13. Me Luna GmbH
      1. 7.13.1. Company Overview
      2. 7.13.2. Product/ServicePortfolio
      3. 7.13.3. Me Luna GmbH Sales, Revenue, and Gross Margin
      4. 7.13.4. Me Luna GmbH Revenue and Growth Rate
      5. 7.13.5. Me Luna GmbH Market Share
      6. 7.13.6. Recent Initiatives, Funding/VC Activities, and Technological Innovations
    14. 7.14. Sterne (Si-Line)
      1. 7.14.1. Company Overview
      2. 7.14.2. Product/ServicePortfolio
      3. 7.14.3. Sterne (Si-Line) Sales, Revenue, and Gross Margin
      4. 7.14.4. Sterne (Si-Line) Revenue and Growth Rate
      5. 7.14.5. Sterne (Si-Line) Market Share
      6. 7.14.6. Recent Initiatives, Funding/VC Activities, and Technological Innovations
    15. 7.15. Anigan
      1. 7.15.1. Company Overview
      2. 7.15.2. Product/ServicePortfolio
      3. 7.15.3. Anigan Sales, Revenue, and Gross Margin
      4. 7.15.4. Anigan Revenue and Growth Rate
      5. 7.15.5. Anigan Market Share
      6. 7.15.6. Recent Initiatives, Funding/VC Activities, and Technological Innovations
    16. 7.16. Yuuki Company s.r.o.
      1. 7.16.1. Company Overview
      2. 7.16.2. Product/ServicePortfolio
      3. 7.16.3. Yuuki Company s.r.o. Sales, Revenue, and Gross Margin
      4. 7.16.4. Yuuki Company s.r.o. Revenue and Growth Rate
      5. 7.16.5. Yuuki Company s.r.o. Market Share
      6. 7.16.6. Recent Initiatives, Funding/VC Activities, and Technological Innovations
    17. 7.17. The Flex Company
      1. 7.17.1. Company Overview
      2. 7.17.2. Product/ServicePortfolio
      3. 7.17.3. The Flex Company Sales, Revenue, and Gross Margin
      4. 7.17.4. The Flex Company Revenue and Growth Rate
      5. 7.17.5. The Flex Company Market Share
      6. 7.17.6. Recent Initiatives, Funding/VC Activities, and Technological Innovations
    18. 7.18. FEMCAP
      1. 7.18.1. Company Overview
      2. 7.18.2. Product/ServicePortfolio
      3. 7.18.3. FEMCAP Sales, Revenue, and Gross Margin
      4. 7.18.4. FEMCAP Revenue and Growth Rate
      5. 7.18.5. FEMCAP Market Share
      6. 7.18.6. Recent Initiatives, Funding/VC Activities, and Technological Innovations
    19. 7.19. Irisana S.A
      1. 7.19.1. Company Overview
      2. 7.19.2. Product/ServicePortfolio
      3. 7.19.3. Irisana S.A Sales, Revenue, and Gross Margin
      4. 7.19.4. Irisana S.A Revenue and Growth Rate
      5. 7.19.5. Irisana S.A Market Share
      6. 7.19.6. Recent Initiatives, Funding/VC Activities, and Technological Innovations
    20. 7.20. LADYCUP
      1. 7.20.1. Company Overview
      2. 7.20.2. Product/ServicePortfolio
      3. 7.20.3. LADYCUP Sales, Revenue, and Gross Margin
      4. 7.20.4. LADYCUP Revenue and Growth Rate
      5. 7.20.5. LADYCUP Market Share
      6. 7.20.6. Recent Initiatives, Funding/VC Activities, and Technological Innovations
    21. 7.21. Ruby Life Ltd.
      1. 7.21.1. Company Overview
      2. 7.21.2. Product/ServicePortfolio
      3. 7.21.3. Ruby Life Ltd. Sales, Revenue, and Gross Margin
      4. 7.21.4. Ruby Life Ltd. Revenue and Growth Rate
      5. 7.21.5. Ruby Life Ltd. Market Share
      6. 7.21.6. Recent Initiatives, Funding/VC Activities, and Technological Innovations
    22. 7.22. The Keeper Inc.
      1. 7.22.1. Company Overview
      2. 7.22.2. Product/ServicePortfolio
      3. 7.22.3. The Keeper Inc. Sales, Revenue, and Gross Margin
      4. 7.22.4. The Keeper Inc. Revenue and Growth Rate
      5. 7.22.5. The Keeper Inc. Market Share
      6. 7.22.6. Recent Initiatives, Funding/VC Activities, and Technological Innovations
    23. 7.23. FemyCycle
      1. 7.23.1. Company Overview
      2. 7.23.2. Product/ServicePortfolio
      3. 7.23.3. FemyCycle Sales, Revenue, and Gross Margin
      4. 7.23.4. FemyCycle Revenue and Growth Rate
      5. 7.23.5. FemyCycle Market Share
      6. 7.23.6. Recent Initiatives, Funding/VC Activities, and Technological Innovations
  8. Chapter 8 Menstrual Cups — Industry Analysis
    1. 8.1. Introduction and Taxonomy
    2. 8.2. Menstrual Cups Market – Key Trends
      1. 8.2.1. Market Drivers
      2. 8.2.2. Market Restraints
      3. 8.2.3. Market Opportunities
    3. 8.3. Value Chain Analysis
    4. 8.4. Key Mandates and Regulations
    5. 8.5. Technology Roadmap and Timeline
    6. 8.6. Menstrual Cups Market – Attractiveness Analysis
      1. 8.6.1. By Product Type
      2. 8.6.2. By Material Type
      3. 8.6.3. By Distribution Channel
      4. 8.6.4. By Region
  9. Chapter 9 Industrial Chain, Sourcing Strategy, and Downstream Buyers
    1. 9.1. Menstrual Cups Industrial Chain Analysis
    2. 9.2. Downstream Buyers
    3. 9.3. Distributors/Traders List
  10. Chapter 10 Marketing Strategy Analysis
    1. 10.1. Marketing Channel
    2. 10.2. Direct Marketing
    3. 10.3. Indirect Marketing
    4. 10.4. Marketing Channel Development Trends
    5. 10.5. Economic/Political Environmental Change
  11. Chapter 11 Report Conclusion& Key Insights
    1. 11.1. Key Insights from Primary Interviews & Surveys Respondents
    2. 11.2. Key Takeaways from Analysts, Consultants, and Industry Leaders
  12. Chapter 12 Research Approach & Methodology
    1. 12.1. Report Description
    2. 12.2. Research Scope
    3. 12.3. Research Methodology
      1. 12.3.1. Secondary Research
      2. 12.3.2. Primary Research
      3. 12.3.3. Statistical Models
        1. 12.3.3.1. Company Share Analysis Model
        2. 12.3.3.2. Revenue Based Modeling
      4. 12.3.4. Research Limitations

      List of Figures

      Fig.1	Product Picture of  Menstrual Cups
      Fig.2	Global  Menstrual Cups  Market, 2016 – 2026(USD Million)
      Fig.3	Global  Menstrual Cups  MarketAbsolute Revenue Opportunity, 2016 – 2026(USD Million)
      Fig.4	Global  Menstrual Cups  MarketIncremental Revenue Opportunity, 2020 – 2026(USD Million)
      Fig.5	Global  Menstrual Cups  Market Share, by Product Type, 2020 & 2026(USD Million)
      Fig.6	Global Disposable Menstrual Cups  Market, 2016 – 2026(USD Million)
      Fig.7	Global Reusable Menstrual Cups  Market, 2016 – 2026(USD Million)
      Fig.8	Global  Menstrual Cups  Market Share, by Material Type, 2020 & 2026(USD Million)
      Fig.9	Global Medical Grade Silicones Menstrual Cups  Market, 2016 – 2026(USD Million)
      Fig.10	Global Natural Gum Rubber (Latex) Menstrual Cups  Market, 2016 – 2026(USD Million)
      Fig.11	Global Thermoplastic Elastomer (TPE) Menstrual Cups  Market, 2016 – 2026(USD Million)
      Fig.12	Global  Menstrual Cups  Market Share, by Distribution Channel, 2020 & 2026(USD Million)
      Fig.13	Global Online Stores Menstrual Cups  Market, 2016 – 2026(USD Million)
      Fig.14	Global Pharmacies & Retail Stores Menstrual Cups  Market, 2016 – 2026(USD Million)
      Fig.15	Global  Menstrual Cups  MarketShare, by Region, 2020 & 2026(USD Million)
      Fig.16	North America Menstrual Cups  Market, 2016 – 2026(USD Million)
      Fig.17	U.S. Menstrual Cups  Market, 2016 – 2026(USD Million)
      Fig.18	Canada Menstrual Cups  Market, 2016 – 2026(USD Million)
      Fig.19	Europe Menstrual Cups  Market, 2016 – 2026(USD Million)
      Fig.20	Germany Menstrual Cups  Market, 2016 – 2026(USD Million)
      Fig.21	France Menstrual Cups  Market, 2016 – 2026(USD Million)
      Fig.22	U.K. Menstrual Cups  Market, 2016 – 2026(USD Million)
      Fig.23	Italy Menstrual Cups  Market, 2016 – 2026(USD Million)
      Fig.24	Spain Menstrual Cups  Market, 2016 – 2026(USD Million)
      Fig.25	Rest of Europe Menstrual Cups  Market, 2016 – 2026(USD Million)
      Fig.26	Asia Pacific Menstrual Cups  Market, 2016 – 2026(USD Million)
      Fig.27	China Menstrual Cups  Market, 2016 – 2026(USD Million)
      Fig.28	Japan Menstrual Cups  Market, 2016 – 2026(USD Million)
      Fig.29	India Menstrual Cups  Market, 2016 – 2026(USD Million)
      Fig.30	South  Korea Menstrual Cups  Market, 2016 – 2026(USD Million)
      Fig.31	South-East Asia Menstrual Cups  Market, 2016 – 2026(USD Million)
      Fig.32	Rest of Asia Pacific Menstrual Cups  Market, 2016 – 2026(USD Million)
      Fig.33	Latin America Menstrual Cups  Market, 2016 – 2026(USD Million)
      Fig.34	Brazil Menstrual Cups  Market, 2016 – 2026(USD Million)
      Fig.35	Mexico Menstrual Cups  Market, 2016 – 2026(USD Million)
      Fig.36	Rest of Latin America Menstrual Cups  Market, 2016 – 2026(USD Million)
      Fig.37	The Middle-East and Africa Menstrual Cups  Market, 2016 – 2026(USD Million)
      Fig.38	GCC Countries Menstrual Cups  Market, 2016 – 2026(USD Million)
      Fig.39	South Africa Menstrual Cups  Market, 2016 – 2026(USD Million)
      Fig.40	Rest of Middle-East Africa Menstrual Cups  Market, 2016 – 2026(USD Million)
      Fig.41	Competitor Market Share – Revenue
      Fig.42	Blossom Cup Revenue and Growth Rate
      Fig.43	Blossom Cup Market Share
      Fig.44	Fleurcup Revenue and Growth Rate
      Fig.45	Fleurcup Market Share
      Fig.46	Diva International Inc. Revenue and Growth Rate
      Fig.47	Diva International Inc. Market Share
      Fig.48	Intimina Revenue and Growth Rate
      Fig.49	Intimina Market Share
      Fig.50	SckoonCup Revenue and Growth Rate
      Fig.51	SckoonCup Market Share
      Fig.52	Lune Group Oy Ltd. Revenue and Growth Rate
      Fig.53	Lune Group Oy Ltd. Market Share
      Fig.54	Jaguara s.r.o. Revenue and Growth Rate
      Fig.55	Jaguara s.r.o. Market Share
      Fig.56	Lunette Revenue and Growth Rate
      Fig.57	Lunette Market Share
      Fig.58	VCup Revenue and Growth Rate
      Fig.59	VCup Market Share
      Fig.60	Lena Cup Revenue and Growth Rate
      Fig.61	Lena Cup Market Share
      Fig.62	Saalt LLC Revenue and Growth Rate
      Fig.63	Saalt LLC Market Share
      Fig.64	Mooncup Ltd. Revenue and Growth Rate
      Fig.65	Mooncup Ltd. Market Share
      Fig.66	Me Luna GmbH Revenue and Growth Rate
      Fig.67	Me Luna GmbH Market Share
      Fig.68	Sterne (Si-Line) Revenue and Growth Rate
      Fig.69	Sterne (Si-Line) Market Share
      Fig.70	Anigan Revenue and Growth Rate
      Fig.71	Anigan Market Share
      Fig.72	Yuuki Company s.r.o. Revenue and Growth Rate
      Fig.73	Yuuki Company s.r.o. Market Share
      Fig.74	The Flex Company Revenue and Growth Rate
      Fig.75	The Flex Company Market Share
      Fig.76	FEMCAP Revenue and Growth Rate
      Fig.77	FEMCAP Market Share
      Fig.78	Irisana S.A Revenue and Growth Rate
      Fig.79	Irisana S.A Market Share
      Fig.80	LADYCUP Revenue and Growth Rate
      Fig.81	LADYCUP Market Share
      Fig.82	Ruby Life Ltd. Revenue and Growth Rate
      Fig.83	Ruby Life Ltd. Market Share
      Fig.84	The Keeper Inc. Revenue and Growth Rate
      Fig.85	The Keeper Inc. Market Share
      Fig.86	FemyCycle Revenue and Growth Rate
      Fig.87	FemyCycle Market Share
      Fig.88	Market Dynamics
      Fig.89	Global  Menstrual Cups  – Value Chain Analysis
      Fig.90	Key Mandates and Regulations
      Fig.91	Technology Roadmap and Timeline
      Fig.92	Market Attractiveness Analysis – By Product Type
      Fig.93	Market Attractiveness Analysis – By Material Type
      Fig.94	Market Attractiveness Analysis – By Distribution Channel
      Fig.95	Market Attractiveness Analysis – By Region
      Fig.96	Menstrual Cups  Industrial Chain Analysis
      Fig.97	Market Channels
      Fig.98	Marketing Channel Development Trend
      Fig.99	Growth in World Gross Product, 2008-2018
      

      List of Tables

      Table 1	Global  Menstrual Cups Market, 2020 & 2026(USD Million)
      Table 2	Global  Menstrual Cups Market, by Product Type, 2016 – 2026(USD Million)
      Table 3	Global  Menstrual Cups Market, by Material Type, 2016 – 2026(USD Million)
      Table 4	Global  Menstrual Cups Market, by Distribution Channel, 2016 – 2026(USD Million)
      Table 5	Global  Menstrual Cups Market, by Region, 2016 – 2026(USD Million)
      Table 6	North America Menstrual Cups  Market, by Country, 2016 – 2026(USD Million)
      Table 7	North America Menstrual Cups  Market, by Product Type, 2016 – 2026(USD Million)
      Table 8	North America Menstrual Cups  Market, by Material Type, 2016 – 2026(USD Million)
      Table 9	North America Menstrual Cups  Market, by Distribution Channel, 2016 – 2026(USD Million)
      Table 10 Europe Menstrual Cups  Market, by Country, 2016 – 2026(USD Million)
      Table 11 Europe Menstrual Cups  Market, by Product Type, 2016 – 2026(USD Million)
      Table 12 Europe Menstrual Cups  Market, by Material Type, 2016 – 2026(USD Million)
      Table 13 Europe Menstrual Cups  Market, by Distribution Channel, 2016 – 2026(USD Million)
      Table 14 Asia Pacific Menstrual Cups  Market, by Country, 2016 – 2026(USD Million)
      Table 15 Asia Pacific Menstrual Cups  Market, by Product Type, 2016 – 2026(USD Million)
      Table 16 Asia Pacific Menstrual Cups  Market, by Material Type, 2016 – 2026(USD Million)
      Table 17 Asia Pacific Menstrual Cups  Market, by Distribution Channel, 2016 – 2026(USD Million)
      Table 18 Latin America Menstrual Cups  Market, by Country, 2016 – 2026(USD Million)
      Table 19 Latin America Menstrual Cups  Market, by Product Type, 2016 – 2026(USD Million)
      Table 20 Latin America Menstrual Cups  Market, by Material Type, 2016 – 2026(USD Million)
      Table 21 Latin America Menstrual Cups  Market, by Distribution Channel, 2016 – 2026(USD Million)
      Table 22 The Middle-East and Africa Menstrual Cups  Market, by Country, 2016 – 2026(USD Million)
      Table 23 The Middle-East and Africa Menstrual Cups  Market, by Product Type, 2016 – 2026(USD Million)
      Table 24 The Middle-East and Africa Menstrual Cups  Market, by Material Type, 2016 – 2026(USD Million)
      Table 25 The Middle-East and Africa Menstrual Cups  Market, by Distribution Channel, 2016 – 2026(USD Million)
      Table 26 Global  Menstrual Cups  Market - Company Revenue Analysis, 2016 – 2019(USD Million)
      Table 27 Global  Menstrual Cups  Market - Company Revenue Share Analysis, 2016 – 2019(%)
      Table 28 Acquisitions and Mergers
      Table 29 Market Drivers – Impact Analysis
      Table 30 Market Restraints
      Table 31 Market Opportunities
      Table 32 Major Buyers of  Menstrual Cups
      Table 33 Distributors/Traders of  Menstrual Cups  by Region
      

Industry Major Market Players

  • Blossom Cup
  • Fleurcup
  • Diva International Inc.
  • Intimina
  • SckoonCup
  • Lune Group Oy Ltd.
  • Jaguara s.r.o.
  • Lunette
  • VCup
  • Lena Cup
  • Saalt LLC
  • Mooncup Ltd.
  • Me Luna GmbH
  • Sterne (Si-Line)
  • Anigan
  • Yuuki Company s.r.o.
  • The Flex Company
  • FEMCAP
  • Irisana S.A
  • LADYCUP
  • Ruby Life Ltd.
  • The Keeper Inc.
  • FemyCycle