Search Market Research Report

Discover Our Latest Reports
Discover Our Featured Reports
Discover Top Selling Reports

Magnetic Beads Market Size, Share Global Analysis Report, 2020–2026

report img

Magnetic Beads Market By Product (Dynabeads, Turbo Beads, and Others), By Industry level (Bioresearch, In-Vitro Diagnostics, and Others) and By Sales Channel(Direct Sales and Distributor): Global Industry Outlook, Market Size, Business Intelligence, Consumer Preferences, Statistical Surveys, Comprehensive Analysis, Historical Developments, Current Trends, and Forecast 2020–2026

Industry Insights

Magnetic Beads Market

To know more about this report | Request Free Sample Copy

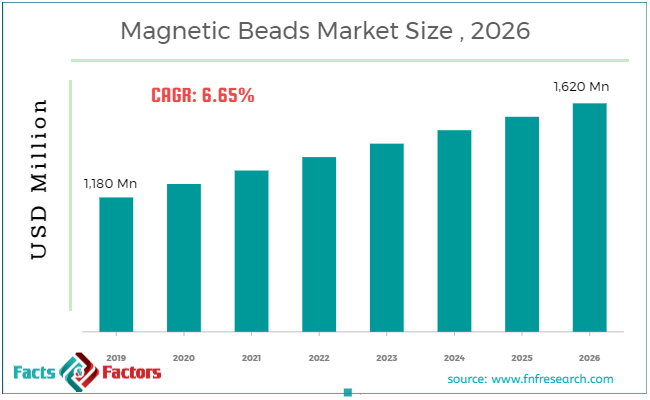
According to the report published by Facts & Factors, the global Magnetic Beads Market size was worth around USD 1180 million in 2019 and is predicted to grow around USD 1,620 million by 2026 with a compound annual growth rate (CAGR) of roughly 6.65% between 2020 and 2026. The report analyzes the global Magnetic Beads Market drivers, restraints/challenges, and the effect they have on the demands during the projection period. In addition, the report explores emerging opportunities in the Magnetic Beads Market.

This specialized and expertise oriented industry research report scrutinizes the technical and commercial business outlook of the Magnetic Beads industry. The report analyzes and declares the historical and current trends analysis of the Magnetic Beads industry and subsequently recommends the projected trends anticipated to be observed in the Magnetic Beads market during the upcoming years.

The Magnetic Beads market report analyzes and notifies the industry statistics at the global as well as regional and country levels in order to acquire a thorough perspective of the entire magnetic Beads market. The historical and past insights are provided for FY 2016 to FY 2019 whereas projected trends are delivered for FY 2020 to FY 2026. The quantitative and numerical data is represented in terms of both volume (Units) and value (USD Million) from FY 2016 – 2026.

logoKey Insights from Primary Research

  • As per our primary respondents, the magnetic Beads market is set to grow annually at a rate of around 6.65%.
  • It was established through primary research that the Magnetic Beads market was valued at around USD 2,492million in 2019.
  • After secondary research, we performed face to face interviews to validate our data. The insights interviewee’s declared that Dynabeadsis the most used product for the global Magnetic Beads market.
  • On the basis of the Industry, Bioresearchdominated the global Magnetic Beads market in 2019. It accounted for around 54% share of the total market in 2019.
  • The dynabeads segment, on the basis of product segmentation, was the leading revenue-generating category accounting for around 47% share, in 2019.

logoKey Recommendations from Analysts

  • Based on the exhaustive secondary research done by our team, the Dynabeadsis anticipated becoming the most demanding product in the upcoming years, owing to the growing demand for Magnetic Beads from the pharmaceutical industry for various end-use applications.
  • As per our analysts, North America recorded the highest market share of more than 30% by 2026, and the market is expected to bolster in this region, resulting in creating lucrative opportunities for new players.
  • Growing at a CAGR around 6.65%, the Magnetic Beads market provides numerous opportunities for all of the involved stakeholders across the entire value chain.
  • Our analysts have identified Dynabeadsand Bioresearchcategories as the leading investment pockets for the Magnetic Beads market in terms of product and industry segmentation respectively.
  • Our analysts recommend the emerging players to focus on DYnabeadsowing to the substantial growth of the pharmaceutical industry.

logo
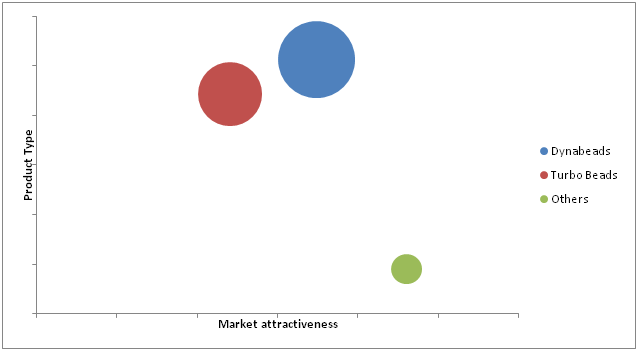
Market Attractiveness – By Product

Magnetic Beads Market

To know more about this report | Request Free Sample Copy

The quantitative data is further underlined and reinforced by comprehensive qualitative data which comprises various across-the-board market dynamics. The rationales which directly or indirectly impact the Magnetic Beads industry are exemplified through parameters such as growth drivers, restraints, challenges, and opportunities among other impacting factors.

Throughout our research report, we have encompassed all the proven models and tools of industry analysis and extensively illustrated all the key business strategies and business models adopted in the Magnetic Beads industry. The report provides an all-inclusive and detailed competitive landscape prevalent in the Magnetic Beads market.

The report utilizes established industry analysis tools and models such as Porter’s Five Forces framework to analyze and recognize critical business strategies adopted by various stakeholders involved in the entire value chain of the Magnetic Beads industry. The Magnetic Beads market report additionally employs SWOT analysis and PESTLE analysis models for further in-depth analysis.

The report study further includes an in-depth analysis of industry players' market shares and provides an overview of leading players' market position in the Magnetic Beads sector. Key strategic developments in the Magnetic Beads market competitive landscape such as acquisitions & mergers, inaugurations of different products and services, partnerships & joint ventures, MoU agreements, VC & funding activities, R&D activities, and geographic expansion among other noteworthy activities by key players of the Magnetic Beads market are appropriately highlighted in the report.

Magnetic Beads are paramagnetic iron oxide particles used for purification, abduction and sample preparation for DNA, proteins, and antibodies. They are used in both physical and automated research applications in various biomedical industry verticals. It has various features such as high selectivity, faster coupling property, and high sensitivity. This market is anticipated to bolster during the forecast period owing to the technological advancement in the biomedical field, huge investment in R&D from pharmaceutical companies. In addition, increasing investment by the government in life science is projected to fuel the market’s growth in the future.

The Magnetic Beads market research report delivers an acute valuation and taxonomy of the Magnetic Beads industry by practically splitting the market on the basis of different types, applications, and regions. Through the analysis of the historical and projected trends, all the segments and sub-segments were evaluated through the bottom-up approach, and different market sizes have been projected for FY 2020 to FY 2026. The regional segmentation of the Magnetic Beads industry includes the complete classification of all the major continents including North America, Latin America, Europe, Asia Pacific, and Middle East & Africa. Further, country-wise data for the Magnetic Beads industry is provided for the leading economies of the world.

The Magnetic Beads market is segmented based on the product, industry level, and sales channel.  On the basis of product segmentation, the market is classified into Dynabeads, Turbo Beads, and others. Based on the industry level, the market is segmented into Bioresearch, In-Vitro Diagnostics, and others. In terms of sales channel segmentation, the market is bifurcated into Direct Sales and Distributor.

logoReport Scope

Report Attribute

Details

Market Size in 2019

USD 1,180 Million

Projected Market Size in 2026

USD 1,620 Million

CAGR Growth Rate

6.65% CAGR

Base Year

2019

Forecast Years

2020-2026

Key Market Players

Thermo Fisher Scientific (Dynal), Merck Millipore, Bang Laboratories, Qiagen, CardioGenics, Takara (Clontech), Spherotech, GenScript, Bio Rad, Geneaid Biotech, NEB, Rockland, and others.

Key Segment

By Product, Industry, and Region

Major Regions Covered

North America, Europe, Asia Pacific, Latin America, and the Middle East &, Africa

Purchase Options

Request customized purchase options to meet your research needs. Explore purchase options

logoCompetitive Analysis

Some of the essential players operating in the Magnetic Beads market, but not restricted to include :

  •  Thermo Fisher Scientific (Dynal)
  •  Merck Millipore
  •  Bang Laboratories
  •  Qiagen
  •  CardioGenics
  •  Takara (Clontech)
  •  Spherotech
  •  GenScript
  •  Bio Rad
  •  Geneaid Biotech
  •  NEB
  •  Rockland

The taxonomy of the magnetic beads market by its scope and segmentation is as follows:

logo By Product Segmentation Analysis

  • Dynabeads
  • Turbo Beads
  • Others 

logo By Industry Segmentation Analysis

  • Bioresearch
  • In-Vitro Diagnostics
  • Others 

logoGlobal Magnetic Beads Market: Regional Segmentation Analysis

  • North America
    • The U.S.
    • Canada
  • Europe
    • Germany
    • The UK
    • France
    • Spain
    • Italy
    • Rest of Europe
  • Asia Pacific
    • China
    • Japan
    • India
    • South Korea
    • Southeast Asia
    • Rest of Asia Pacific
  • Latin America
    • Brazil
    • Mexico
    • Rest of Latin America
  • Middle East & Africa
    • GCC
    • South Africa
    • Rest of Middle East & Africa

Table of Content

  1. CHAPTER 1. Executive Summary
  2. CHAPTER 2. Magnetic Beads market – Product Analysis
    1. 2.1. Global Magnetic Beads Market – Product Overview
    2. 2.2. Global Magnetic Beads Market Share, by Product , 2019&2026 (USD Million)
    3. 2.3. Dynabeads
      1. 2.3.1. Global Dynabeads Magnetic Beads Market, 2016-2026 (USD Million)
    4. 2.4. Turbo Beads
      1. 2.4.1. Global Turbo Beads Magnetic Beads Market, 2016-2026 (USD Million)
    5. 2.5. Others
      1. 2.5.1. Global Others Magnetic Beads Market, 2016-2026 (USD Million)
  3. CHAPTER 3. Magnetic Beads market – Industry Level Analysis
    1. 3.1. Global Magnetic Beads Market – Industry Level Overview
    2. 3.2. Global Magnetic Beads Market Share, by Industry Level, 2019&2026 (USD Million)
    3. 3.3. Bioresearch
      1. 3.3.1. Global Bioresearch Magnetic Beads Market, 2016-2026 (USD Million)
    4. 3.4. In-Vitro Diagnostics
      1. 3.4.1. Global In-Vitro Diagnostics Magnetic Beads Market, 2016-2026 (USD Million)
    5. 3.5. Others
      1. 3.5.1. Global Others Magnetic Beads Market, 2016-2026 (USD Million)
  4. CHAPTER 4. Magnetic Beads market – Sales Channel Analysis
    1. 4.1. Global Magnetic Beads Market – Sales Channel Overview
    2. 4.2. Global Magnetic Beads Market Share, by Sales Channel, 2019&2026 (USD Million)
    3. 4.3. Direct Sales
      1. 4.3.1. Global Direct Sales Magnetic Beads Market, 2016-2026 (USD Million)
    4. 4.4. Distributor
      1. 4.4.1. Global Distributor Magnetic Beads Market, 2016-2026 (USD Million)
  5. CHAPTER 5. Magnetic Beads market – Regional Analysis
    1. 5.1. Global Magnetic Beads Market Regional Overview
    2. 5.2. Global Magnetic Beads Market Share, by Region, 2019&2026 (Value)
    3. 5.3. North America
      1. 5.3.1. North America Magnetic Beads Market size and forecast, 2016-2026
      2. 5.3.2. North America Magnetic Beads Market, by Country, 2019&2026 (USD Million)
      3. 5.3.3. North America Magnetic Beads Market, by Product , 2016-2026
        1. 5.3.3.1. North America Magnetic Beads Market, by Product , 2016-2026 (USD Million)
      4. 5.3.4. North America Magnetic Beads Market, by Industry Level, 2016-2026
        1. 5.3.4.1. North America Magnetic Beads Market, by Industry Level, 2016-2026 (USD Million)
      5. 5.3.5. North America Magnetic Beads Market, by Sales Channel, 2016-2026
        1. 5.3.5.1. North America Magnetic Beads Market, by Sales Channel, 2016-2026 (USD Million)
      6. 5.3.6. U.S.
        1. 5.3.6.1. U.S. Market size and forecast, 2016-2026 (USD Million)
      7. 5.3.7. Canada
        1. 5.3.7.1. Canada Market size and forecast, 2016-2026 (USD Million)
    4. 5.4. Europe
      1. 5.4.1. Europe Magnetic Beads Market size and forecast, 2016-2026
      2. 5.4.2. Europe Magnetic Beads Market, by Country, 2019&2026 (USD Million)
      3. 5.4.3. Europe Magnetic Beads Market, by Product , 2016-2026
        1. 5.4.3.1. Europe Magnetic Beads Market, by Product , 2016-2026 (USD Million)
      4. 5.4.4. Europe Magnetic Beads Market, by Industry Level, 2016-2026
        1. 5.4.4.1. Europe Magnetic Beads Market, by Industry Level, 2016-2026 (USD Million)
      5. 5.4.5. Europe Magnetic Beads Market, by Sales Channel, 2016-2026
        1. 5.4.5.1. Europe Magnetic Beads Market, by Sales Channel, 2016-2026 (USD Million)
      6. 5.4.6. Germany
        1. 5.4.6.1. Germany Market size and forecast, 2016-2026 (USD Million)
      7. 5.4.7. France
        1. 5.4.7.1. France Market size and forecast, 2016-2026 (USD Million)
      8. 5.4.8. U.K.
        1. 5.4.8.1. U.K. Market size and forecast, 2016-2026 (USD Million)
      9. 5.4.9. Italy
        1. 5.4.9.1. Italy Market size and forecast, 2016-2026 (USD Million)
      10. 5.4.10. Spain
        1. 5.4.10.1. Spain Market size and forecast, 2016-2026 (USD Million)
      11. 5.4.11. Rest of Europe
        1. 5.4.11.1. Rest of Europe Market size and forecast, 2016-2026 (USD Million)
    5. 5.5. Asia Pacific
      1. 5.5.1. Asia Pacific Magnetic Beads Market size and forecast, 2016-2026
      2. 5.5.2. Asia Pacific Magnetic Beads Market, by Country, 2019&2026 (USD Million)
      3. 5.5.3. Asia Pacific Magnetic Beads Market, by Product , 2016-2026
        1. 5.5.3.1. Asia Pacific Magnetic Beads Market, by Product , 2016-2026 (USD Million)
      4. 5.5.4. Asia Pacific Magnetic Beads Market, by Industry Level, 2016-2026
        1. 5.5.4.1. Asia Pacific Magnetic Beads Market, by Industry Level, 2016-2026 (USD Million)
      5. 5.5.5. Asia Pacific Magnetic Beads Market, by Sales Channel, 2016-2026
        1. 5.5.5.1. Asia Pacific Magnetic Beads Market, by Sales Channel, 2016-2026 (USD Million)
      6. 5.5.6. China
        1. 5.5.6.1. China Market size and forecast, 2016-2026 (USD Million)
      7. 5.5.7. Japan
        1. 5.5.7.1. Japan Market size and forecast, 2016-2026 (USD Million)
      8. 5.5.8. India
        1. 5.5.8.1. India Market size and forecast, 2016-2026 (USD Million)
      9. 5.5.9. South Korea
        1. 5.5.9.1. South Korea Market size and forecast, 2016-2026 (USD Million)
      10. 5.5.10. South-East Asia
        1. 5.5.10.1. South-East Asia Market size and forecast, 2016-2026 (USD Million)
      11. 5.5.11. Rest of Asia Pacific
        1. 5.5.11.1. Rest of Asia Pacific Market size and forecast, 2016-2026 (USD Million)
    6. 5.6. Latin America
      1. 5.6.1. Latin America Magnetic Beads Market size and forecast, 2016-2026
      2. 5.6.2. Latin America Magnetic Beads Market, by Country, 2019&2026 (USD Million)
      3. 5.6.3. Latin America Magnetic Beads Market, by Product , 2016-2026
        1. 5.6.3.1. Latin America Magnetic Beads Market, by Product , 2016-2026 (USD Million)
      4. 5.6.4. Latin America Magnetic Beads Market, by Industry Level, 2016-2026
        1. 5.6.4.1. Latin America Magnetic Beads Market, by Industry Level, 2016-2026 (USD Million)
      5. 5.6.5. Latin America Magnetic Beads Market, by Sales Channel, 2016-2026
        1. 5.6.5.1. Latin America Magnetic Beads Market, by Sales Channel, 2016-2026 (USD Million)
      6. 5.6.6. Brazil
        1. 5.6.6.1. Brazil Market size and forecast, 2016-2026 (USD Million)
      7. 5.6.7. Mexico
        1. 5.6.7.1. Mexico Market size and forecast, 2016-2026 (USD Million)
      8. 5.6.8. Rest of Latin America
        1. 5.6.8.1. Rest of Latin America Market size and forecast, 2016-2026 (USD Million)
    7. 5.7. The Middle-East and Africa
      1. 5.7.1. The Middle-East and Africa Magnetic Beads Market size and forecast, 2016-2026
      2. 5.7.2. The Middle-East and Africa Magnetic Beads Market, by Country, 2019&2026 (USD Million)
      3. 5.7.3. The Middle-East and Africa Magnetic Beads Market, by Product , 2016-2026
        1. 5.7.3.1. The Middle-East and Africa Magnetic Beads Market, by Product , 2016-2026 (USD Million)
      4. 5.7.4. The Middle-East and Africa Magnetic Beads Market, by Industry Level, 2016-2026
        1. 5.7.4.1. The Middle-East and Africa Magnetic Beads Market, by Industry Level, 2016-2026 (USD Million)
      5. 5.7.5. The Middle-East and Africa Magnetic Beads Market, by Sales Channel, 2016-2026
        1. 5.7.5.1. The Middle-East and Africa Magnetic Beads Market, by Sales Channel, 2016-2026 (USD Million)
      6. 5.7.6. GCC Countries
        1. 5.7.6.1. GCC Countries Market size and forecast, 2016-2026 (USD Million)
      7. 5.7.7. South Africa
        1. 5.7.7.1. South Africa Market size and forecast, 2016-2026 (USD Million)
      8. 5.7.8. Rest of Middle-East Africa
        1. 5.7.8.1. Rest of Middle-East Africa Market size and forecast, 2016-2026 (USD Million)
  6. CHAPTER 6. Magnetic Beads market – Competitive Landscape
    1. 6.1. Competitor Market Share – Revenue
    2. 6.2. Market Concentration Rate Analysis, Top 3 and Top 5 Players
    3. 6.3. Strategic Development
      1. 6.3.1. Acquisitions and Mergers
      2. 6.3.2. New Products
      3. 6.3.3. Research & Development Activities
  7. CHAPTER 7. Company Profiles
    1. 7.1. Thermo Fisher Scientific (Dynal)
      1. 7.1.1. Company Overview
      2. 7.1.2. Thermo Fisher Scientific (Dynal) Revenue and Gross Margin
      3. 7.1.3. Product portfolio
      4. 7.1.4. Recent initiatives
    2. 7.2. Merck Millipore
      1. 7.2.1. Company Overview
      2. 7.2.2. Merck Millipore Revenue and Gross Margin
      3. 7.2.3. Product portfolio
      4. 7.2.4. Recent initiatives
    3. 7.3. Bang Laboratories
      1. 7.3.1. Company Overview
      2. 7.3.2. Bang Laboratories Revenue and Gross Margin
      3. 7.3.3. Product portfolio
      4. 7.3.4. Recent initiatives
    4. 7.4. Qiagen
      1. 7.4.1. Company Overview
      2. 7.4.2. Qiagen Revenue and Gross Margin
      3. 7.4.3. Product portfolio
      4. 7.4.4. Recent initiatives
    5. 7.5. CardioGenics
      1. 7.5.1. Company Overview
      2. 7.5.2. CardioGenics Revenue and Gross Margin
      3. 7.5.3. Product portfolio
      4. 7.5.4. Recent initiatives
    6. 7.6. Takara (Clontech)
      1. 7.6.1. Company Overview
      2. 7.6.2. Takara (Clontech) Revenue and Gross Margin
      3. 7.6.3. Product portfolio
      4. 7.6.4. Recent initiatives
    7. 7.7. Spherotech
      1. 7.7.1. Company Overview
      2. 7.7.2. Spherotech Revenue and Gross Margin
      3. 7.7.3. Product portfolio
      4. 7.7.4. Recent initiatives
    8. 7.8. GenScript
      1. 7.8.1. Company Overview
      2. 7.8.2. GenScript Revenue and Gross Margin
      3. 7.8.3. Product portfolio
      4. 7.8.4. Recent initiatives
    9. 7.9. Bio Rad
      1. 7.9.1. Company Overview
      2. 7.9.2. Bio Rad Revenue and Gross Margin
      3. 7.9.3. Product portfolio
      4. 7.9.4. Recent initiatives
    10. 7.10. Geneaid Biotech
      1. 7.10.1. Company Overview
      2. 7.10.2. Geneaid Biotech Revenue and Gross Margin
      3. 7.10.3. Product portfolio
      4. 7.10.4. Recent initiatives
    11. 7.11. NEB
      1. 7.11.1. Company Overview
      2. 7.11.2. NEB Revenue and Gross Margin
      3. 7.11.3. Product portfolio
      4. 7.11.4. Recent initiatives
    12. 7.12. Rockland
      1. 7.12.1. Company Overview
      2. 7.12.2. Rockland Revenue and Gross Margin
      3. 7.12.3. Product portfolio
      4. 7.12.4. Recent initiatives
    13. 7.13. Others
      1. 7.13.1. Company Overview
      2. 7.13.2. Others Revenue and Gross Margin
      3. 7.13.3. Product portfolio
      4. 7.13.4. Recent initiatives
  8. CHAPTER 8. Magnetic Beads — Industry Analysis
    1. 8.1. Magnetic Beads Market – Key Trends
      1. 8.1.1. Market Drivers
      2. 8.1.2. Market Restraints
      3. 8.1.3. Market Opportunities
    2. 8.2. Value Chain Analysis
    3. 8.3. Technology Roadmap and Timeline
    4. 8.4. Magnetic Beads Market – Attractiveness Analysis
      1. 8.4.1. By Product
      2. 8.4.2. By Industry Level
      3. 8.4.3. By Sales Channel
      4. 8.4.4. By Region
  9. CHAPTER 9. Marketing Strategy Analysis, Distributors
    1. 9.1. Marketing Channel
    2. 9.2. Direct Marketing
    3. 9.3. Indirect Marketing
    4. 9.4. Marketing Channel Development Trend
    5. 9.5. Economic/Political Environmental Change
  10. CHAPTER 10. Report Conclusion
  11. CHAPTER 11. Research Approach & Methodology
    1. 11.1. Report Description
    2. 11.2. Research Scope
    3. 11.3. Research Methodology
      1. 11.3.1. Secondary Research
      2. 11.3.2. Primary Research
      3. 11.3.3. Models
        1. 11.3.3.1. Company Share Analysis Model
        2. 11.3.3.2. Revenue Based Modeling
        3. 11.3.3.3. Research Limitations

        List of Figures

        FIG. 1 Global Magnetic Beads Market, 2016-2026 (USD Million)
        FIG. 2 Global Magnetic Beads Market Share, by Product , 2019&2026 (USD Million)
        FIG. 3 Global Dynabeads Magnetic Beads Market, 2016-2026 (USD Million)
        FIG. 4 Global Turbo Beads Magnetic Beads Market, 2016-2026 (USD Million)
        FIG. 5 Global Others Magnetic Beads Market, 2016-2026 (USD Million)
        FIG. 6 Global Magnetic Beads Market Share, by Industry Level, 2019&2026 (USD Million)
        FIG. 7 Global Bioresearch  Magnetic Beads Market, 2016-2026 (USD Million)
        FIG. 8 Global In-Vitro Diagnostics  Magnetic Beads Market, 2016-2026 (USD Million)
        FIG. 9 Global Others Magnetic Beads Market, 2016-2026 (USD Million)
        FIG. 10 Global Magnetic Beads Market Share, by Sales Channel, 2019&2026 (USD Million)
        FIG. 11 Global Direct Sales Magnetic Beads Market, 2016-2026 (USD Million)
        FIG. 12 Global Distributor Magnetic Beads Market, 2016-2026 (USD Million)
        FIG. 13 Global Magnetic Beads Market Share, by Region, 2019&2026
        FIG. 14 North America Magnetic Beads Market, 2016-2026
        FIG. 15 U.S. Magnetic Beads Market, 2016-2026
        FIG. 16 Canada Magnetic Beads Market, 2016-2026
        FIG. 17 Europe Magnetic Beads Market, 2016-2026
        FIG. 18 Germany Magnetic Beads Market, 2016-2026
        FIG. 19 France Magnetic Beads Market, 2016-2026
        FIG. 20 U.K. Magnetic Beads Market, 2016-2026
        FIG. 21 Italy Magnetic Beads Market, 2016-2026
        FIG. 22 Spain Magnetic Beads Market, 2016-2026
        FIG. 23 Rest of Europe Magnetic Beads Market, 2016-2026
        FIG. 24 Asia Pacific Magnetic Beads Market, 2016-2026
        FIG. 25 China Magnetic Beads Market, 2016-2026
        FIG. 26 Japan Magnetic Beads Market, 2016-2026
        FIG. 27 India Magnetic Beads Market, 2016-2026
        FIG. 28 South  Korea Magnetic Beads Market, 2016-2026
        FIG. 29 South-East Asia Magnetic Beads Market, 2016-2026
        FIG. 30 Rest of Asia Pacific Magnetic Beads Market, 2016-2026
        FIG. 31 Latin America Magnetic Beads Market, 2016-2026
        FIG. 32 Brazil Magnetic Beads Market, 2016-2026
        FIG. 33 Mexico Magnetic Beads Market, 2016-2026
        FIG. 34 Rest of Latin America Magnetic Beads Market, 2016-2026
        FIG. 35 The Middle-East and Africa Magnetic Beads Market, 2016-2026
        FIG. 36 GCC Countries Magnetic Beads Market, 2016-2026
        FIG. 37 South Africa Magnetic Beads Market, 2016-2026
        FIG. 38 Rest of Middle-East Africa Magnetic Beads Market, 2016-2026
        FIG. 39 Competitor Market Share – Revenue
        FIG. 40 Thermo Fisher Scientific (Dynal) Revenue and Growth Rate
        FIG. 41 Thermo Fisher Scientific (Dynal) Market Share
        FIG. 42 Merck Millipore Revenue and Growth Rate
        FIG. 43 Merck Millipore Market Share
        FIG. 44 Bang Laboratories Revenue and Growth Rate
        FIG. 45 Bang Laboratories Market Share
        FIG. 46 Qiagen Revenue and Growth Rate
        FIG. 47 Qiagen Market Share
        FIG. 48 CardioGenics Revenue and Growth Rate
        FIG. 49 CardioGenics Market Share
        FIG. 50 Takara (Clontech) Revenue and Growth Rate
        FIG. 51 Takara (Clontech) Market Share
        FIG. 52 Spherotech Revenue and Growth Rate
        FIG. 53 Spherotech Market Share
        FIG. 54 GenScript Revenue and Growth Rate
        FIG. 55 GenScript Market Share
        FIG. 56 Bio Rad Revenue and Growth Rate
        FIG. 57 Bio Rad Market Share
        FIG. 58 Geneaid Biotech Revenue and Growth Rate
        FIG. 59 Geneaid Biotech Market Share
        FIG. 60 NEB Revenue and Growth Rate
        FIG. 61 NEB Market Share
        FIG. 62 Rockland Revenue and Growth Rate
        FIG. 63 Rockland Market Share
        FIG. 64 Others Revenue and Growth Rate
        FIG. 65 Others Market Share
        FIG. 66 Market Dynamics
        FIG. 67 Global Magnetic Beads – Value Chain Analysis
        FIG. 68 Technology Roadmap and Timeline
        FIG. 69 Market Attractiveness Analysis – By Product
        FIG. 70 Market Attractiveness Analysis – By Industry Level
        FIG. 71 Market Attractiveness Analysis – By Sales Channel
        FIG. 72 Market Attractiveness Analysis – By Region
        FIG. 73 Market Channel
        FIG. 74 Marketing Channel Development Trend
        FIG. 75 Growth in World Gross Product, 2008-2019

        List of Tables

        TABLE 1 Global Magnetic Beads Market, 2019&2026 (USD Million)
        TABLE 2 Global Magnetic Beads market, by Product , 2016-2026 (USD Million)
        TABLE 3 Global Magnetic Beads market, by Industry Level, 2016-2026 (USD Million)
        TABLE 4 Global Magnetic Beads market, by Sales Channel, 2016-2026 (USD Million)
        TABLE 5 Global Magnetic Beads market, by Region, 2016-2026 (USD Million)
        TABLE 6 North America Magnetic Beads Market, by Product , 2016-2026 (USD Million)
        TABLE 7 North America Magnetic Beads Market, by Industry Level, 2016-2026 (USD Million)
        TABLE 8 North America Magnetic Beads Market, by Sales Channel, 2016-2026 (USD Million)
        TABLE 9 Europe Magnetic Beads Market, by Product , 2016-2026 (USD Million)
        TABLE 10 Europe Magnetic Beads Market, by Industry Level, 2016-2026 (USD Million)
        TABLE 11 Europe Magnetic Beads Market, by Sales Channel, 2016-2026 (USD Million)
        TABLE 12 Asia Pacific Magnetic Beads Market, by Product , 2016-2026 (USD Million)
        TABLE 13 Asia Pacific Magnetic Beads Market, by Industry Level, 2016-2026 (USD Million)
        TABLE 14 Asia Pacific Magnetic Beads Market, by Sales Channel, 2016-2026 (USD Million)
        TABLE 15 Latin America Magnetic Beads Market, by Product , 2016-2026 (USD Million)
        TABLE 16 Latin America Magnetic Beads Market, by Industry Level, 2016-2026 (USD Million)
        TABLE 17 Latin America Magnetic Beads Market, by Sales Channel, 2016-2026 (USD Million)
        TABLE 18 The Middle-East and Africa Magnetic Beads Market, by Product , 2016-2026 (USD Million)
        TABLE 19 The Middle-East and Africa Magnetic Beads Market, by Industry Level, 2016-2026 (USD Million)
        TABLE 20 The Middle-East and Africa Magnetic Beads Market, by Sales Channel, 2016-2026 (USD Million)
        TABLE 21 Global Magnetic Beads Market - Company Revenue Analysis 2016-2019 (USD Million)
        TABLE 22 Global Magnetic Beads Market - Company Revenue Share Analysis 2016-2019(%)
        TABLE 23 Acquisitions and Mergers
        TABLE 24 New Product/Service Launch
        TABLE 25 Research & Development Activities
        TABLE 26 Market Drivers
        TABLE 27 Market Restraints
        TABLE 28 Market Opportunities

Industry Major Market Players

  •  Thermo Fisher Scientific (Dynal)
  •  Merck Millipore
  •  Bang Laboratories
  •  Qiagen
  •  CardioGenics
  •  Takara (Clontech)
  •  Spherotech
  •  GenScript
  •  Bio Rad
  •  Geneaid Biotech
  •  NEB
  •  Rockland