Search Market Research Report

Discover Our Latest Reports
Discover Our Featured Reports
Discover Top Selling Reports

Magnesium Oxide Market Size, Share Global Analysis Report, 2020–2026

report img

Magnesium Oxide Market By Type (Light Burned Magnesium Oxide, Hard Burned Magnesium Oxide, Dead Burned Magnesium Oxide) And By Application (Refractories Industry, Agriculture Industry, Chemical Intermediates, Construction Industry, Others): Global Industry Outlook, Market Size, Business Intelligence, Consumer Preferences, Statistical Surveys, Comprehensive Analysis, Historical Developments, Current Trends, and Forecast 2020–2026

Industry Insights

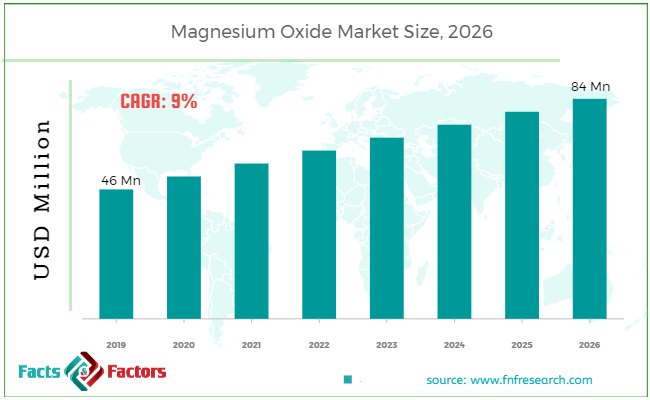
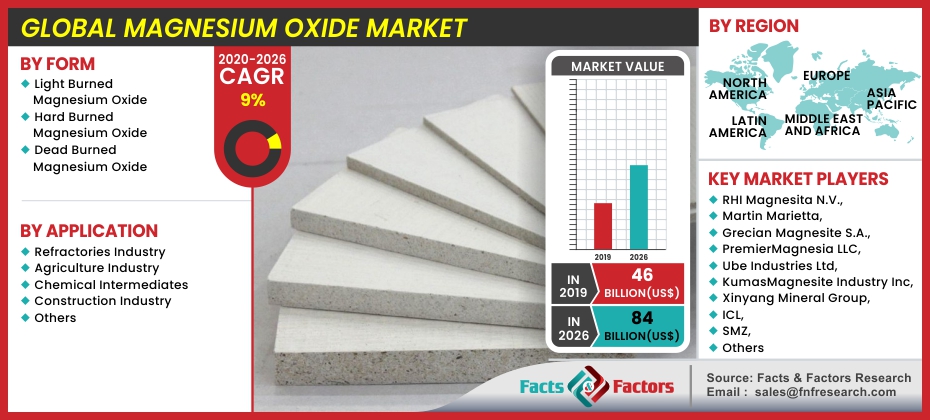
[185+ Pages Report] According to the report published by Facts Factors, the global magnesium oxide market size was worth around USD 46 million in 2019 and is predicted to grow to around USD 84 million by 2026 with a compound annual growth rate (CAGR) of roughly 9% between 2020 and 2026. The report analyzes the global magnesium oxide market drivers, restraints/challenges, and the effect they have on the demands during the projection period. In addition, the report explores emerging opportunities in the magnesium oxide market.

Magnesium Oxide Market Size

To know more about this report | Request Free Sample Copy

This specialized and expertise oriented industry research report scrutinizes the technical and commercial business outlook of the Magnesium Oxide industry. The report analyzes and declares the historical and current trends analysis of the Magnesium Oxide industry and subsequently recommends the projected trends anticipated to be observed in the Magnesium Oxide market during the upcoming years.


logoKey Insights from Primary Research

  • As per the analysis shared by our primary respondents, the Magnesium Oxide market is expected to grow annually at a CAGR of around 9%.
  • Through the primary research, it was established that the Magnesium Oxidemarket was valued at around USD 46 Million in 2019.
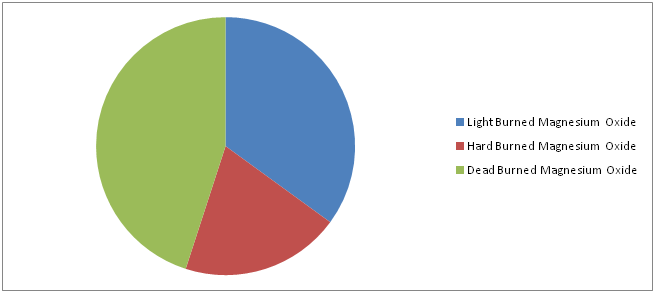
  • Based on type segmentation, the Dead Burned Magnesium Oxidewas predicted to show maximum market share in the year 2019.
  • The Refractories Industry category, based on application segmentation, was the leading revenue-generating category in 2019.
  • On the basis of region, the “Asia Pacific” region was the leading revenue generator in 2019.

logoKey Recommendations from Analysts

  • As per our analysts, the magnesium oxide market demand is escalating owing to its numerous benefits such as corrosion and temperature resistance along with high tensile strength.
  • The non-toxic and odorless properties of magnesium oxide make it a perfect option for industrial applications.
  • Growing at a CAGR around 9%, the magnesium oxide market provides numerous growth optionsfor all of the involved shareholders across the entire value chain.
  • The growing use of magnesium oxide nutrition supplements makes it an ideal option for livestock feeds.
  • Our analysts have identified the “Construction Industry” category as the leading investment pocket for the magnesium oxide market in terms of application segmentation respectively.

logoMarket Attractiveness – By Type

Magnesium Oxide Market

To know more about this report | Request Free Sample Copy


The Magnesium Oxide market report analyzes and notifies the industry statistics at the global as well as regional and country levels in order to acquire a thorough perspective of the entire Magnesium Oxide market. The historical and past insights are provided for FY 2016 to FY 2019 whereas projected trends are delivered for FY 2020 to FY 2026. The quantitative and numerical data is represented in terms of both volumes (Tons) and value (USD Million) from FY 2016 – 2026.

The quantitative data is further underlined and reinforced by comprehensive qualitative data which comprises various across-the-board market dynamics. The rationales which directly or indirectly impact the Magnesium Oxide industry are exemplified through parameters such as growth drivers, restraints, challenges, and opportunities among other impacting factors.

Throughout our research report, we have encompassed all the proven models and tools of industry analysis and extensively illustrated all the key business strategies and business models adopted in the Magnesium Oxide industry. The report provides an all-inclusive and detailed competitive landscape prevalent in the Magnesium Oxide market.

The report utilizes established industry analysis tools and models such as Porter’s Five Forces framework to analyze and recognize critical business strategies adopted by various stakeholders involved in the entire value chain of the Magnesium Oxide industry. The Magnesium Oxide market report additionally employs SWOT analysis and PESTLE analysis models for further in-depth analysis.

The report study further includes an in-depth analysis of industry players' market shares and provides an overview of leading players' market position in the Magnesium Oxide sector. Key strategic developments in the Magnesium Oxide market competitive landscape such as acquisitions & mergers, inaugurations of different products and services, partnerships & joint ventures, MoU agreements, VC & funding activities, R&D activities, and geographic expansion among other noteworthy activities by key players of the Magnesium Oxide market are appropriately highlighted in the report.

Magnesium Oxide Market

To know more about this report | Request Free Sample Copy

Magnesium Oxide is a naturally occurring white alkaline material obtained through the calcination of naturally occurring materials and has no color nor taste. It has high strength and temperature resistance. It is used as a magnesium supplement in livestock feeds to fulfill their nutrition gains for better yield. Its versatile properties make it useful in several applications such as construction, medical, steel, and chemical industry. However, increasing penetration of nanocrystalline magnesium oxide in several applications provides several opportunities in the coming years. The region of Asia Pacific is projected to show dominance owing to the agrarian practices in major countries of the region along with the rapid industrialization activities in developing nations such as China and India.

The Magnesium Oxide market research report delivers an acutevaluationand taxonomy of the Magnesium Oxide industry by practically splitting the market on the basis of different types, applications, and regions. Through the analysis of the historical and projected trends, all the segments and sub-segments were evaluated through the bottom-up approach, and different market sizes have been projected for FY 2020 to FY 2026.

The regional segmentation of the Magnesium Oxide industry includes the complete classification of all the major continents including North America, Latin America, Europe, Asia Pacific, and the Middle East & Africa. Further, country-wise data for the Magnesium Oxide industry is provided for the leading economies of the world.

The Magnesium Oxide market is segmented based on Form and Application. On the basis of segmentation, the market is classified into Light Burned Magnesium Oxide, Hard Burned Magnesium Oxide, Dead Burned Magnesium Oxide. In terms of application, the market is bifurcated into Refractories Industry, Agriculture Industry, Chemical Intermediates, Construction Industry, Others.

logoReport Scope

Report Attribute

Details

Market Size in 2019

( USD 46 Million)

Projected Market Size in 2026

( USD 84 Million)

CAGR Growth Rate

9% CAGR

Base Year

2021

Forecast Years

2022-2028

Key Market Players

RHI Magnesita N.V., Martin Marietta, Grecian Magnesite S.A., PremierMagnesia LLC, Ube Industries Ltd, KumasMagnesite Industry Inc, Xinyang Mineral Group, ICL, SMZ, a.s. Jelsava, Tateho Chemicals Industries Co., BaymagInc, and Others

Key Segment

By Form, Applications, and By Region

Major Regions Covered

North America, Europe, Asia Pacific, Latin America, and the Middle East & Africa

Purchase Options

Request customized purchase options to meet your research needs. Explore purchase options

logoSome of the essential players operating in the Magnesium Oxide market but not restricted to include

  • RHI Magnesita N.V.
  • Martin Marietta
  • Grecian Magnesite S.A.
  • PremierMagnesia LLC
  • Ube Industries Ltd
  • KumasMagnesite Industry Inc
  • Xinyang Mineral Group
  • ICL
  • SMZ
  • a.s. Jelsava
  • Tateho Chemicals Industries Co.
  • Baymag Inc

The taxonomy of the Magnesium Oxide market by its scope and segmentation is as follows:

logoBy Form Segmentation Analysis

  • Light Burned Magnesium Oxide
  • Hard Burned Magnesium Oxide
  • Dead Burned Magnesium Oxide

logoBy Application Segmentation Analysis

  • Refractories Industry
  • Agriculture Industry
  • Chemical Intermediates
  • Construction Industry
  • Others

logoBy Regional Segmentation Analysis

  • North America
    • The U.S.
    • Canada
  • Europe
    • Germany
    • The UK
    • France
    • Spain
    • Italy
    • Rest of Europe
  • Asia Pacific
    • China
    • Japan
    • India
    • South Korea
    • Southeast Asia
    • Rest of Asia Pacific
  • Latin America
    • Brazil
    • Mexico
    • Rest of Latin America
  • Middle East & Africa
    • GCC
    • South Africa
    • Rest of Middle East & Africa

Table of Content

  1. Chapter 1 Executive Summary
    1. 1.1. Introduction of Magnesium Oxide
    2. 1.2. Global Magnesium Oxide Market, 2019 & 2026 (USD Million)
    3. 1.3. Global Magnesium Oxide Market, 2016 – 2026 (USD Million) (Tons)
    4. 1.4. Global Magnesium Oxide Market Absolute Revenue Opportunity, 2016 – 2026 (USD Million)
    5. 1.5. Global Magnesium Oxide Market Incremental Revenue Opportunity, 2020 – 2026 (USD Million)
  2. Chapter 2 Magnesium Oxide Market – Type Analysis
    1. 2.1. Global Magnesium Oxide Market – Type Overview
    2. 2.2. Global Magnesium Oxide Market Share, by Type, 2019 & 2026 (USD Million)
    3. 2.3. Global Magnesium Oxide Market share, by Type, 2019 & 2026 (Tons)
    4. 2.4. Light Burned Magnesium Oxide
      1. 2.4.1. Global Light Burned Magnesium Oxide Magnesium Oxide Market, 2016 – 2026 (USD Million)
      2. 2.4.2. Global Light Burned Magnesium Oxide Magnesium Oxide Market, 2016 – 2026 (Tons)
    5. 2.5. Hard Burned Magnesium Oxide
      1. 2.5.1. Global Hard Burned Magnesium Oxide Magnesium Oxide Market, 2016 – 2026 (USD Million)
      2. 2.5.2. Global Hard Burned Magnesium Oxide Magnesium Oxide Market, 2016 – 2026 (Tons)
    6. 2.6. Dead Burned Magnesium Oxide
      1. 2.6.1. Global Dead Burned Magnesium Oxide Magnesium Oxide Market, 2016 – 2026 (USD Million)
      2. 2.6.2. Global Dead Burned Magnesium Oxide Magnesium Oxide Market, 2016 – 2026 (Tons)
  3. Chapter 3 Magnesium Oxide Market – Application Analysis
    1. 3.1. Global Magnesium Oxide Market – Application Overview
    2. 3.2. Global Magnesium Oxide Market Share, by Application, 2019 & 2026 (USD Million)
    3. 3.3. Global Magnesium Oxide Market share, by Application, 2019 & 2026 (Tons)
    4. 3.4. Refractories Industry
      1. 3.4.1. Global Refractories Industry Magnesium Oxide Market, 2016 – 2026 (USD Million)
      2. 3.4.2. Global Refractories Industry Magnesium Oxide Market, 2016 – 2026 (Tons)
    5. 3.5. Agriculture Industry
      1. 3.5.1. Global Agriculture Industry Magnesium Oxide Market, 2016 – 2026 (USD Million)
      2. 3.5.2. Global Agriculture Industry Magnesium Oxide Market, 2016 – 2026 (Tons)
    6. 3.6. Chemical Intermediates
      1. 3.6.1. Global Chemical Intermediates Magnesium Oxide Market, 2016 – 2026 (USD Million)
      2. 3.6.2. Global Chemical Intermediates Magnesium Oxide Market, 2016 – 2026 (Tons)
    7. 3.7. Construction Industry
      1. 3.7.1. Global Construction Industry Magnesium Oxide Market, 2016 – 2026 (USD Million)
      2. 3.7.2. Global Construction Industry Magnesium Oxide Market, 2016 – 2026 (Tons)
    8. 3.8. Others
      1. 3.8.1. Global Others Magnesium Oxide Market, 2016 – 2026 (USD Million)
      2. 3.8.2. Global Others Magnesium Oxide Market, 2016 – 2026 (Tons)
  4. Chapter 4 Magnesium Oxide Market – Regional Analysis
    1. 4.1. Global Magnesium Oxide Market Regional Overview
    2. 4.2. Global Magnesium Oxide Market Share, by Region, 2019 & 2026 (USD Million)
    3. 4.3. Global Magnesium Oxide Market Share, by Region, 2019 & 2026 (Tons)
    4. 4.4. North America
      1. 4.4.1. North America Magnesium Oxide Market, 2016 – 2026 (USD Million)
        1. 4.4.1.1. North America Magnesium Oxide Market, by Country, 2016 – 2026 (USD Million)
      2. 4.4.2. North America Market, 2016 – 2026 (Tons)
        1. 4.4.2.1. North America Magnesium Oxide Market, by Country, 2016 – 2026 (Tons)
      3. 4.4.3. North America Magnesium Oxide Market, by Type, 2016 – 2026
        1. 4.4.3.1. North America Magnesium Oxide Market, by Type, 2016 – 2026 (USD Million)
        2. 4.4.3.2. North America Magnesium Oxide Market, by Type, 2016 – 2026 (Tons)
      4. 4.4.4. North America Magnesium Oxide Market, by Application, 2016 – 2026
        1. 4.4.4.1. North America Magnesium Oxide Market, by Application, 2016 – 2026 (USD Million)
        2. 4.4.4.2. North America Magnesium Oxide Market, by Application, 2016 – 2026 (Tons)
      5. 4.4.5. U.S.
        1. 4.4.5.1. U.S. Magnesium Oxide Market, 2016 – 2026 (USD Million)
        2. 4.4.5.2. U.S. Magnesium Oxide Market, 2016 – 2026 (Tons)
      6. 4.4.6. Canada
        1. 4.4.6.1. Canada Magnesium Oxide Market, 2016 – 2026 (USD Million)
        2. 4.4.6.2. Canada Magnesium Oxide Market, 2016 – 2026 (Tons)
    5. 4.5. Europe
      1. 4.5.1. Europe Magnesium Oxide Market, 2016 – 2026 (USD Million)
        1. 4.5.1.1. Europe Magnesium Oxide Market, by Country, 2016 – 2026 (USD Million)
      2. 4.5.2. Europe Market, 2016 – 2026 (Tons)
        1. 4.5.2.1. Europe Magnesium Oxide Market, by Country, 2016 – 2026 (Tons)
      3. 4.5.3. Europe Magnesium Oxide Market, by Type, 2016 – 2026
        1. 4.5.3.1. Europe Magnesium Oxide Market, by Type, 2016 – 2026 (USD Million)
        2. 4.5.3.2. Europe Magnesium Oxide Market, by Type, 2016 – 2026 (Tons)
      4. 4.5.4. Europe Magnesium Oxide Market, by Application, 2016 – 2026
        1. 4.5.4.1. Europe Magnesium Oxide Market, by Application, 2016 – 2026 (USD Million)
        2. 4.5.4.2. Europe Magnesium Oxide Market, by Application, 2016 – 2026 (Tons)
      5. 4.5.5. Germany
        1. 4.5.5.1. Germany Magnesium Oxide Market, 2016 – 2026 (USD Million)
        2. 4.5.5.2. Germany Magnesium Oxide Market, 2016 – 2026 (Tons)
      6. 4.5.6. France
        1. 4.5.6.1. France Magnesium Oxide Market, 2016 – 2026 (USD Million)
        2. 4.5.6.2. France Magnesium Oxide Market, 2016 – 2026 (Tons)
      7. 4.5.7. U.K.
      8. 4.5.7.1 U.K. Magnesium Oxide Market, 2016 – 2026 (USD Million)
        1. 4.5.7.2. U.K. Magnesium Oxide Market, 2016 – 2026 (Tons)
      9. 4.5.8. Italy
        1. 4.5.8.1. Italy Magnesium Oxide Market, 2016 – 2026 (USD Million)
        2. 4.5.8.2. Italy Magnesium Oxide Market, 2016 – 2026 (Tons)
      10. 4.5.9. Spain
        1. 4.5.9.1. Spain Magnesium Oxide Market, 2016 – 2026 (USD Million)
        2. 4.5.9.2. Spain Magnesium Oxide Market, 2016 – 2026 (Tons)
      11. 4.5.10. Rest of Europe
        1. 4.5.10.1. Rest of Europe Magnesium Oxide Market, 2016 – 2026 (USD Million)
        2. 4.5.10.2. Rest of Europe Magnesium Oxide Market, 2016 – 2026 (Tons)
    6. 4.6. Asia Pacific
      1. 4.6.1. Asia Pacific Magnesium Oxide Market, 2016 – 2026 (USD Million)
        1. 4.6.1.1. Asia Pacific Magnesium Oxide Market, by Country, 2016 – 2026 (USD Million)
      2. 4.6.2. Asia Pacific Market, 2016 – 2026 (Tons)
        1. 4.6.2.1. Asia Pacific Magnesium Oxide Market, by Country, 2016 – 2026 (Tons)
      3. 4.6.3. Asia Pacific Magnesium Oxide Market, by Type, 2016 – 2026
        1. 4.6.3.1. Asia Pacific Magnesium Oxide Market, by Type, 2016 – 2026 (USD Million)
        2. 4.6.3.2. Asia Pacific Magnesium Oxide Market, by Type, 2016 – 2026 (Tons)
      4. 4.6.4. Asia Pacific Magnesium Oxide Market, by Application, 2016 – 2026
        1. 4.6.4.1. Asia Pacific Magnesium Oxide Market, by Application, 2016 – 2026 (USD Million)
        2. 4.6.4.2. Asia Pacific Magnesium Oxide Market, by Application, 2016 – 2026 (Tons)
      5. 4.6.5. China
        1. 4.6.5.1. China Magnesium Oxide Market, 2016 – 2026 (USD Million)
        2. 4.6.5.2. China Magnesium Oxide Market, 2016 – 2026 (Tons)
      6. 4.6.6. Japan
        1. 4.6.6.1. Japan Magnesium Oxide Market, 2016 – 2026 (USD Million)
        2. 4.6.6.2. Japan Magnesium Oxide Market, 2016 – 2026 (Tons)
      7. 4.6.7. India
        1. 4.6.7.1. India Magnesium Oxide Market, 2016 – 2026 (USD Million)
        2. 4.6.7.2. India Magnesium Oxide Market, 2016 – 2026 (Tons)
      8. 4.6.8. South Korea
        1. 4.6.8.1. South Korea Magnesium Oxide Market, 2016 – 2026 (USD Million)
        2. 4.6.8.2. South Korea Magnesium Oxide Market, 2016 – 2026 (Tons)
      9. 4.6.9. South-East Asia
        1. 4.6.9.1. South-East Asia Magnesium Oxide Market, 2016 – 2026 (USD Million)
        2. 4.6.9.2. South-East Asia Magnesium Oxide Market, 2016 – 2026 (Tons)
      10. 4.6.10. Rest of Asia Pacific
        1. 4.6.10.1. Rest of Asia Pacific Magnesium Oxide Market, 2016 – 2026 (USD Million)
        2. 4.6.10.2. Rest of Asia Pacific Magnesium Oxide Market, 2016 – 2026 (Tons)
    7. 4.7. Latin America
      1. 4.7.1. Latin America Magnesium Oxide Market, 2016 – 2026 (USD Million)
        1. 4.7.1.1. Latin America Magnesium Oxide Market, by Country, 2016 – 2026 (USD Million)
      2. 4.7.2. Latin America Market, 2016 – 2026 (Tons)
        1. 4.7.2.1. Latin America Magnesium Oxide Market, by Country, 2016 – 2026 (Tons)
      3. 4.7.3. Latin America Magnesium Oxide Market, by Type, 2016 – 2026
        1. 4.7.3.1. Latin America Magnesium Oxide Market, by Type, 2016 – 2026 (USD Million)
        2. 4.7.3.2. Latin America Magnesium Oxide Market, by Type, 2016 – 2026 (Tons)
      4. 4.7.4. Latin America Magnesium Oxide Market, by Application, 2016 – 2026
        1. 4.7.4.1. Latin America Magnesium Oxide Market, by Application, 2016 – 2026 (USD Million)
        2. 4.7.4.2. Latin America Magnesium Oxide Market, by Application, 2016 – 2026 (Tons)
      5. 4.7.5. Brazil
        1. 4.7.5.1. Brazil Magnesium Oxide Market, 2016 – 2026 (USD Million)
        2. 4.7.5.2. Brazil Magnesium Oxide Market, 2016 – 2026 (Tons)
      6. 4.7.6. Mexico
        1. 4.7.6.1. Mexico Magnesium Oxide Market, 2016 – 2026 (USD Million)
        2. 4.7.6.2. Mexico Magnesium Oxide Market, 2016 – 2026 (Tons)
      7. 4.7.7. Rest of Latin America
        1. 4.7.7.1. Rest of Latin America Magnesium Oxide Market, 2016 – 2026 (USD Million)
        2. 4.7.7.2. Rest of Latin America Magnesium Oxide Market, 2016 – 2026 (Tons)
    8. 4.8. The Middle-East and Africa
      1. 4.8.1. The Middle-East and Africa Magnesium Oxide Market, 2016 – 2026 (USD Million)
        1. 4.8.1.1. The Middle-East and Africa Magnesium Oxide Market, by Country, 2016 – 2026 (USD Million)
      2. 4.8.2. The Middle-East and Africa Market, 2016 – 2026 (Tons)
        1. 4.8.2.1. The Middle-East and Africa Magnesium Oxide Market, by Country, 2016 – 2026 (Tons)
      3. 4.8.3. The Middle-East and Africa Magnesium Oxide Market, by Type, 2016 – 2026
        1. 4.8.3.1. The Middle-East and Africa Magnesium Oxide Market, by Type, 2016 – 2026 (USD Million)
        2. 4.8.3.2. The Middle-East and Africa Magnesium Oxide Market, by Type, 2016 – 2026 (Tons)
      4. 4.8.4. The Middle-East and Africa Magnesium Oxide Market, by Application, 2016 – 2026
        1. 4.8.4.1. The Middle-East and Africa Magnesium Oxide Market, by Application, 2016 – 2026 (USD Million)
        2. 4.8.4.2. The Middle-East and Africa Magnesium Oxide Market, by Application, 2016 – 2026 (Tons)
      5. 4.8.5. GCC Countries
        1. 4.8.5.1. GCC Countries Magnesium Oxide Market, 2016 – 2026 (USD Million)
        2. 4.8.5.2. GCC Countries Magnesium Oxide Market, 2016 – 2026 (Tons)
      6. 4.8.6. South Africa
        1. 4.8.6.1. South Africa Magnesium Oxide Market, 2016 – 2026 (USD Million)
        2. 4.8.6.2. South Africa Magnesium Oxide Market, 2016 – 2026 (Tons)
      7. 4.8.7. Rest of Middle-East Africa
        1. 4.8.7.1. Rest of Middle-East Africa Magnesium Oxide Market, 2016 – 2026 (USD Million)
        2. 4.8.7.2. Rest of Middle-East Africa Magnesium Oxide Market, 2016 – 2026 (Tons)
  5. Chapter 5 Magnesium Oxide Production, Consumption, Export, Import by Regions
    1. 5.1. Global Magnesium Oxide Production and Consumption, 2016 – 2026 (Tons)
    2. 5.2. Global Import and Export Analysis, by Region
  6. Chapter 6 Magnesium Oxide Market – Competitive Landscape
    1. 6.1. Competitor Market Share – Revenue
    2. 6.2. Market Concentration Rate Analysis, Top 3 and Top 5 Players
    3. 6.3. Competitor Market Share – Volume
    4. 6.4. Strategic Developments
      1. 6.4.1. Acquisitions and Mergers
      2. 6.4.2. New Products
      3. 6.4.3. Research & Development Activities
  7. Chapter 7 Company Profiles
    1. 7.1. RHI Magnesita N.V.
      1. 7.1.1. Company Overview
      2. 7.1.2. Product/Service Portfolio
      3. 7.1.3. RHI Magnesita N.V. Sales, Revenue, Price, and Gross Margin
      4. 7.1.4. RHI Magnesita N.V. Revenue and Growth Rate
      5. 7.1.5. RHI Magnesita N.V. Market Share
      6. 7.1.6. Recent Initiatives, Funding/VC Activities, and Technological Innovations
    2. 7.2. Martin Marietta
      1. 7.2.1. Company Overview
      2. 7.2.2. Product/Service Portfolio
      3. 7.2.3. Martin Marietta Sales, Revenue, Price, and Gross Margin
      4. 7.2.4. Martin Marietta Revenue and Growth Rate
      5. 7.2.5. Martin Marietta Market Share
      6. 7.2.6. Recent Initiatives, Funding/VC Activities, and Technological Innovations
    3. 7.3. Grecian Magnesite S.A.
      1. 7.3.1. Company Overview
      2. 7.3.2. Product/Service Portfolio
      3. 7.3.3. Grecian Magnesite S.A. Sales, Revenue, Price, and Gross Margin
      4. 7.3.4. Grecian Magnesite S.A. Revenue and Growth Rate
      5. 7.3.5. Grecian Magnesite S.A. Market Share
      6. 7.3.6. Recent Initiatives, Funding/VC Activities, and Technological Innovations
    4. 7.4. PremierMagnesia LLC
      1. 7.4.1. Company Overview
      2. 7.4.2. Product/Service Portfolio
      3. 7.4.3. PremierMagnesia LLC Sales, Revenue, Price, and Gross Margin
      4. 7.4.4. PremierMagnesia LLC Revenue and Growth Rate
      5. 7.4.5. PremierMagnesia LLC Market Share
      6. 7.4.6. Recent Initiatives, Funding/VC Activities, and Technological Innovations
    5. 7.5. Ube Industries Ltd
      1. 7.5.1. Company Overview
      2. 7.5.2. Product/Service Portfolio
      3. 7.5.3. Ube Industries Ltd Sales, Revenue, Price, and Gross Margin
      4. 7.5.4. Ube Industries Ltd Revenue and Growth Rate
      5. 7.5.5. Ube Industries Ltd Market Share
      6. 7.5.6. Recent Initiatives, Funding/VC Activities, and Technological Innovations
    6. 7.6. Kumas Magnesite Industry Inc
      1. 7.6.1. Company Overview
      2. 7.6.2. Product/Service Portfolio
      3. 7.6.3. Kumas Magnesite Industry Inc Sales, Revenue, Price, and Gross Margin
      4. 7.6.4. Kumas Magnesite Industry Inc Revenue and Growth Rate
      5. 7.6.5. Kumas Magnesite Industry Inc Market Share
      6. 7.6.6. Recent Initiatives, Funding/VC Activities, and Technological Innovations
    7. 7.7. Xinyang Mineral Group
      1. 7.7.1. Company Overview
      2. 7.7.2. Product/Service Portfolio
      3. 7.7.3. Xinyang Mineral Group Sales, Revenue, Price, and Gross Margin
      4. 7.7.4. Xinyang Mineral Group Revenue and Growth Rate
      5. 7.7.5. Xinyang Mineral Group Market Share
      6. 7.7.6. Recent Initiatives, Funding/VC Activities, and Technological Innovations
    8. 7.8. ICL
      1. 7.8.1. Company Overview
      2. 7.8.2. Product/Service Portfolio
      3. 7.8.3. ICL Sales, Revenue, Price, and Gross Margin
      4. 7.8.4. ICL Revenue and Growth Rate
      5. 7.8.5. ICL Market Share
      6. 7.8.6. Recent Initiatives, Funding/VC Activities, and Technological Innovations
    9. 7.9. SMZ, a.s. Jelsava
      1. 7.9.1. Company Overview
      2. 7.9.2. Product/Service Portfolio
      3. 7.9.3. SMZ, a.s. Jelsava Sales, Revenue, Price, and Gross Margin
      4. 7.9.4. SMZ, a.s. Jelsava Revenue and Growth Rate
      5. 7.9.5. SMZ, a.s. Jelsava Market Share
      6. 7.9.6. Recent Initiatives, Funding/VC Activities, and Technological Innovations
    10. 7.10. Tateho Chemicals Industries Co.
      1. 7.10.1. Company Overview
      2. 7.10.2. Product/Service Portfolio
      3. 7.10.3. Tateho Chemicals Industries Co. Sales, Revenue, Price, and Gross Margin
      4. 7.10.4. Tateho Chemicals Industries Co. Revenue and Growth Rate
      5. 7.10.5. Tateho Chemicals Industries Co. Market Share
      6. 7.10.6. Recent Initiatives, Funding/VC Activities, and Technological Innovations
    11. 7.11. Baymag Inc
      1. 7.11.1. Company Overview
      2. 7.11.2. Product/Service Portfolio
      3. 7.11.3. Baymag Inc Sales, Revenue, Price, and Gross Margin
      4. 7.11.4. Baymag Inc Revenue and Growth Rate
      5. 7.11.5. Baymag Inc Market Share
      6. 7.11.6. Recent Initiatives, Funding/VC Activities, and Technological Innovations
    12. 7.12. Others
      1. 7.12.1. Company Overview
      2. 7.12.2. Product/Service Portfolio
      3. 7.12.3. Others Sales, Revenue, Price, and Gross Margin
      4. 7.12.4. Others Revenue and Growth Rate
      5. 7.12.5. Others Market Share
      6. 7.12.6. Recent Initiatives, Funding/VC Activities, and Technological Innovations
  8. Chapter 8 Magnesium Oxide — Industry Analysis
    1. 8.1. Introduction and Taxonomy
    2. 8.2. Magnesium Oxide Market – Key Trends
      1. 8.2.1. Market Drivers
      2. 8.2.2. Market Restraints
      3. 8.2.3. Market Opportunities
    3. 8.3. Value Chain Analysis
    4. 8.4. Key Mandates and Regulations
    5. 8.5. Technology Roadmap and Timeline
    6. 8.6. Magnesium Oxide Market – Attractiveness Analysis
      1. 8.6.1. By Type
      2. 8.6.2. By Application
      3. 8.6.3. By Region
  9. Chapter 9 Raw Material Analysis
    1. 9.1. Magnesium Oxide Key Raw Material Analysis
      1. 9.1.1. Key Raw Materials
      2. 9.1.2. Price Trend of Key Raw Materials
    2. 9.2. Key Suppliers of Raw Materials
    3. 9.3. Proportion of Manufacturing Cost Structure
      1. 9.3.1. Raw Materials Cost
      2. 9.3.2. Labor Cost
      3. 9.3.3. Manufacturing Expenses
      4. 9.3.4. Miscellaneous Expenses
    4. 9.4. Manufacturing Cost Analysis of Magnesium Oxide
  10. Chapter 10 Industrial Chain, Sourcing Strategy, and Downstream Buyers
    1. 10.1. Magnesium Oxide Industrial Chain Analysis
    2. 10.2. Upstream Raw Materials Sourcing
      1. 10.2.1. Risk Mitigation:
      2. 10.2.2. Supplier Relationships:
      3. 10.2.3. Business Processes:
      4. 10.2.4. Securing the Product:
    3. 10.3. Raw Materials Sources of Magnesium Oxide Major Manufacturers
    4. 10.4. Downstream Buyers
    5. 10.5. Distributors/Traders List
  11. Chapter 11 Marketing Strategy Analysis, Distributors
    1. 11.1. Marketing Channel
    2. 11.2. Direct Marketing
    3. 11.3. Indirect Marketing
    4. 11.4. Marketing Channel Development Trends
    5. 11.5. Economic/Political Environmental Change
  12. Chapter 12 Report Conclusion & Key Insights
    1. 12.1. Key Insights from Primary Interviews & Surveys Respondents
    2. 12.2. Key Takeaways from Analysts, Consultants, and Industry Leaders
  13. Chapter 13 Research Approach & Methodology
    1. 13.1. Report Description
    2. 13.2. Research Scope
    3. 13.3. Research Methodology
      1. 13.3.1. Secondary Research
      2. 13.3.2. Primary Research
      3. 13.3.3. Statistical Models
        1. 13.3.3.1. Company Share Analysis Model
        2. 13.3.3.2. Revenue Based Modeling
      4. 13.3.4. Research Limitations

      List of Figures

      Fig.1 Product Picture of Magnesium Oxide
      Fig.2 Global Magnesium Oxide Market, 2016 – 2026 (USD Million)
      Fig.3 Global Magnesium Oxide Market, 2016 – 2026 (Tons)
      Fig.4 Global Magnesium Oxide Market Absolute Revenue Opportunity, 2016 – 2026 (USD Million)
      Fig.5 Global Magnesium Oxide Market Incremental Revenue Opportunity, 2020 – 2026 (USD Million)
      Fig.6 Global Magnesium Oxide Market Share, by Type, 2019 & 2026 (USD Million)
      Fig.7 Global Magnesium Oxide Market Share, by Type, 2019 & 2026 (Tons)
      Fig.8 Global Light Burned Magnesium Oxide Magnesium Oxide Market, 2016 – 2026 (USD Million)
      Fig.9 Global Light Burned Magnesium Oxide Magnesium Oxide Market, 2016 – 2026 (Tons)
      Fig.10 Global Hard Burned Magnesium Oxide Magnesium Oxide Market, 2016 – 2026 (USD Million)
      Fig.11 Global Hard Burned Magnesium Oxide Magnesium Oxide Market, 2016 – 2026 (Tons)
      Fig.12 Global Dead Burned Magnesium Oxide Magnesium Oxide Market, 2016 – 2026 (USD Million)
      Fig.13 Global Dead Burned Magnesium Oxide Magnesium Oxide Market, 2016 – 2026 (Tons)
      Fig.14 Global Magnesium Oxide Market Share, by Application, 2019 & 2026 (USD Million)
      Fig.15 Global Magnesium Oxide Market Share, by Application, 2019 & 2026 (Tons)
      Fig.16 Global Refractories Industry Magnesium Oxide Market, 2016 – 2026 (USD Million)
      Fig.17 Global Refractories Industry Magnesium Oxide Market, 2016 – 2026 (Tons)
      Fig.18 Global Agriculture Industry Magnesium Oxide Market, 2016 – 2026 (USD Million)
      Fig.19 Global Agriculture Industry Magnesium Oxide Market, 2016 – 2026 (Tons)
      Fig.20 Global Chemical Intermediates Magnesium Oxide Market, 2016 – 2026 (USD Million)
      Fig.21 Global Chemical Intermediates Magnesium Oxide Market, 2016 – 2026 (Tons)
      Fig.22 Global Construction Industry Magnesium Oxide Market, 2016 – 2026 (USD Million)
      Fig.23 Global Construction Industry Magnesium Oxide Market, 2016 – 2026 (Tons)
      Fig.24 Global Others Magnesium Oxide Market, 2016 – 2026 (USD Million)
      Fig.25 Global Others Magnesium Oxide Market, 2016 – 2026 (Tons)
      Fig.26 Global Magnesium Oxide Market Share, by Region, 2019 & 2026 (USD Million)
      Fig.27 Global Magnesium Oxide Market Share, by Region, 2019 & 2026 (Tons)
      Fig.28 North America Magnesium Oxide Market, 2016 – 2026 (USD Million)
      Fig.29 North America Magnesium Oxide Market, 2016 – 2026 (Tons)
      Fig.30 U.S. Magnesium Oxide Market, 2016 – 2026 (USD Million)
      Fig.31 U.S. Magnesium Oxide  Market, 2016 – 2026 (Tons)
      Fig.32 Canada Magnesium Oxide Market, 2016 – 2026 (USD Million)
      Fig.33 Canada Magnesium Oxide  Market, 2016 – 2026 (Tons)
      Fig.34 Europe Magnesium Oxide Market, 2016 – 2026 (USD Million)
      Fig.35 Europe Magnesium Oxide Market, 2016 – 2026 (Tons)
      Fig.36 Germany Magnesium Oxide Market, 2016 – 2026 (USD Million)
      Fig.37 Germany Magnesium Oxide  Market, 2016 – 2026 (Tons)
      Fig.38 France Magnesium Oxide Market, 2016 – 2026 (USD Million)
      Fig.39 France Magnesium Oxide  Market, 2016 – 2026 (Tons)
      Fig.40 U.K. Magnesium Oxide Market, 2016 – 2026 (USD Million)
      Fig.41 U.K. Magnesium Oxide  Market, 2016 – 2026 (Tons)
      Fig.42 Italy Magnesium Oxide Market, 2016 – 2026 (USD Million)
      Fig.43 Italy Magnesium Oxide  Market, 2016 – 2026 (Tons)
      Fig.44 Spain Magnesium Oxide Market, 2016 – 2026 (USD Million)
      Fig.45 Spain Magnesium Oxide  Market, 2016 – 2026 (Tons)
      Fig.46 Rest of Europe Magnesium Oxide Market, 2016 – 2026 (USD Million)
      Fig.47 Rest of Europe Magnesium Oxide  Market, 2016 – 2026 (Tons)
      Fig.48 Asia Pacific Magnesium Oxide Market, 2016 – 2026 (USD Million)
      Fig.49 Asia Pacific Magnesium Oxide Market, 2016 – 2026 (Tons)
      Fig.50 China Magnesium Oxide Market, 2016 – 2026 (USD Million)
      Fig.51 China Magnesium Oxide  Market, 2016 – 2026 (Tons)
      Fig.52 Japan Magnesium Oxide Market, 2016 – 2026 (USD Million)
      Fig.53 Japan Magnesium Oxide  Market, 2016 – 2026 (Tons)
      Fig.54 India Magnesium Oxide Market, 2016 – 2026 (USD Million)
      Fig.55 India Magnesium Oxide  Market, 2016 – 2026 (Tons)
      Fig.56 South  Korea Magnesium Oxide Market, 2016 – 2026 (USD Million)
      Fig.57 South  Korea Magnesium Oxide  Market, 2016 – 2026 (Tons)
      Fig.58 South-East Asia Magnesium Oxide Market, 2016 – 2026 (USD Million)
      Fig.59 South-East Asia Magnesium Oxide  Market, 2016 – 2026 (Tons)
      Fig.60 Rest of Asia Pacific Magnesium Oxide Market, 2016 – 2026 (USD Million)
      Fig.61 Rest of Asia Pacific Magnesium Oxide  Market, 2016 – 2026 (Tons)
      Fig.62 Latin America Magnesium Oxide Market, 2016 – 2026 (USD Million)
      Fig.63 Latin America Magnesium Oxide Market, 2016 – 2026 (Tons)
      Fig.64 Brazil Magnesium Oxide Market, 2016 – 2026 (USD Million)
      Fig.65 Brazil Magnesium Oxide  Market, 2016 – 2026 (Tons)
      Fig.66 Mexico Magnesium Oxide Market, 2016 – 2026 (USD Million)
      Fig.67 Mexico Magnesium Oxide  Market, 2016 – 2026 (Tons)
      Fig.68 Rest of Latin America Magnesium Oxide Market, 2016 – 2026 (USD Million)
      Fig.69 Rest of Latin America Magnesium Oxide  Market, 2016 – 2026 (Tons)
      Fig.70 The Middle-East and Africa Magnesium Oxide Market, 2016 – 2026 (USD Million)
      Fig.71 The Middle-East and Africa Magnesium Oxide Market, 2016 – 2026 (Tons)
      Fig.72 GCC Countries Magnesium Oxide Market, 2016 – 2026 (USD Million)
      Fig.73 GCC Countries Magnesium Oxide  Market, 2016 – 2026 (Tons)
      Fig.74 South Africa Magnesium Oxide Market, 2016 – 2026 (USD Million)
      Fig.75 South Africa Magnesium Oxide  Market, 2016 – 2026 (Tons)
      Fig.76 Rest of Middle-East Africa Magnesium Oxide Market, 2016 – 2026 (USD Million)
      Fig.77 Rest of Middle-East Africa Magnesium Oxide  Market, 2016 – 2026 (Tons)
      Fig.78 Global Magnesium Oxide Production and Consumption, 2016 – 2026 (Tons)
      Fig.79 North America Magnesium Oxide Production and Consumption, 2016 – 2026 (USD Million) (Tons)
      Fig.80 Europe Magnesium Oxide Production and Consumption, 2016 – 2026 (USD Million) (Tons)
      Fig.81 Asia Pacific Magnesium Oxide Production and Consumption, 2016 – 2026 (USD Million) (Tons)
      Fig.82 Latin America Magnesium Oxide Production and Consumption, 2016 – 2026 (USD Million) (Tons)
      Fig.83 The Middle-East and Africa Magnesium Oxide Production and Consumption, 2016 – 2026 (USD Million) (Tons)
      Fig.84 Competitor Market Share – Revenue
      Fig.85 Competitor Market Share – Volume
      Fig.86 RHI Magnesita N.V. Revenue and Growth Rate
      Fig.87 RHI Magnesita N.V. Market Share
      Fig.88 Martin Marietta Revenue and Growth Rate
      Fig.89 Martin Marietta Market Share
      Fig.90 Grecian Magnesite S.A. Revenue and Growth Rate
      Fig.91 Grecian Magnesite S.A. Market Share
      Fig.92 PremierMagnesia LLC Revenue and Growth Rate
      Fig.93 PremierMagnesia LLC Market Share
      Fig.94 Ube Industries Ltd Revenue and Growth Rate
      Fig.95 Ube Industries Ltd Market Share
      Fig.96 Kumas Magnesite Industry Inc Revenue and Growth Rate
      Fig.97 Kumas Magnesite Industry Inc Market Share
      Fig.98 Xinyang Mineral Group Revenue and Growth Rate
      Fig.99 Xinyang Mineral Group Market Share
      Fig.100 ICL Revenue and Growth Rate
      Fig.101 ICL Market Share
      Fig.102 SMZ, a.s. Jelsava Revenue and Growth Rate
      Fig.103 SMZ, a.s. Jelsava Market Share
      Fig.104 Tateho Chemicals Industries Co. Revenue and Growth Rate
      Fig.105 Tateho Chemicals Industries Co. Market Share
      Fig.106 Baymag Inc Revenue and Growth Rate
      Fig.107 Baymag Inc Market Share
      Fig.108 Others Revenue and Growth Rate
      Fig.109 Others Market Share
      Fig.110 Market Dynamics
      Fig.111 Global Magnesium Oxide – Value Chain Analysis
      Fig.112 Key Mandates and Regulations
      Fig.113 Technology Roadmap and Timeline
      Fig.114 Market Attractiveness Analysis – By Type
      Fig.115 Market Attractiveness Analysis – By Application
      Fig.116 Market Attractiveness Analysis – By Region
      Fig.117 Manufacturing Cost Structure of Magnesium Oxide
      Fig.118 Magnesium Oxide Industrial Chain Analysis
      Fig.119 Market Channels
      Fig.120 Marketing Channel Development Trend
      Fig.121 Growth in World Gross Product, 2008-2018
      

      List of Tables

      Table 1 Global Magnesium Oxide Market, 2019 & 2026 (USD Million)
      Table 2 Global Magnesium Oxide Market, by Type, 2016 – 2026 (USD Million)
      Table 3 Global Magnesium Oxide Market, by Type, 2016 – 2026 (Tons)
      Table 4 Global Magnesium Oxide Market, by Application, 2016 – 2026 (USD Million)
      Table 5 Global Magnesium Oxide Market, by Application, 2016 – 2026 (Tons)
      Table 6 Global Magnesium Oxide Market, by Region, 2016 – 2026 (USD Million)
      Table 7 Global Magnesium Oxide Market, by Region, 2016 – 2026 (Tons)
      Table 8 North America Magnesium Oxide Market, by Country, 2016 – 2026 (USD Million)
      Table 9 North America Magnesium Oxide Market, by Country, 2016 – 2026 (Tons)
      Table 10 North America Magnesium Oxide Market, by Type, 2016 – 2026 (USD Million)
      Table 11 North America Magnesium Oxide Market, by Type, 2016 – 2026 (Tons)
      Table 12 North America Magnesium Oxide Market, by Application, 2016 – 2026 (USD Million)
      Table 13 North America Magnesium Oxide Market, by Application, 2016 – 2026 (Tons)
      Table 14 Europe Magnesium Oxide Market, by Country, 2016 – 2026 (USD Million)
      Table 15 Europe Magnesium Oxide Market, by Country, 2016 – 2026 (Tons)
      Table 16 Europe Magnesium Oxide Market, by Type, 2016 – 2026 (USD Million)
      Table 17 Europe Magnesium Oxide Market, by Type, 2016 – 2026 (Tons)
      Table 18 Europe Magnesium Oxide Market, by Application, 2016 – 2026 (USD Million)
      Table 19 Europe Magnesium Oxide Market, by Application, 2016 – 2026 (Tons)
      Table 20 Asia Pacific Magnesium Oxide Market, by Country, 2016 – 2026 (USD Million)
      Table 21 Asia Pacific Magnesium Oxide Market, by Country, 2016 – 2026 (Tons)
      Table 22 Asia Pacific Magnesium Oxide Market, by Type, 2016 – 2026 (USD Million)
      Table 23 Asia Pacific Magnesium Oxide Market, by Type, 2016 – 2026 (Tons)
      Table 24 Asia Pacific Magnesium Oxide Market, by Application, 2016 – 2026 (USD Million)
      Table 25 Asia Pacific Magnesium Oxide Market, by Application, 2016 – 2026 (Tons)
      Table 26 Latin America Magnesium Oxide Market, by Country, 2016 – 2026 (USD Million)
      Table 27 Latin America Magnesium Oxide Market, by Country, 2016 – 2026 (Tons)
      Table 28 Latin America Magnesium Oxide Market, by Type, 2016 – 2026 (USD Million)
      Table 29 Latin America Magnesium Oxide Market, by Type, 2016 – 2026 (Tons)
      Table 30 Latin America Magnesium Oxide Market, by Application, 2016 – 2026 (USD Million)
      Table 31 Latin America Magnesium Oxide Market, by Application, 2016 – 2026 (Tons)
      Table 32 The Middle-East and Africa Magnesium Oxide Market, by Country, 2016 – 2026 (USD Million)
      Table 33 The Middle-East and Africa Magnesium Oxide Market, by Country, 2016 – 2026 (Tons)
      Table 34 The Middle-East and Africa Magnesium Oxide Market, by Type, 2016 – 2026 (USD Million)
      Table 35 The Middle-East and Africa Magnesium Oxide Market, by Type, 2016 – 2026 (Tons)
      Table 36 The Middle-East and Africa Magnesium Oxide Market, by Application, 2016 – 2026 (USD Million)
      Table 37 The Middle-East and Africa Magnesium Oxide Market, by Application, 2016 – 2026 (Tons)
      Table 38 North America Magnesium Oxide Production, Consumption, Export, Import, 2016 – 2019
      Table 39 Europe Magnesium Oxide Production, Consumption, Export, Import, 2016 – 2019
      Table 40 Asia Pacific Magnesium Oxide Production, Consumption, Export, Import, 2016 – 2019
      Table 41 Latin America Magnesium Oxide Production, Consumption, Export, Import, 2016 – 2019
      Table 42 The Middle-East and Africa Magnesium Oxide Production, Consumption, Export, Import, 2016 – 2019
      Table 43 Global Magnesium Oxide Market - Company Revenue Analysis, 2016 – 2019 (USD Million)
      Table 44 Global Magnesium Oxide Market - Company Revenue Share Analysis, 2016 – 2019 (%)
      Table 45 Global Magnesium Oxide Market - Company Volume Analysis, 2016 – 2019 (Tons)
      Table 46 Global Magnesium Oxide Market - Company Volume Share Analysis, 2016 – 2019 (%)
      Table 47 Acquisitions and Mergers
      Table 48 Market Drivers – Impact Analysis
      Table 49 Market Restraints
      Table 50 Market Opportunities
      Table 51 Production Base and Market Concentration Rate of Raw Material
      Table 52 Key Suppliers of Raw Materials
      Table 53 Raw Materials Sources of Magnesium Oxide Major Manufacturers
      Table 54 Major Buyers of Magnesium Oxide
      Table 55 Distributors/Traders of Magnesium Oxide by Region
      

Industry Major Market Players

  • RHI Magnesita N.V.
  • Martin Marietta
  • Grecian Magnesite S.A.
  • PremierMagnesia LLC
  • Ube Industries Ltd
  • KumasMagnesite Industry Inc
  • Xinyang Mineral Group
  • ICL
  • SMZ
  • a.s. Jelsava
  • Tateho Chemicals Industries Co.
  • Baymag Inc