Search Market Research Report

Discover Our Latest Reports
Discover Our Featured Reports
Discover Top Selling Reports

Lubricants Market Size, Share Global Analysis Report, 2020–2026

report img

Lubricants Market By Base Oil (Mineral Oil, Synthetic Oil, and Bio-based Oil), By Product Type (Engine Oil, Hydraulic fluid, Metalworking fluid, Gear Oil, Compressor oil, Grease Oil, Turbine Oil, and Others) and By Application (Transportation, and Industrial): Global Industry Outlook, Market Size, Business Intelligence, Consumer Preferences, Statistical Surveys, Comprehensive Analysis, Historical Developments, Current Trends, and Forecast 2020–2026

Industry Insights

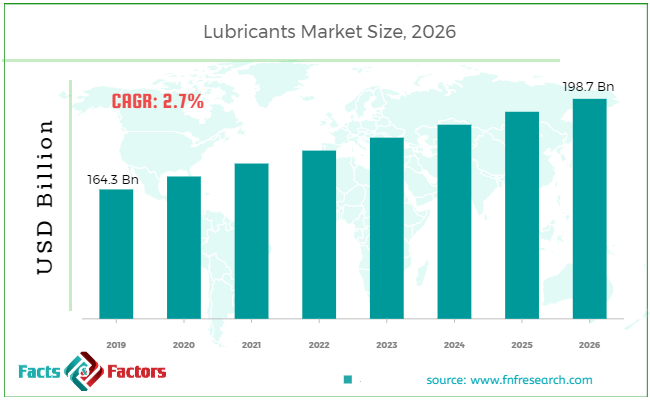
[174+ Pages Report] According to the report published by Facts Factors, the global lubricants market size was worth around USD 164.3 billion in 2019 and is predicted to grow to around USD 198.7 billion by 2026 with a compound annual growth rate (CAGR) of roughly 2.7% between 2020 and 2026. The report analyzes the global lubricants market drivers, restraints/challenges, and the effect they have on the demands during the projection period. In addition, the report explores emerging opportunities in the lubricants market.

Lubricants Market Size

To know more about this report | Request Free Sample Copy

This specialized and expertise oriented industry research report scrutinizes the technical and commercial business outlook of the lubricants industry. The report analyzes and declares the historical and current trends analysis of the lubricants industry and subsequently recommends the projected trends anticipated to be observed in the lubricants market during the upcoming years.

The lubricants market report analyzes and notifies the industry statistics at the global as well as regional and country levels in order to acquire a thorough perspective of the entire lubricants market. The historical and past insights are provided for FY 2016 to FY 2019 whereas projected trends are delivered for FY 2020 to FY 2026. The quantitative and numerical data is represented in terms of both volume (Units) and value (USD Million) from FY 2016 – 2026.


logoKey Insights from Primary Research

  • As per our primary respondents, the global lubricants market is set to grow annually at a rate of around 2.7%
  • It was established through primary research that the lubricants market was valued at around USD 14.3 Billion in 2019.
  • North America region is presently dominating the market among all the regions and is further expected to maintain its position throughout the forecast period.
  • On basis of base oil segment, ‘mineral oil’ segment dominated the global lubricants market in 2019.
  • Based on product segment, the engine oil segment is leading the global lubricants market owing to its increasing usage in transportation sector.

logoKey Recommendations from Analysts

  • As per our analysts, the global lubricants market is expected to reach around USD 198 Billion by 2026.
  • The strategic and competitive advantage provided by the lubricants is anticipated to increase the market demand in upcoming years.
  • Our team of analysts has identified, that increase in the number of production of both commercial and passenger vehicles is driving the global lubricants market.
  • The team has analyzed that growing industrialization has led the industrial application segment in global lubricants market.
  • In future years ahead, Asia Pacific is anticipated to be the fastest growing market for lubricants during the years to come owing to overall development in this region will aid the market to grow rapidly.

The quantitative data is further underlined and reinforced by comprehensive qualitative data which comprises various across-the-board market dynamics. The rationales which directly or indirectly impact the lubricants industry are exemplified through parameters such as growth drivers, restraints, challenges, and opportunities among other impacting factors.

Throughout our research report, we have encompassed all the proven models and tools of industry analysis and extensively illustrated all the key business strategies and business models adopted in the lubricants industry. The report provides an all-inclusive and detailed competitive landscape prevalent in the lubricants market.

The report utilizes established industry analysis tools and models such as Porter’s Five Forces framework to analyze and recognize critical business strategies adopted by various stakeholders involved in the entire value chain of the lubricants industry. The lubricants market report additionally employs SWOT analysis and PESTLE analysis models for further in-depth analysis.

The report study further includes an in-depth analysis of industry players' market shares and provides an overview of leading players' market position in the Lubricants sector. Key strategic developments in the lubricants market competitive landscape such as acquisitions & mergers, inaugurations of different products and services, partnerships & joint ventures, MoU agreements, VC & funding activities, R&D activities, and geographic expansion among other noteworthy activities by key players of the lubricants market are appropriately highlighted in the report.

The growing automotive industry is significantly increasing the demand of lubricants. Rise in production of vehicles in developing economies such as China, India and Indonesia will demand high for lubricants. Moreover, in power generation sector, lubricants are highly required for improving operability. These lubricants are widely used in industries that include chemical, textile, infrastructure, and energy sectors. The continuous research and development for the biological counterparts of the product by reducing the environmental impact is boosting the lubricants market. In addition, growing importance for trade and passenger travel is expected to drive the demand for marine lubricants. Moreover, power generation by using wind turbines is anticipated to raise the sales of lubricants in near future.

The lubricants market research report delivers an acute valuation and taxonomy of the lubricants industry by practically splitting the market on the basis of different types, applications, and regions. Through the analysis of the historical and projected trends, all the segments and sub-segments were evaluated through the bottom-up approach, and different market sizes have been projected for FY 2020 to FY 2026. The regional segmentation of the lubricants industry includes the complete classification of all the major continents including North America, Latin America, Europe, Asia Pacific, and Middle East & Africa. Further, country-wise data for the lubricants industry is provided for the leading economies of the world.

The lubricants market is segmented based on base oil, product type and application. On the basis of base oil segmentation, the market is classified into mineral oil, synthetic oil, and bio-based oil. In terms of product type segmentation, the market is bifurcated into engine oil, hydraulic fluid, metalworking fluid, gear oil, compressor oil, grease oil, turbine oil, and others. In terms of application segmentation, the market is bifurcated into transportation, and industrial. The transportation segment is sub-segmented into commercial vehicles, passenger vehicles, aviation, railways, and marine. The industrial segment is also further fragmented into construction & mining, metal production, cement production, power generation, automotive, chemical, oil & gas, textile, and food processing amongst others.

logoReport Scope

Report Attribute

Details

Market Size in 2019

USD 164.3 Billion

Projected Market Size in 2026

USD 198.7 Billion

CAGR Growth Rate

2.7% CAGR

Base Year

2019

Forecast Years

2019-2026

Key Market Players

Royal Dutch Shell Plc., ExxonMobil Corporation, Chevron Corporation, BP p.l.c., Total S.A., Petrochina Company Limited, Sinopec Limited, LUKOIL, Fuchs Petrolub AG, and Idemitsu Kosan Co. Ltd. among others.

Key Segment

By Application, By Region

Major Regions Covered

North America, Europe, Asia Pacific, Latin America, and the Middle East & Africa

Purchase Options

Request customized purchase options to meet your research needs. Explore purchase options

logoSome of the essential players operating in the lubricants market, but not restricted to include

  • Royal Dutch Shell Plc.
  • ExxonMobil Corporation
  • Chevron Corporation
  • BP p.l.c.
  • Total S.A.
  • Petrochina Company Limited
  • Sinopec Limited
  • LUKOIL
  • Fuchs Petrolub AG
  • Idemitsu Kosan Co. Ltd. 

The taxonomy of the lubricants industry by its scope and segmentation is as follows:

logoBy Base Oil Segmentation Analysis

  • Mineral Oil
  • Synthetic Oil
  • Bio-based Oil

logoBy Product Type Segmentation Analysis

  • Engine Oil
  • Hydraulic fluid
  • Metalworking fluid
  • Gear Oil
  • Compressor oil
  • Grease Oil
  • Turbine Oil
  • Others
    • Transformer Oil
    • Refrigeration Oil
    • Textile Machinery Lubricants

logoBy Product Type Segmentation Analysis

  • Transportation
    • Commercial vehicles
    • Passenger vehicles
    • Aviation
    • Railways
    • Marine
  • Industrial
    • Construction & Mining
    • Metal Production
    • Cement Production
    • Power Generation
    • Automotive (Vehicle Manufacturing)
    • Chemical
    • Oil & Gas
    • Textile
    • Food Processing
    • Others

logoBy Regional Segmentation Analysis

  • North America
    • The U.S.
    • Canada
  • Europe
    • Germany
    • The UK
    • France
    • Spain
    • Italy
    • Rest of Europe
  • Asia Pacific
    • China
    • Japan
    • India
    • South Korea
    • Southeast Asia
    • Rest of Asia Pacific
  • Latin America
    • Brazil
    • Mexico
    • Rest of Latin America
  • Middle East & Africa
    • GCC
    • South Africa
    • Rest of Middle East & Africa

Table of Content

  1. CHAPTER 1. Executive Summary
  2. CHAPTER 2. lubricants market – Base Oil Analysis
    1. 2.1. Global Lubricants Market – Base Oil Overview
    2. 2.2. Global Lubricants Market Share, by Base Oil, 2018 & 2025 (USD Million)
    3. 2.3. Global Lubricants Market share, by Base Oil, 2018 & 2025 (Kilo Tons)
    4. 2.4. Mineral Oil
      1. 2.4.1. Global Mineral Oil Lubricants Market, 2016-2026 (USD Million)
      2. 2.4.2. Global Mineral Oil Lubricants Market, 2016-2026 (Kilo Tons)
    5. 2.5. Synthetic Oil
      1. 2.5.1. Global Synthetic Oil Lubricants Market, 2016-2026 (USD Million)
      2. 2.5.2. Global Synthetic Oil Lubricants Market, 2016-2026 (Kilo Tons)
    6. 2.6. Bio-based Oil
      1. 2.6.1. Global Bio-based Oil Lubricants Market, 2016-2026 (USD Million)
      2. 2.6.2. Global Bio-based Oil Lubricants Market, 2016-2026 (Kilo Tons)
  3. CHAPTER 3. lubricants market – Product Type Analysis
    1. 3.1. Global Lubricants Market – Product Type Overview
    2. 3.2. Global Lubricants Market Share, by Product Type, 2018 & 2025 (USD Million)
    3. 3.3. Global Lubricants Market share, by Product Type, 2018 & 2025 (Kilo Tons)
    4. 3.4. Engine Oil
      1. 3.4.1. Global Engine Oil Lubricants Market, 2016-2026 (USD Million)
      2. 3.4.2. Global Engine Oil Lubricants Market, 2016-2026 (Kilo Tons)
    5. 3.5. Hydraulic fluid
      1. 3.5.1. Global Hydraulic fluid Lubricants Market, 2016-2026 (USD Million)
      2. 3.5.2. Global Hydraulic fluid Lubricants Market, 2016-2026 (Kilo Tons)
    6. 3.6. Metalworking fluid
      1. 3.6.1. Global Metalworking fluid Lubricants Market, 2016-2026 (USD Million)
      2. 3.6.2. Global Metalworking fluid Lubricants Market, 2016-2026 (Kilo Tons)
    7. 3.7. Gear Oil
      1. 3.7.1. Global Gear Oil Lubricants Market, 2016-2026 (USD Million)
      2. 3.7.2. Global Gear Oil Lubricants Market, 2016-2026 (Kilo Tons)
    8. 3.8. Compressor Oil
      1. 3.8.1. Global Compressor Oil Lubricants Market, 2016-2026 (USD Million)
      2. 3.8.2. Global Compressor Oil Lubricants Market, 2016-2026 (Kilo Tons)
    9. 3.9. Grease Oil
      1. 3.9.1. Global Grease Oil Lubricants Market, 2016-2026 (USD Million)
      2. 3.9.2. Global Grease Oil Lubricants Market, 2016-2026 (Kilo Tons)
    10. 3.10. Turbine Oil
      1. 3.10.1. Global Turbine Oil Lubricants Market, 2016-2026 (USD Million)
      2. 3.10.2. Global Turbine Oil Lubricants Market, 2016-2026 (Kilo Tons)
    11. 3.11. Others
      1. 3.11.1. Global Others Lubricants Market, 2016-2026 (USD Million)
      2. 3.11.2. Global Others Lubricants Market, 2016-2026 (Kilo Tons)
  4. CHAPTER 4. lubricants market – Application Analysis
    1. 4.1. Global Lubricants Market – Application Overview
    2. 4.2. Global Lubricants Market Share, by Application, 2018 & 2025 (USD Million)
    3. 4.3. Global Lubricants Market share, by Application, 2018 & 2025 (Kilo Tons)
    4. 4.4. Transportation
      1. 4.4.1. Global Transportation Lubricants Market, 2016-2026 (USD Million)
      2. 4.4.2. Global Transportation Lubricants Market, 2016-2026 (Kilo Tons)
    5. 4.5. Industrial
      1. 4.5.1. Global Industrial Lubricants Market, 2016-2026 (USD Million)
      2. 4.5.2. Global Industrial Lubricants Market, 2016-2026 (Kilo Tons)
  5. CHAPTER 5. lubricants market – Regional Analysis
    1. 5.1. Global Lubricants Market Regional Overview
    2. 5.2. Global Lubricants Market Share, by Region, 2018 & 2025 (Value)
    3. 5.3. Global Lubricants Market Share, by Region, 2018 & 2025 (Volume)
    4. 5.4. North America
      1. 5.4.1. North America Lubricants Market size and forecast, 2016-2026
      2. 5.4.2. North America Lubricants Market, by Country, 2018 - 2025 (USD Million)
      3. 5.4.3. North America Market size and forecast, 2016-2026 (Kilo Tons)
      4. 5.4.4. North America Lubricants Market, by Country, 2018 - 2025 (Kilo Tons)
      5. 5.4.5. North America Lubricants Market, by Base Oil, 2016-2026
        1. 5.4.5.1. North America Lubricants Market, by Base Oil, 2016-2026 (USD Million)
        2. 5.4.5.2. North America Lubricants Market, by Base Oil, 2016-2026 (Kilo Tons)
      6. 5.4.6. North America Lubricants Market, by Product Type, 2016-2026
        1. 5.4.6.1. North America Lubricants Market, by Product Type, 2016-2026 (USD Million)
        2. 5.4.6.2. North America Lubricants Market, by Product Type, 2016-2026 (Kilo Tons)
      7. 5.4.7. North America Lubricants Market, by Application, 2016-2026
        1. 5.4.7.1. North America Lubricants Market, by Application, 2016-2026 (USD Million)
        2. 5.4.7.2. North America Lubricants Market, by Application, 2016-2026 (Kilo Tons)
      8. 5.4.8. U.S.
        1. 5.4.8.1. U.S. Market size and forecast, 2016-2026 (USD Million)
        2. 5.4.8.2. U.S. Market size and forecast, 2016-2026 (Kilo Tons)
      9. 5.4.9. Canada
        1. 5.4.9.1. Canada Market size and forecast, 2016-2026 (USD Million)
        2. 5.4.9.2. Canada Market size and forecast, 2016-2026 (Kilo Tons)
    5. 5.5. Europe
      1. 5.5.1. Europe Lubricants Market size and forecast, 2016-2026
      2. 5.5.2. Europe Lubricants Market, by Country, 2018 - 2025 (USD Million)
      3. 5.5.3. Europe Market size and forecast, 2016-2026 (Kilo Tons)
      4. 5.5.4. Europe Lubricants Market, by Country, 2018 - 2025 (Kilo Tons)
      5. 5.5.5. Europe Lubricants Market, by Base Oil, 2016-2026
        1. 5.5.5.1. Europe Lubricants Market, by Base Oil, 2016-2026 (USD Million)
        2. 5.5.5.2. Europe Lubricants Market, by Base Oil, 2016-2026 (Kilo Tons)
      6. 5.5.6. Europe Lubricants Market, by Product Type, 2016-2026
        1. 5.5.6.1. Europe Lubricants Market, by Product Type, 2016-2026 (USD Million)
        2. 5.5.6.2. Europe Lubricants Market, by Product Type, 2016-2026 (Kilo Tons)
      7. 5.5.7. Europe Lubricants Market, by Application, 2016-2026
        1. 5.5.7.1. Europe Lubricants Market, by Application, 2016-2026 (USD Million)
        2. 5.5.7.2. Europe Lubricants Market, by Application, 2016-2026 (Kilo Tons)
      8. 5.5.8. Germany
        1. 5.5.8.1. Germany Market size and forecast, 2016-2026 (USD Million)
        2. 5.5.8.2. Germany Market size and forecast, 2016-2026 (Kilo Tons)
      9. 5.5.9. France
        1. 5.5.9.1. France Market size and forecast, 2016-2026 (USD Million)
        2. 5.5.9.2. France Market size and forecast, 2016-2026 (Kilo Tons)
      10. 5.5.10. U.K.
        1. 5.5.10.1. U.K. Market size and forecast, 2016-2026 (USD Million)
        2. 5.5.10.2. U.K. Market size and forecast, 2016-2026 (Kilo Tons)
      11. 5.5.11. Italy
        1. 5.5.11.1. Italy Market size and forecast, 2016-2026 (USD Million)
        2. 5.5.11.2. Italy Market size and forecast, 2016-2026 (Kilo Tons)
      12. 5.5.12. Spain
        1. 5.5.12.1. Spain Market size and forecast, 2016-2026 (USD Million)
        2. 5.5.12.2. Spain Market size and forecast, 2016-2026 (Kilo Tons)
      13. 5.5.13. Rest of Europe
        1. 5.5.13.1. Rest of Europe Market size and forecast, 2016-2026 (USD Million)
        2. 5.5.13.2. Rest of Europe Market size and forecast, 2016-2026 (Kilo Tons)
    6. 5.6. Asia Pacific
      1. 5.6.1. Asia Pacific Lubricants Market size and forecast, 2016-2026
      2. 5.6.2. Asia Pacific Lubricants Market, by Country, 2018 - 2025 (USD Million)
      3. 5.6.3. Asia Pacific Market size and forecast, 2016-2026 (Kilo Tons)
      4. 5.6.4. Asia Pacific Lubricants Market, by Country, 2018 - 2025 (Kilo Tons)
      5. 5.6.5. Asia Pacific Lubricants Market, by Base Oil, 2016-2026
        1. 5.6.5.1. Asia Pacific Lubricants Market, by Base Oil, 2016-2026 (USD Million)
        2. 5.6.5.2. Asia Pacific Lubricants Market, by Base Oil, 2016-2026 (Kilo Tons)
      6. 5.6.6. Asia Pacific Lubricants Market, by Product Type, 2016-2026
        1. 5.6.6.1. Asia Pacific Lubricants Market, by Product Type, 2016-2026 (USD Million)
        2. 5.6.6.2. Asia Pacific Lubricants Market, by Product Type, 2016-2026 (Kilo Tons)
      7. 5.6.7. Asia Pacific Lubricants Market, by Application, 2016-2026
        1. 5.6.7.1. Asia Pacific Lubricants Market, by Application, 2016-2026 (USD Million)
        2. 5.6.7.2. Asia Pacific Lubricants Market, by Application, 2016-2026 (Kilo Tons)
      8. 5.6.8. China
        1. 5.6.8.1. China Market size and forecast, 2016-2026 (USD Million)
        2. 5.6.8.2. China Market size and forecast, 2016-2026 (Kilo Tons)
      9. 5.6.9. Japan
        1. 5.6.9.1. Japan Market size and forecast, 2016-2026 (USD Million)
        2. 5.6.9.2. Japan Market size and forecast, 2016-2026 (Kilo Tons)
      10. 5.6.10. India
        1. 5.6.10.1. India Market size and forecast, 2016-2026 (USD Million)
        2. 5.6.10.2. India Market size and forecast, 2016-2026 (Kilo Tons)
      11. 5.6.11. South Korea
        1. 5.6.11.1. South Korea Market size and forecast, 2016-2026 (USD Million)
        2. 5.6.11.2. South Korea Market size and forecast, 2016-2026 (Kilo Tons)
      12. 5.6.12. South-East Asia
        1. 5.6.12.1. South-East Asia Market size and forecast, 2016-2026 (USD Million)
        2. 5.6.12.2. South-East Asia Market size and forecast, 2016-2026 (Kilo Tons)
      13. 5.6.13. Rest of Asia Pacific
        1. 5.6.13.1. Rest of Asia Pacific Market size and forecast, 2016-2026 (USD Million)
        2. 5.6.13.2. Rest of Asia Pacific Market size and forecast, 2016-2026 (Kilo Tons)
    7. 5.7. Latin America
      1. 5.7.1. Latin America Lubricants Market size and forecast, 2016-2026
      2. 5.7.2. Latin America Lubricants Market, by Country, 2018 - 2025 (USD Million)
      3. 5.7.3. Latin America Market size and forecast, 2016-2026 (Kilo Tons)
      4. 5.7.4. Latin America Lubricants Market, by Country, 2018 - 2025 (Kilo Tons)
      5. 5.7.5. Latin America Lubricants Market, by Base Oil, 2016-2026
        1. 5.7.5.1. Latin America Lubricants Market, by Base Oil, 2016-2026 (USD Million)
        2. 5.7.5.2. Latin America Lubricants Market, by Base Oil, 2016-2026 (Kilo Tons)
      6. 5.7.6. Latin America Lubricants Market, by Product Type, 2016-2026
        1. 5.7.6.1. Latin America Lubricants Market, by Product Type, 2016-2026 (USD Million)
        2. 5.7.6.2. Latin America Lubricants Market, by Product Type, 2016-2026 (Kilo Tons)
      7. 5.7.7. Latin America Lubricants Market, by Application, 2016-2026
        1. 5.7.7.1. Latin America Lubricants Market, by Application, 2016-2026 (USD Million)
        2. 5.7.7.2. Latin America Lubricants Market, by Application, 2016-2026 (Kilo Tons)
      8. 5.7.8. Brazil
        1. 5.7.8.1. Brazil Market size and forecast, 2016-2026 (USD Million)
        2. 5.7.8.2. Brazil Market size and forecast, 2016-2026 (Kilo Tons)
      9. 5.7.9. Mexico
        1. 5.7.9.1. Mexico Market size and forecast, 2016-2026 (USD Million)
        2. 5.7.9.2. Mexico Market size and forecast, 2016-2026 (Kilo Tons)
      10. 5.7.10. Rest of Latin America
        1. 5.7.10.1. Rest of Latin America Market size and forecast, 2016-2026 (USD Million)
        2. 5.7.10.2. Rest of Latin America Market size and forecast, 2016-2026 (Kilo Tons)
    8. 5.8. The Middle-East and Africa
      1. 5.8.1. The Middle-East and Africa Lubricants Market size and forecast, 2016-2026
      2. 5.8.2. The Middle-East and Africa Lubricants Market, by Country, 2018 - 2025 (USD Million)
      3. 5.8.3. The Middle-East and Africa Market size and forecast, 2016-2026 (Kilo Tons)
      4. 5.8.4. The Middle-East and Africa Lubricants Market, by Country, 2018 - 2025 (Kilo Tons)
      5. 5.8.5. The Middle-East and Africa Lubricants Market, by Base Oil, 2016-2026
        1. 5.8.5.1. The Middle-East and Africa Lubricants Market, by Base Oil, 2016-2026 (USD Million)
        2. 5.8.5.2. The Middle-East and Africa Lubricants Market, by Base Oil, 2016-2026 (Kilo Tons)
      6. 5.8.6. The Middle-East and Africa Lubricants Market, by Product Type, 2016-2026
        1. 5.8.6.1. The Middle-East and Africa Lubricants Market, by Product Type, 2016-2026 (USD Million)
        2. 5.8.6.2. The Middle-East and Africa Lubricants Market, by Product Type, 2016-2026 (Kilo Tons)
      7. 5.8.7. The Middle-East and Africa Lubricants Market, by Application, 2016-2026
        1. 5.8.7.1. The Middle-East and Africa Lubricants Market, by Application, 2016-2026 (USD Million)
        2. 5.8.7.2. The Middle-East and Africa Lubricants Market, by Application, 2016-2026 (Kilo Tons)
      8. 5.8.8. GCC Countries
        1. 5.8.8.1. GCC Countries Market size and forecast, 2016-2026 (USD Million)
        2. 5.8.8.2. GCC Countries Market size and forecast, 2016-2026 (Kilo Tons)
      9. 5.8.9. South Africa
        1. 5.8.9.1. South Africa Market size and forecast, 2016-2026 (USD Million)
        2. 5.8.9.2. South Africa Market size and forecast, 2016-2026 (Kilo Tons)
      10. 5.8.10. Rest of Middle-East Africa
        1. 5.8.10.1. Rest of Middle-East Africa Market size and forecast, 2016-2026 (USD Million)
        2. 5.8.10.2. Rest of Middle-East Africa Market size and forecast, 2016-2026 (Kilo Tons)
  6. CHAPTER 6. Lubricants Production, Consumption, Export, Import by Regions
    1. 6.1. Global Lubricants production and revenue, 2015-2025 (USD Million) (Kilo Tons)
    2. 6.2. Global Import and Export Analysis, by Region
  7. CHAPTER 7. lubricants market – Competitive Landscape
    1. 7.1. Competitor Market Share – Revenue
    2. 7.2. Market Concentration Rate Analysis, Top 3 and Top 5 Players
    3. 7.3. Competitor Market Share – Volume
    4. 7.4. Strategic Development
      1. 7.4.1. Acquisitions and Mergers
      2. 7.4.2. New Products
      3. 7.4.3. Research & Development Activities
  8. CHAPTER 8. Company Profiles
    1. 8.1. Royal Dutch Shell Plc.
      1. 8.1.1. Company Overview
      2. 8.1.2. Royal Dutch Shell Plc. Sales, Revenue, Price, and Gross Margin
      3. 8.1.3. Product portfolio
      4. 8.1.4. Recent initiatives
    2. 8.2. ExxonMobil Corporation
      1. 8.2.1. Company Overview
      2. 8.2.2. ExxonMobil Corporation Sales, Revenue, Price, and Gross Margin
      3. 8.2.3. Product portfolio
      4. 8.2.4. Recent initiatives
    3. 8.3. Chevron Corporation
      1. 8.3.1. Company Overview
      2. 8.3.2. Chevron Corporation Sales, Revenue, Price, and Gross Margin
      3. 8.3.3. Product portfolio
      4. 8.3.4. Recent initiatives
    4. 8.4. BP p.l.c.
      1. 8.4.1. Company Overview
      2. 8.4.2. BP p.l.c. Sales, Revenue, Price, and Gross Margin
      3. 8.4.3. Product portfolio
      4. 8.4.4. Recent initiatives
    5. 8.5. Total S.A.
      1. 8.5.1. Company Overview
      2. 8.5.2. Total S.A. Sales, Revenue, Price, and Gross Margin
      3. 8.5.3. Product portfolio
      4. 8.5.4. Recent initiatives
    6. 8.6. Petrochina Company Limited
      1. 8.6.1. Company Overview
      2. 8.6.2. Petrochina Company Limited Sales, Revenue, Price, and Gross Margin
      3. 8.6.3. Product portfolio
      4. 8.6.4. Recent initiatives
    7. 8.7. Sinopec Limited
      1. 8.7.1. Company Overview
      2. 8.7.2. Sinopec Limited Sales, Revenue, Price, and Gross Margin
      3. 8.7.3. Product portfolio
      4. 8.7.4. Recent initiatives
    8. 8.8. LUKOIL
      1. 8.8.1. Company Overview
      2. 8.8.2. LUKOIL Sales, Revenue, Price, and Gross Margin
      3. 8.8.3. Product portfolio
      4. 8.8.4. Recent initiatives
    9. 8.9. Fuchs Petrolub AG
      1. 8.9.1. Company Overview
      2. 8.9.2. Fuchs Petrolub AG Sales, Revenue, Price, and Gross Margin
      3. 8.9.3. Product portfolio
      4. 8.9.4. Recent initiatives
    10. 8.10. Idemitsu Kosan Co. Ltd.
      1. 8.10.1. Company Overview
      2. 8.10.2. Idemitsu Kosan Co. Ltd. Sales, Revenue, Price, and Gross Margin
      3. 8.10.3. Product portfolio
      4. 8.10.4. Recent initiatives
  9. CHAPTER 9. Lubricants — Industry Analysis
    1. 9.1. Introduction and Taxonomy
    2. 9.2. Lubricants Market – Key Trends
      1. 9.2.1. Market Drivers
      2. 9.2.2. Market Restraints
      3. 9.2.3. Market Opportunities
    3. 9.3. Value Chain Analysis
    4. 9.4. Key Mandates and Regulations
    5. 9.5. Technology Roadmap and Timeline
    6. 9.6. lubricants market – Attractiveness Analysis
      1. 9.6.1. By Base Oil
      2. 9.6.2. By Product Type
      3. 9.6.3. By Application
      4. 9.6.4. By Region
  10. CHAPTER 10. Raw Material analysis
    1. 10.1. Lubricants Key Raw Material Analysis
      1. 10.1.1. Key Raw Materials
      2. 10.1.2. Price Trend of Key Raw Materials
    2. 10.2. Key Suppliers of Raw Materials
    3. 10.3. Proportion of Manufacturing Cost Structure
      1. 10.3.1. Raw Materials
      2. 10.3.2. Labor Cost
    4. 10.4. Manufacturing Expenses Analysis of Lubricants
  11. CHAPTER 11. Industrial Chain, Sourcing Strategy and Downstream Buyers
    1. 11.1. Lubricants Industrial Chain Analysis
    2. 11.2. Upstream Raw Materials Sourcing
      1. 11.2.1. Risk Mitigation:
      2. 11.2.2. Supplier Relationships:
      3. 11.2.3. Business Processes:
      4. 11.2.4. Securing the Product:
    3. 11.3. Raw Materials Sources of Lubricants Major Manufacturers in 2016
    4. 11.4. Downstream Buyers
    5. 11.5. Distributors/Traders List
  12. CHAPTER 12. Marketing Strategy Analysis, Distributors
    1. 12.1. Marketing Channel
    2. 12.2. Direct Marketing
    3. 12.3. Indirect Marketing
    4. 12.4. Marketing Channel Development Trend
    5. 12.5. Economic/Political Environmental Change
  13. CHAPTER 13. Report Conclusion
  14. CHAPTER 14. Research Approach & Methodology
    1. 14.1. Report Description
    2. 14.2. Research Scope
    3. 14.3. Research Methodology
      1. 14.3.1. Secondary Research
      2. 14.3.2. Primary Research
      3. 14.3.3. Models
        1. 14.3.3.1. Company Share Analysis Model
        2. 14.3.3.2. Revenue Based Modeling
        3. 14.3.3.3. Research Limitations

  • List of Figures

    FIG. 1 Global Lubricants Market, 2016-2026 (USD Million)
    FIG. 2 Global Lubricants Market Share, by Base Oil, 2018 & 2025 (USD Million)
    FIG. 3 Global Lubricants Market share, by Base Oil, 2018 & 2025 (Kilo Tons)
    FIG. 4 Global Mineral Oil Lubricants Market, 2016-2026 (USD Million)
    FIG. 5 Global Mineral Oil Lubricants  Market, 2016-2026 (Kilo Tons)
    FIG. 6 Global Synthetic Oil Lubricants Market, 2016-2026 (USD Million)
    FIG. 7 Global Synthetic Oil Lubricants  Market, 2016-2026 (Kilo Tons)
    FIG. 8 Global Bio-based Oil Lubricants Market, 2016-2026 (USD Million)
    FIG. 9 Global Bio-based Oil Lubricants  Market, 2016-2026 (Kilo Tons)
    FIG. 10 Global Lubricants Market Share, by Product Type, 2018 & 2025 (USD Million)
    FIG. 11 Global Lubricants Market share, by Product Type, 2018 & 2025 (Kilo Tons)
    FIG. 12 Global Engine Oil Lubricants Market, 2016-2026 (USD Million)
    FIG. 13 Global Engine Oil Lubricants  Market, 2016-2026 (Kilo Tons)
    FIG. 14 Global Hydraulic fluid Lubricants Market, 2016-2026 (USD Million)
    FIG. 15 Global Hydraulic fluid Lubricants  Market, 2016-2026 (Kilo Tons)
    FIG. 16 Global Metalworking fluid Lubricants Market, 2016-2026 (USD Million)
    FIG. 17 Global Metalworking fluid Lubricants  Market, 2016-2026 (Kilo Tons)
    FIG. 18 Global Gear Oil Lubricants Market, 2016-2026 (USD Million)
    FIG. 19 Global Gear Oil Lubricants  Market, 2016-2026 (Kilo Tons)
    FIG. 20 Global Compressor Oil Lubricants Market, 2016-2026 (USD Million)
    FIG. 21 Global Compressor Oil Lubricants  Market, 2016-2026 (Kilo Tons)
    FIG. 22 Global Grease Oil Lubricants Market, 2016-2026 (USD Million)
    FIG. 23 Global Grease Oil Lubricants  Market, 2016-2026 (Kilo Tons)
    FIG. 24 Global Turbine Oil Lubricants Market, 2016-2026 (USD Million)
    FIG. 25 Global Turbine Oil Lubricants  Market, 2016-2026 (Kilo Tons)
    FIG. 26 Global Others Lubricants Market, 2016-2026 (USD Million)
    FIG. 27 Global Others Lubricants  Market, 2016-2026 (Kilo Tons)
    FIG. 28 Global Lubricants Market Share, by Application, 2018 & 2025 (USD Million)
    FIG. 29 Global Lubricants Market share, by Application, 2018 & 2025 (Kilo Tons)
    FIG. 30 Global Transportation Lubricants Market, 2016-2026 (USD Million)
    FIG. 31 Global Transportation Lubricants  Market, 2016-2026 (Kilo Tons)
    FIG. 32 Global Industrial Lubricants Market, 2016-2026 (USD Million)
    FIG. 33 Global Industrial Lubricants  Market, 2016-2026 (Kilo Tons)
    FIG. 34 Global Lubricants Market Share, by Region, 2018 & 2025
    FIG. 35 Global Lubricants Market Share, by Region, 2018 & 2025
    FIG. 36 North America Lubricants Market, 2016-2026
    FIG. 37 North America Lubricants  Market, 2016-2026 (Kilo Tons)
    FIG. 38 U.S. Lubricants Market, 2016-2026
    FIG. 39 U.S. Lubricants  Market, 2016-2026 (Kilo Tons)
    FIG. 40 Canada Lubricants Market, 2016-2026
    FIG. 41 Canada Lubricants  Market, 2016-2026 (Kilo Tons)
    FIG. 42 Europe Lubricants Market, 2016-2026
    FIG. 43 Europe Lubricants  Market, 2016-2026 (Kilo Tons)
    FIG. 44 Germany Lubricants Market, 2016-2026
    FIG. 45 Germany Lubricants  Market, 2016-2026 (Kilo Tons)
    FIG. 46 France Lubricants Market, 2016-2026
    FIG. 47 France Lubricants  Market, 2016-2026 (Kilo Tons)
    FIG. 48 U.K. Lubricants Market, 2016-2026
    FIG. 49 U.K. Lubricants  Market, 2016-2026 (Kilo Tons)
    FIG. 50 Italy Lubricants Market, 2016-2026
    FIG. 51 Italy Lubricants  Market, 2016-2026 (Kilo Tons)
    FIG. 52 Spain Lubricants Market, 2016-2026
    FIG. 53 Spain Lubricants  Market, 2016-2026 (Kilo Tons)
    FIG. 54 Rest of Europe Lubricants Market, 2016-2026
    FIG. 55 Rest of Europe Lubricants  Market, 2016-2026 (Kilo Tons)
    FIG. 56 Asia Pacific Lubricants Market, 2016-2026
    FIG. 57 Asia Pacific Lubricants  Market, 2016-2026 (Kilo Tons)
    FIG. 58 China Lubricants Market, 2016-2026
    FIG. 59 China Lubricants  Market, 2016-2026 (Kilo Tons)
    FIG. 60 Japan Lubricants Market, 2016-2026
    FIG. 61 Japan Lubricants  Market, 2016-2026 (Kilo Tons)
    FIG. 62 India Lubricants Market, 2016-2026
    FIG. 63 India Lubricants  Market, 2016-2026 (Kilo Tons)
    FIG. 64 South  Korea Lubricants Market, 2016-2026
    FIG. 65 South  Korea Lubricants  Market, 2016-2026 (Kilo Tons)
    FIG. 66 South-East Asia Lubricants Market, 2016-2026
    FIG. 67 South-East Asia Lubricants  Market, 2016-2026 (Kilo Tons)
    FIG. 68 Rest of Asia Pacific Lubricants Market, 2016-2026
    FIG. 69 Rest of Asia Pacific Lubricants  Market, 2016-2026 (Kilo Tons)
    FIG. 70 Latin America Lubricants Market, 2016-2026
    FIG. 71 Latin America Lubricants  Market, 2016-2026 (Kilo Tons)
    FIG. 72 Brazil Lubricants Market, 2016-2026
    FIG. 73 Brazil Lubricants  Market, 2016-2026 (Kilo Tons)
    FIG. 74 Mexico Lubricants Market, 2016-2026
    FIG. 75 Mexico Lubricants  Market, 2016-2026 (Kilo Tons)
    FIG. 76 Rest of Latin America Lubricants Market, 2016-2026
    FIG. 77 Rest of Latin America Lubricants  Market, 2016-2026 (Kilo Tons)
    FIG. 78 The Middle-East and Africa Lubricants Market, 2016-2026
    FIG. 79 The Middle-East and Africa Lubricants  Market, 2016-2026 (Kilo Tons)
    FIG. 80 GCC Countries Lubricants Market, 2016-2026
    FIG. 81 GCC Countries Lubricants  Market, 2016-2026 (Kilo Tons)
    FIG. 82 South Africa Lubricants Market, 2016-2026
    FIG. 83 South Africa Lubricants  Market, 2016-2026 (Kilo Tons)
    FIG. 84 Rest of Middle-East Africa Lubricants Market, 2016-2026
    FIG. 85 Rest of Middle-East Africa Lubricants  Market, 2016-2026 (Kilo Tons)
    FIG. 86 Global Lubricants production and revenue, 2015-2025 (USD Million) (Kilo Tons)
    FIG. 87 North America Lubricants production and revenue, 2015-2025 (USD Million) (Kilo Tons)
    FIG. 88 Europe Lubricants production and revenue, 2015-2025 (USD Million) (Kilo Tons)
    FIG. 89 Asia Pacific Lubricants production and revenue, 2015-2025 (USD Million) (Kilo Tons)
    FIG. 90 Latin America Lubricants production and revenue, 2015-2025 (USD Million) (Kilo Tons)
    FIG. 91 Middle East and Africa Lubricants production and revenue, 2015-2025 (USD Million) (Kilo Tons)
    FIG. 92 Competitor Market Share – Revenue
    FIG. 93 Competitor Market Share – Volume
    FIG. 94 Royal Dutch Shell Plc. Revenue and Growth Rate
    FIG. 95 Royal Dutch Shell Plc. Market Share
    FIG. 96 ExxonMobil Corporation Revenue and Growth Rate
    FIG. 97 ExxonMobil Corporation Market Share
    FIG. 98 Chevron Corporation Revenue and Growth Rate
    FIG. 99 Chevron Corporation Market Share
    FIG. 100 BP p.l.c. Revenue and Growth Rate
    FIG. 101 BP p.l.c. Market Share
    FIG. 102 Total S.A. Revenue and Growth Rate
    FIG. 103 Total S.A. Market Share
    FIG. 104 Petrochina Company Limited Revenue and Growth Rate
    FIG. 105 Petrochina Company Limited Market Share
    FIG. 106 Sinopec Limited Revenue and Growth Rate
    FIG. 107 Sinopec Limited Market Share
    FIG. 108 LUKOIL Revenue and Growth Rate
    FIG. 109 LUKOIL Market Share
    FIG. 110 Fuchs Petrolub AG Revenue and Growth Rate
    FIG. 111 Fuchs Petrolub AG Market Share
    FIG. 112 Idemitsu Kosan Co. Ltd. Revenue and Growth Rate
    FIG. 113 Idemitsu Kosan Co. Ltd. Market Share
    FIG. 114 Market Dynamics
    FIG. 115 Global Lubricants – Value Chain Analysis
    FIG. 116 Key Mandates and Regulations
    FIG. 117 Technology Roadmap and Timeline
    FIG. 118 Market Attractiveness Analysis – By Base Oil
    FIG. 119 Market Attractiveness Analysis – By Product Type
    FIG. 120 Market Attractiveness Analysis – By Application
    FIG. 121 Market Attractiveness Analysis – By Region
    FIG. 122 Manufacturing Cost Structure of Lubricants
    FIG. 123 Lubricants Industrial Chain Analysis
    FIG. 124 Market Channel
    FIG. 125 Marketing Channel Development Trend
    FIG. 126 Growth in World Gross Product, 2008-2018

    List of Tables

    TABLE 1 Global lubricants market, 2018 & 2025 (USD Million)
    TABLE 2 Global lubricants market, by Base Oil, 2016-2026 (USD Million)
    TABLE 3 Global lubricants market, by Base Oil, 2016-2026 (Kilo Tons)
    TABLE 4 Global lubricants market, by Product Type, 2016-2026 (USD Million)
    TABLE 5 Global lubricants market, by Product Type, 2016-2026 (Kilo Tons)
    TABLE 6 Global lubricants market, by Application, 2016-2026 (USD Million)
    TABLE 7 Global lubricants market, by Application, 2016-2026 (Kilo Tons)
    TABLE 8 Global lubricants market, by region, 2016-2026 (USD Million)
    TABLE 9 Global lubricants market, by region, 2016-2026 (Kilo Tons)
    TABLE 10 North America Lubricants Market, by Base Oil, 2016-2026 (USD Million)
    TABLE 11 North America Lubricants Market, by Base Oil, 2016-2026 (Kilo Tons)
    TABLE 12 North America Lubricants Market, by Product Type, 2016-2026 (USD Million)
    TABLE 13 North America Lubricants Market, by Product Type, 2016-2026 (Kilo Tons)
    TABLE 14 North America Lubricants Market, by Application, 2016-2026 (USD Million)
    TABLE 15 North America Lubricants Market, by Application, 2016-2026 (Kilo Tons)
    TABLE 16 Europe Lubricants Market, by Base Oil, 2016-2026 (USD Million)
    TABLE 17 Europe Lubricants Market, by Base Oil, 2016-2026 (Kilo Tons)
    TABLE 18 Europe Lubricants Market, by Product Type, 2016-2026 (USD Million)
    TABLE 19 Europe Lubricants Market, by Product Type, 2016-2026 (Kilo Tons)
    TABLE 20 Europe Lubricants Market, by Application, 2016-2026 (USD Million)
    TABLE 21 Europe Lubricants Market, by Application, 2016-2026 (Kilo Tons)
    TABLE 22 Asia Pacific Lubricants Market, by Base Oil, 2016-2026 (USD Million)
    TABLE 23 Asia Pacific Lubricants Market, by Base Oil, 2016-2026 (Kilo Tons)
    TABLE 24 Asia Pacific Lubricants Market, by Product Type, 2016-2026 (USD Million)
    TABLE 25 Asia Pacific Lubricants Market, by Product Type, 2016-2026 (Kilo Tons)
    TABLE 26 Asia Pacific Lubricants Market, by Application, 2016-2026 (USD Million)
    TABLE 27 Asia Pacific Lubricants Market, by Application, 2016-2026 (Kilo Tons)
    TABLE 28 Latin America Lubricants Market, by Base Oil, 2016-2026 (USD Million)
    TABLE 29 Latin America Lubricants Market, by Base Oil, 2016-2026 (Kilo Tons)
    TABLE 30 Latin America Lubricants Market, by Product Type, 2016-2026 (USD Million)
    TABLE 31 Latin America Lubricants Market, by Product Type, 2016-2026 (Kilo Tons)
    TABLE 32 Latin America Lubricants Market, by Application, 2016-2026 (USD Million)
    TABLE 33 Latin America Lubricants Market, by Application, 2016-2026 (Kilo Tons)
    TABLE 34 The Middle-East and Africa Lubricants Market, by Base Oil, 2016-2026 (USD Million)
    TABLE 35 The Middle-East and Africa Lubricants Market, by Base Oil, 2016-2026 (Kilo Tons)
    TABLE 36 The Middle-East and Africa Lubricants Market, by Product Type, 2016-2026 (USD Million)
    TABLE 37 The Middle-East and Africa Lubricants Market, by Product Type, 2016-2026 (Kilo Tons)
    TABLE 38 The Middle-East and Africa Lubricants Market, by Application, 2016-2026 (USD Million)
    TABLE 39 The Middle-East and Africa Lubricants Market, by Application, 2016-2026 (Kilo Tons)
    TABLE 40 North America Lubricants Production, Consumption, Export, Import, 2016-2019
    TABLE 41 Europe Lubricants Production, Consumption, Export, Import, 2016-2019
    TABLE 42 Asia Pacific Lubricants Production, Consumption, Export, Import, 2016-2019
    TABLE 43 Latin America Lubricants Production, Consumption, Export, Import, 2016-2019
    TABLE 44 Middle East & Africa Lubricants Production, Consumption, Export, Import, 2016-2019
    TABLE 45 Global Lubricants Market - Company Revenue Analysis 2016-2019 (USD Million)
    TABLE 46 Global Lubricants Market - Company Revenue Share Analysis 2016-2019(%)
    TABLE 47 Global Lubricants Market - Company Volume Analysis 2016-2019 (Kilo Tons)
    TABLE 48 Global Lubricants Market - Company Volume Share Analysis 2016-2019(%)
    TABLE 49 Acquisitions and Mergers
    TABLE 50 New Product/Service Launch
    TABLE 51 Research & Development Activities
    TABLE 52 Market Drivers
    TABLE 53 Market Restraints
    TABLE 54 Market Opportunities
    TABLE 55 Production Base and Market Concentration Rate of Raw Material
    TABLE 56 Key Suppliers of Raw Materials
    TABLE 57 Raw Materials Sources of Lubricants Major Manufacturers in 2016
    TABLE 58 Major Buyers of Lubricants
    TABLE 59 Distributors/Traders of Lubricants by Region
  •  

    Industry Major Market Players

    • Royal Dutch Shell Plc.
    • ExxonMobil Corporation
    • Chevron Corporation
    • BP p.l.c.
    • Total S.A.
    • Petrochina Company Limited
    • Sinopec Limited
    • LUKOIL
    • Fuchs Petrolub AG
    • Idemitsu Kosan Co. Ltd.