Search Market Research Report

Discover Our Latest Reports
Discover Our Featured Reports
Discover Top Selling Reports

Lithium Compounds Market Size, Share Global Analysis Report, 2020–2026

report img

Lithium Compounds Market By Derivatives (Lithium Carbonate, Lithium Chloride, Lithium Hydroxide, Butyl Lithium, Lithium Concentrate, and Lithium Metal) and By End Use (Li-Ion Batteries, Lubricants, Medical, and Glass & Ceramics): Global Industry Outlook, Market Size, Business Intelligence, Consumer Preferences, Statistical Surveys, Comprehensive Analysis, Historical Developments, Current Trends, and Forecast 2020–2026

Industry Insights

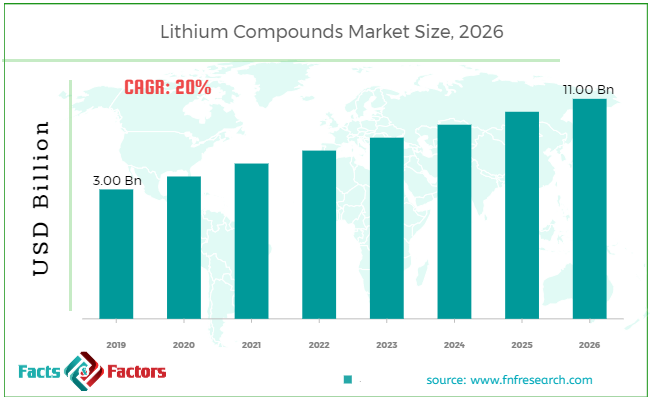
[185+ Pages Report] According to the report published by Facts Factors, the global lithium compounds market size was worth around USD 3.00 billion in 2019 and is predicted to grow to around USD 11.00 billion by 2026 with a compound annual growth rate (CAGR) of roughly 20% between 2020 and 2026. The report analyzes the global lithium compounds market drivers, restraints/challenges, and the effect they have on the demands during the projection period. In addition, the report explores emerging opportunities in the lithium compounds market.

Lithium Compounds Market Size

To know more about this report | Request Free Sample Copy

This specialized and expertise oriented industry research report scrutinizes the technical and commercial business outlook of the Lithium Compounds industry. The report analyzes and declares the historical and current trends analysis of the Lithium Compounds industry and subsequently recommends the projected trends anticipated to be observed in the Lithium Compounds market during the upcoming years.

The Lithium Compounds market report analyzes and notifies the industry statistics at the global as well as regional and country levels in order to acquire a thorough perspective of the entire Lithium Compounds market. The historical and past insights are provided for FY 2016 to FY 2019 whereas projected trends are delivered for FY 2020 to FY 2026. The quantitative and numerical data is represented in terms of both volume (Kilo Tons) and value (USD Million) from FY 2016 – 2026.


logoKey Insights from Primary Research

  • The Asia Pacific is expected to hold the largest market share of the lithium compounds market in terms of revenue, in 2019.
  • The “lithium carbonate” category, on the basis of derivatives segmentation, contributing to the highest revenue-generating category.
  • According to end-use based segmentation the “Li-Ion batteries” category, was the leading revenue-generating category in 2019.
  • It was recognized through primary research that the Lithium Compounds market was valued at around USD 3 Billion in 2019.
  • According to our primary respondents, the Lithium Compounds market is set to grow annually at a rate of around 20%.

logoKey Recommendations from Analysts

  • The rise in demand for electric vehicles and electronic battery-powered gadgets is estimated to propel the lithium compounds market in the forecasted period.
  • The extraction of lithium increases its operational cost which ultimately increases the product cost.
  • The Asia Pacific is estimated to lead the market in the forecast period. The growing demand for energy storage applications and vehicles and augmented demand for consumer gadgets is estimated to create a sustainable demand for lithium compounds in the forecasted period.
  • The prominent countries such as India and China are estimated to shift to the electrical vehicle till 2030 which is expected to fuel the lithium compound industry growth in Asia followed by North America and Europe.
  • The lithium carbonate market is projected to contribute to leading market share, owing to its wide applications such as the processing of metal oxides, production of glass and ceramics, production of aluminum, lithium-ion batteries, and pharmaceuticals.

The quantitative data is further underlined and reinforced by comprehensive qualitative data which comprises various across-the-board market dynamics. The rationales which directly or indirectly impact the Lithium Compounds industry are exemplified through parameters such as growth drivers, restraints, challenges, and opportunities among other impacting factors.

Throughout our research report, we have encompassed all the proven models and tools of industry analysis and extensively illustrated all the key business strategies and business models adopted in the Lithium Compounds industry. The report provides an all-inclusive and detailed competitive landscape prevalent in the Lithium Compounds market.

The report utilizes established industry analysis tools and models such as Porter’s Five Forces framework to analyze and recognize critical business strategies adopted by various stakeholders involved in the entire value chain of the Lithium Compounds industry. The Lithium Compounds market report additionally employs SWOT analysis and PESTLE analysis models for further in-depth analysis.

The report study further includes an in-depth analysis of industry players' market shares and provides an overview of leading players' market position in the Lithium Compounds sector. Key strategic developments in the Lithium Compounds market competitive landscape such as acquisitions & mergers, inaugurations of different products and services, partnerships & joint ventures, MoU agreements, VC & funding activities, R&D activities, and geographic expansion among other noteworthy activities by key players of the Lithium Compounds market are appropriately highlighted in the report.

The Lithium Compounds market research report delivers an acute valuation and taxonomy of the Lithium Compounds industry by practically splitting the market on the basis of different types, applications, and regions. Through the analysis of the historical and projected trends, all the segments and sub-segments were evaluated through the bottom-up approach, and different market sizes have been projected for FY 2020 to FY 2026.

logoReport Scope

Report Attribute

Details

Market Size in 2019

USD 3.00 Billion

Projected Market Size in 2026

USD 11.00 Billion

CAGR Growth Rate

20% CAGR

Base Year

2019

Forecast Years

2020-2026

Key Market Players

Sociedad Quimica y Minera de Chile S.A., Millennial Lithium Corporation, Livent Corporation, Neo Lithium Corporation, Albemarle Corporation, Nemaska Lithium Inc., Shandong Ruifu Lithium Industry Company Limited, Tianqi Lithium Industries Inc., Orocobre Limited, Ganfeng Lithium Company Limited, Galaxy Resources Limited, China Lithium Products Technology Company Limited, Lithium Americas, Sichuan Ni&Co Guorun New Materials Company Limited, Bacanora Lithium, and Shanghai China Lithium Industrial Company Limited.

Key Segment

By Derivative, End Use, and Region

Major Regions Covered

North America, Europe, Asia Pacific, Latin America, and the Middle East & Africa

Purchase Options

Request customized purchase options to meet your research needs.Explore purchase options

The regional segmentation of the Lithium Compounds industry includes the complete classification of all the major continents including North America, Latin America, Europe, Asia Pacific, and the Middle East & Africa. Further, country-wise data for the Lithium Compounds industry is provided for the leading economies of the world.

The Lithium Compounds market is segmented based on derivatives and End-Use.  On the basis of Derivatives segmentation, the market is classified into Lithium Carbonate, Lithium Hydroxide, Lithium Concentrate, Lithium Metal, Butyl Lithium, and Lithium Chloride. In terms of End Use segmentation, the market is bifurcated into Li-Ion Batteries, Glass & Ceramics, Medical, and Lubricants.

logoSome of the essential players operating in the Lithium Compounds market, but not restricted to include

  • Sociedad Quimica y Minera de Chile S.A.
  • Millennial Lithium Corporation
  • Livent Corporation
  • Neo Lithium Corporation
  • Albemarle Corporation
  • Nemaska Lithium Inc.
  • Shandong Ruifu Lithium Industry Company Limited
  • Tianqi Lithium Industries Inc.
  • Orocobre Limited
  • Ganfeng Lithium Company Limited
  • Galaxy Resources Limited
  • China Lithium Products Technology Company Limited
  • Lithium Americas
  • Sichuan Ni&Co Guorun New Materials Company Limited
  • Bacanora Lithium
  • Shanghai China Lithium Industrial Company Limited.

The taxonomy of the Lithium Compounds industry by its scope and segmentation is as follows:

logo By Derivative Segmentation Analysis

  • Lithium Carbonate
  • Lithium Chloride
  • Lithium Hydroxide
  • Butyl Lithium
  • Lithium Concentrate
  • Lithium Metal

logo By End-Use Segmentation Analysis

  • Li-Ion Batteries
  • Lubricants
  • Medical
  • Glass & Ceramics

logoBy Regional Segmentation Analysis

  • North America
    • The U.S.
    • Canada
  • Europe
    • Germany
    • The UK
    • France
    • Spain
    • Italy
    • Rest of Europe
  • Asia Pacific
    • China
    • Japan
    • India
    • South Korea
    • Southeast Asia
    • Rest of Asia Pacific
  • Latin America
    • Brazil
    • Mexico
    • Rest of Latin America
  • Middle East & Africa
    • GCC
    • South Africa
    • Rest of Middle East & Africa

Table of Content

  1. CHAPTER 1. Executive Summary
  2. CHAPTER 2. Lithium Compounds market – Derivative Analysis
    1. 2.1. Global Lithium Compounds Market – Derivative Overview
    2. 2.2. Global Lithium Compounds Market Share, by Derivative, 2018 & 2025 (USD Million)
    3. 2.3. Global Lithium Compounds Market share, by Derivative, 2018 & 2025 (Kilo Tons)
    4. 2.4. Lithium Carbonate
      1. 2.4.1. Global Lithium Carbonate Lithium Compounds Market, 2016-2026 (USD Million)
      2. 2.4.2. Global Lithium Carbonate Lithium Compounds Market, 2016-2026 (Kilo Tons)
    5. 2.5. Lithium Chloride
      1. 2.5.1. Global Lithium Chloride Lithium Compounds Market, 2016-2026 (USD Million)
      2. 2.5.2. Global Lithium Chloride Lithium Compounds Market, 2016-2026 (Kilo Tons)
    6. 2.6. Lithium Hydroxide
      1. 2.6.1. Global Lithium Hydroxide Lithium Compounds Market, 2016-2026 (USD Million)
      2. 2.6.2. Global Lithium Hydroxide Lithium Compounds Market, 2016-2026 (Kilo Tons)
    7. 2.7. Butyl Lithium
      1. 2.7.1. Global Butyl Lithium Lithium Compounds Market, 2016-2026 (USD Million)
      2. 2.7.2. Global Butyl Lithium Lithium Compounds Market, 2016-2026 (Kilo Tons)
    8. 2.8. Lithium Concentrate
      1. 2.8.1. Global Lithium Concentrate Lithium Compounds Market, 2016-2026 (USD Million)
      2. 2.8.2. Global Lithium Concentrate Lithium Compounds Market, 2016-2026 (Kilo Tons)
    9. 2.9. Lithium Metal
      1. 2.9.1. Global Lithium Metal Lithium Compounds Market, 2016-2026 (USD Million)
      2. 2.9.2. Global Lithium Metal Lithium Compounds Market, 2016-2026 (Kilo Tons)
  3. CHAPTER 3. Lithium Compounds market – End Use Analysis
    1. 3.1. Global Lithium Compounds Market – End Use Overview
    2. 3.2. Global Lithium Compounds Market Share, by End Use, 2018 & 2025 (USD Million)
    3. 3.3. Global Lithium Compounds Market share, by End Use, 2018 & 2025 (Kilo Tons)
    4. 3.4. Li-Ion Batteries
      1. 3.4.1. Global Li-Ion Batteries Lithium Compounds Market, 2016-2026 (USD Million)
      2. 3.4.2. Global Li-Ion Batteries Lithium Compounds Market, 2016-2026 (Kilo Tons)
    5. 3.5. Lubricants
      1. 3.5.1. Global Lubricants Lithium Compounds Market, 2016-2026 (USD Million)
      2. 3.5.2. Global Lubricants Lithium Compounds Market, 2016-2026 (Kilo Tons)
    6. 3.6. Medical
      1. 3.6.1. Global Medical Lithium Compounds Market, 2016-2026 (USD Million)
      2. 3.6.2. Global Medical Lithium Compounds Market, 2016-2026 (Kilo Tons)
    7. 3.7. Glass & Ceramics
      1. 3.7.1. Global Glass & Ceramics Lithium Compounds Market, 2016-2026 (USD Million)
      2. 3.7.2. Global Glass & Ceramics Lithium Compounds Market, 2016-2026 (Kilo Tons)
  4. CHAPTER 4. Lithium Compounds market – Regional Analysis
    1. 4.1. Global Lithium Compounds Market Regional Overview
    2. 4.2. Global Lithium Compounds Market Share, by Region, 2018 & 2025 (Value)
    3. 4.3. Global Lithium Compounds Market Share, by Region, 2018 & 2025 (Volume)
    4. 4.4. North America
      1. 4.4.1. North America Lithium Compounds Market size and forecast, 2016-2026
      2. 4.4.2. North America Lithium Compounds Market, by Country, 2018 - 2025 (USD Million)
      3. 4.4.3. North America Market size and forecast, 2016-2026 (Kilo Tons)
      4. 4.4.4. North America Lithium Compounds Market, by Country, 2018 - 2025 (Kilo Tons)
      5. 4.4.5. North America Lithium Compounds Market, by Derivative, 2016-2026
        1. 4.4.5.1. North America Lithium Compounds Market, by Derivative, 2016-2026 (USD Million)
        2. 4.4.5.2. North America Lithium Compounds Market, by Derivative, 2016-2026 (Kilo Tons)
      6. 4.4.6. North America Lithium Compounds Market, by End Use, 2016-2026
        1. 4.4.6.1. North America Lithium Compounds Market, by End Use, 2016-2026 (USD Million)
        2. 4.4.6.2. North America Lithium Compounds Market, by End Use, 2016-2026 (Kilo Tons)
      7. 4.4.7. U.S.
        1. 4.4.7.1. U.S. Market size and forecast, 2016-2026 (USD Million)
        2. 4.4.7.2. U.S. Market size and forecast, 2016-2026 (Kilo Tons)
      8. 4.4.8. Canada
        1. 4.4.8.1. Canada Market size and forecast, 2016-2026 (USD Million)
        2. 4.4.8.2. Canada Market size and forecast, 2016-2026 (Kilo Tons)
    5. 4.5. Europe
      1. 4.5.1. Europe Lithium Compounds Market size and forecast, 2016-2026
      2. 4.5.2. Europe Lithium Compounds Market, by Country, 2018 - 2025 (USD Million)
      3. 4.5.3. Europe Market size and forecast, 2016-2026 (Kilo Tons)
      4. 4.5.4. Europe Lithium Compounds Market, by Country, 2018 - 2025 (Kilo Tons)
      5. 4.5.5. Europe Lithium Compounds Market, by Derivative, 2016-2026
        1. 4.5.5.1. Europe Lithium Compounds Market, by Derivative, 2016-2026 (USD Million)
        2. 4.5.5.2. Europe Lithium Compounds Market, by Derivative, 2016-2026 (Kilo Tons)
      6. 4.5.6. Europe Lithium Compounds Market, by End Use, 2016-2026
        1. 4.5.6.1. Europe Lithium Compounds Market, by End Use, 2016-2026 (USD Million)
        2. 4.5.6.2. Europe Lithium Compounds Market, by End Use, 2016-2026 (Kilo Tons)
      7. 4.5.7. Germany
        1. 4.5.7.1. Germany Market size and forecast, 2016-2026 (USD Million)
        2. 4.5.7.2. Germany Market size and forecast, 2016-2026 (Kilo Tons)
      8. 4.5.8. France
        1. 4.5.8.1. France Market size and forecast, 2016-2026 (USD Million)
        2. 4.5.8.2. France Market size and forecast, 2016-2026 (Kilo Tons)
      9. 4.5.9. U.K.
        1. 4.5.9.1. U.K. Market size and forecast, 2016-2026 (USD Million)
        2. 4.5.9.2. U.K. Market size and forecast, 2016-2026 (Kilo Tons)
      10. 4.5.10. Italy
        1. 4.5.10.1. Italy Market size and forecast, 2016-2026 (USD Million)
        2. 4.5.10.2. Italy Market size and forecast, 2016-2026 (Kilo Tons)
      11. 4.5.11. Spain
        1. 4.5.11.1. Spain Market size and forecast, 2016-2026 (USD Million)
        2. 4.5.11.2. Spain Market size and forecast, 2016-2026 (Kilo Tons)
      12. 4.5.12. Rest of Europe
        1. 4.5.12.1. Rest of Europe Market size and forecast, 2016-2026 (USD Million)
        2. 4.5.12.2. Rest of Europe Market size and forecast, 2016-2026 (Kilo Tons)
    6. 4.6. Asia Pacific
      1. 4.6.1. Asia Pacific Lithium Compounds Market size and forecast, 2016-2026
      2. 4.6.2. Asia Pacific Lithium Compounds Market, by Country, 2018 - 2025 (USD Million)
      3. 4.6.3. Asia Pacific Market size and forecast, 2016-2026 (Kilo Tons)
      4. 4.6.4. Asia Pacific Lithium Compounds Market, by Country, 2018 - 2025 (Kilo Tons)
      5. 4.6.5. Asia Pacific Lithium Compounds Market, by Derivative, 2016-2026
        1. 4.6.5.1. Asia Pacific Lithium Compounds Market, by Derivative, 2016-2026 (USD Million)
        2. 4.6.5.2. Asia Pacific Lithium Compounds Market, by Derivative, 2016-2026 (Kilo Tons)
      6. 4.6.6. Asia Pacific Lithium Compounds Market, by End Use, 2016-2026
        1. 4.6.6.1. Asia Pacific Lithium Compounds Market, by End Use, 2016-2026 (USD Million)
        2. 4.6.6.2. Asia Pacific Lithium Compounds Market, by End Use, 2016-2026 (Kilo Tons)
      7. 4.6.7. China
        1. 4.6.7.1. China Market size and forecast, 2016-2026 (USD Million)
        2. 4.6.7.2. China Market size and forecast, 2016-2026 (Kilo Tons)
      8. 4.6.8. Japan
        1. 4.6.8.1. Japan Market size and forecast, 2016-2026 (USD Million)
        2. 4.6.8.2. Japan Market size and forecast, 2016-2026 (Kilo Tons)
      9. 4.6.9. India
        1. 4.6.9.1. India Market size and forecast, 2016-2026 (USD Million)
        2. 4.6.9.2. India Market size and forecast, 2016-2026 (Kilo Tons)
      10. 4.6.10. South Korea
        1. 4.6.10.1. South Korea Market size and forecast, 2016-2026 (USD Million)
        2. 4.6.10.2. South Korea Market size and forecast, 2016-2026 (Kilo Tons)
      11. 4.6.11. South-East Asia
        1. 4.6.11.1. South-East Asia Market size and forecast, 2016-2026 (USD Million)
        2. 4.6.11.2. South-East Asia Market size and forecast, 2016-2026 (Kilo Tons)
      12. 4.6.12. Rest of Asia Pacific
        1. 4.6.12.1. Rest of Asia Pacific Market size and forecast, 2016-2026 (USD Million)
        2. 4.6.12.2. Rest of Asia Pacific Market size and forecast, 2016-2026 (Kilo Tons)
    7. 4.7. Latin America
      1. 4.7.1. Latin America Lithium Compounds Market size and forecast, 2016-2026
      2. 4.7.2. Latin America Lithium Compounds Market, by Country, 2018 - 2025 (USD Million)
      3. 4.7.3. Latin America Market size and forecast, 2016-2026 (Kilo Tons)
      4. 4.7.4. Latin America Lithium Compounds Market, by Country, 2018 - 2025 (Kilo Tons)
      5. 4.7.5. Latin America Lithium Compounds Market, by Derivative, 2016-2026
        1. 4.7.5.1. Latin America Lithium Compounds Market, by Derivative, 2016-2026 (USD Million)
        2. 4.7.5.2. Latin America Lithium Compounds Market, by Derivative, 2016-2026 (Kilo Tons)
      6. 4.7.6. Latin America Lithium Compounds Market, by End Use, 2016-2026
        1. 4.7.6.1. Latin America Lithium Compounds Market, by End Use, 2016-2026 (USD Million)
        2. 4.7.6.2. Latin America Lithium Compounds Market, by End Use, 2016-2026 (Kilo Tons)
      7. 4.7.7. Brazil
        1. 4.7.7.1. Brazil Market size and forecast, 2016-2026 (USD Million)
        2. 4.7.7.2. Brazil Market size and forecast, 2016-2026 (Kilo Tons)
      8. 4.7.8. Mexico
        1. 4.7.8.1. Mexico Market size and forecast, 2016-2026 (USD Million)
        2. 4.7.8.2. Mexico Market size and forecast, 2016-2026 (Kilo Tons)
      9. 4.7.9. Rest of Latin America
        1. 4.7.9.1. Rest of Latin America Market size and forecast, 2016-2026 (USD Million)
        2. 4.7.9.2. Rest of Latin America Market size and forecast, 2016-2026 (Kilo Tons)
    8. 4.8. The Middle-East and Africa
      1. 4.8.1. The Middle-East and Africa Lithium Compounds Market size and forecast, 2016-2026
      2. 4.8.2. The Middle-East and Africa Lithium Compounds Market, by Country, 2018 - 2025 (USD Million)
      3. 4.8.3. The Middle-East and Africa Market size and forecast, 2016-2026 (Kilo Tons)
      4. 4.8.4. The Middle-East and Africa Lithium Compounds Market, by Country, 2018 - 2025 (Kilo Tons)
      5. 4.8.5. The Middle-East and Africa Lithium Compounds Market, by Derivative, 2016-2026
        1. 4.8.5.1. The Middle-East and Africa Lithium Compounds Market, by Derivative, 2016-2026 (USD Million)
        2. 4.8.5.2. The Middle-East and Africa Lithium Compounds Market, by Derivative, 2016-2026 (Kilo Tons)
      6. 4.8.6. The Middle-East and Africa Lithium Compounds Market, by End Use, 2016-2026
        1. 4.8.6.1. The Middle-East and Africa Lithium Compounds Market, by End Use, 2016-2026 (USD Million)
        2. 4.8.6.2. The Middle-East and Africa Lithium Compounds Market, by End Use, 2016-2026 (Kilo Tons)
      7. 4.8.7. GCC Countries
        1. 4.8.7.1. GCC Countries Market size and forecast, 2016-2026 (USD Million)
        2. 4.8.7.2. GCC Countries Market size and forecast, 2016-2026 (Kilo Tons)
      8. 4.8.8. South Africa
        1. 4.8.8.1. South Africa Market size and forecast, 2016-2026 (USD Million)
        2. 4.8.8.2. South Africa Market size and forecast, 2016-2026 (Kilo Tons)
      9. 4.8.9. Rest of Middle-East Africa
        1. 4.8.9.1. Rest of Middle-East Africa Market size and forecast, 2016-2026 (USD Million)
        2. 4.8.9.2. Rest of Middle-East Africa Market size and forecast, 2016-2026 (Kilo Tons)
  5. CHAPTER 5. Lithium Compounds Production, Consumption, Export, Import by Regions
    1. 5.1. Global Lithium Compounds production and revenue, 2015-2025 (USD Million) (Kilo Tons)
    2. 5.2. Global Import and Export Analysis, by Region
  6. CHAPTER 6. Lithium Compounds market – Competitive Landscape
    1. 6.1. Competitor Market Share – Revenue
    2. 6.2. Market Concentration Rate Analysis, Top 3 and Top 5 Players
    3. 6.3. Competitor Market Share – Volume
    4. 6.4. Strategic Development
      1. 6.4.1. Acquisitions and Mergers
      2. 6.4.2. New Products
      3. 6.4.3. Research & Development Activities
  7. CHAPTER 7. Company Profiles
    1. 7.1. Sociedad Quimica y Minera de Chile S.A.
      1. 7.1.1. Company Overview
      2. 7.1.2. Sociedad Quimica y Minera de Chile S.A. Sales, Revenue, Price, and Gross Margin
      3. 7.1.3. Product portfolio
      4. 7.1.4. Recent initiatives
    2. 7.2. Millennial Lithium Corporation
      1. 7.2.1. Company Overview
      2. 7.2.2. Millennial Lithium Corporation Sales, Revenue, Price, and Gross Margin
      3. 7.2.3. Product portfolio
      4. 7.2.4. Recent initiatives
    3. 7.3. Livent Corporation
      1. 7.3.1. Company Overview
      2. 7.3.2. Livent Corporation Sales, Revenue, Price, and Gross Margin
      3. 7.3.3. Product portfolio
      4. 7.3.4. Recent initiatives
    4. 7.4. Neo Lithium Corporation
      1. 7.4.1. Company Overview
      2. 7.4.2. Neo Lithium Corporation Sales, Revenue, Price, and Gross Margin
      3. 7.4.3. Product portfolio
      4. 7.4.4. Recent initiatives
    5. 7.5. Albemarle Corporation
      1. 7.5.1. Company Overview
      2. 7.5.2. Albemarle Corporation Sales, Revenue, Price, and Gross Margin
      3. 7.5.3. Product portfolio
      4. 7.5.4. Recent initiatives
    6. 7.6. Nemaska Lithium Inc.
      1. 7.6.1. Company Overview
      2. 7.6.2. Nemaska Lithium Inc. Sales, Revenue, Price, and Gross Margin
      3. 7.6.3. Product portfolio
      4. 7.6.4. Recent initiatives
    7. 7.7. Shandong Ruifu Lithium Industry Company Limited
      1. 7.7.1. Company Overview
      2. 7.7.2. Shandong Ruifu Lithium Industry Company Limited Sales, Revenue, Price, and Gross Margin
      3. 7.7.3. Product portfolio
      4. 7.7.4. Recent initiatives
    8. 7.8. Tianqi Lithium Industries Inc.
      1. 7.8.1. Company Overview
      2. 7.8.2. Tianqi Lithium Industries Inc. Sales, Revenue, Price, and Gross Margin
      3. 7.8.3. Product portfolio
      4. 7.8.4. Recent initiatives
    9. 7.9. Orocobre Limited
      1. 7.9.1. Company Overview
      2. 7.9.2. Orocobre Limited Sales, Revenue, Price, and Gross Margin
      3. 7.9.3. Product portfolio
      4. 7.9.4. Recent initiatives
    10. 7.10. Ganfeng Lithium Company Limited
      1. 7.10.1. Company Overview
      2. 7.10.2. Ganfeng Lithium Company Limited Sales, Revenue, Price, and Gross Margin
      3. 7.10.3. Product portfolio
      4. 7.10.4. Recent initiatives
    11. 7.11. Galaxy Resources Limited
      1. 7.11.1. Company Overview
      2. 7.11.2. Galaxy Resources Limited Sales, Revenue, Price, and Gross Margin
      3. 7.11.3. Product portfolio
      4. 7.11.4. Recent initiatives
    12. 7.12. China Lithium Products Technology Company Limited
      1. 7.12.1. Company Overview
      2. 7.12.2. China Lithium Products Technology Company Limited Sales, Revenue, Price, and Gross Margin
      3. 7.12.3. Product portfolio
      4. 7.12.4. Recent initiatives
    13. 7.13. Lithium Americas
      1. 7.13.1. Company Overview
      2. 7.13.2. Lithium Americas Sales, Revenue, Price, and Gross Margin
      3. 7.13.3. Product portfolio
      4. 7.13.4. Recent initiatives
    14. 7.14. Sichuan Ni&Co Guorun New Materials Company Limited
      1. 7.14.1. Company Overview
      2. 7.14.2. Sichuan Ni&Co Guorun New Materials Company Limited Sales, Revenue, Price, and Gross Margin
      3. 7.14.3. Product portfolio
      4. 7.14.4. Recent initiatives
    15. 7.15. Bacanora Lithium
      1. 7.15.1. Company Overview
      2. 7.15.2. Bacanora Lithium Sales, Revenue, Price, and Gross Margin
      3. 7.15.3. Product portfolio
      4. 7.15.4. Recent initiatives
    16. 7.16. Shanghai China Lithium Industrial Company Limited
      1. 7.16.1. Company Overview
      2. 7.16.2. Shanghai China Lithium Industrial Company Limited Sales, Revenue, Price, and Gross Margin
      3. 7.16.3. Product portfolio
      4. 7.16.4. Recent initiatives
  8. CHAPTER 8. Lithium Compounds — Industry Analysis
    1. 8.1. Introduction and Taxonomy
    2. 8.2. Lithium Compounds Market – Key Trends
      1. 8.2.1. Market Drivers
      2. 8.2.2. Market Restraints
      3. 8.2.3. Market Opportunities
    3. 8.3. Value Chain Analysis
    4. 8.4. Key Mandates and Regulations
    5. 8.5. Technology Roadmap and Timeline
    6. 8.6. Lithium Compounds market – Attractiveness Analysis
      1. 8.6.1. By Derivative
      2. 8.6.2. By End Use
      3. 8.6.3. By Region
  9. CHAPTER 9. Raw Material analysis
    1. 9.1. Lithium Compounds Key Raw Material Analysis
      1. 9.1.1. Key Raw Materials
      2. 9.1.2. Price Trend of Key Raw Materials
    2. 9.2. Key Suppliers of Raw Materials
    3. 9.3. Proportion of Manufacturing Cost Structure
      1. 9.3.1. Raw Materials
      2. 9.3.2. Labor Cost
    4. 9.4. Manufacturing Expenses Analysis of Lithium Compounds
  10. CHAPTER 10. Industrial Chain, Sourcing Strategy and Downstream Buyers
    1. 10.1. Lithium Compounds Industrial Chain Analysis
    2. 10.2. Upstream Raw Materials Sourcing
      1. 10.2.1. Risk Mitigation:
      2. 10.2.2. Supplier Relationships:
      3. 10.2.3. Business Processes:
      4. 10.2.4. Securing the Product:
    3. 10.3. Raw Materials Sources of Lithium Compounds Major Manufacturers in 2016
    4. 10.4. Downstream Buyers
    5. 10.5. Distributors/Traders List
  11. CHAPTER 11. Marketing Strategy Analysis, Distributors
    1. 11.1. Marketing Channel
    2. 11.2. Direct Marketing
    3. 11.3. Indirect Marketing
    4. 11.4. Marketing Channel Development Trend
    5. 11.5. Economic/Political Environmental Change
  12. CHAPTER 12. Report Conclusion
  13. CHAPTER 13. Research Approach & Methodology
    1. 13.1. Report Description
    2. 13.2. Research Scope
    3. 13.3. Research Methodology
      1. 13.3.1. Secondary Research
      2. 13.3.2. Primary Research
      3. 13.3.3. Models
        1. 13.3.3.1. Company Share Analysis Model
        2. 13.3.3.2. Revenue Based Modeling
        3. 13.3.3.3. Research Limitations

        List of Figures

        FIG. 1 Global Lithium Compounds Market, 2016-2026 (USD Million)
        FIG. 2 Global Lithium Compounds Market Share, by Derivative, 2018 & 2025 (USD Million)
        FIG. 3 Global Lithium Compounds Market share, by Derivative, 2018 & 2025 (Kilo Tons)
        FIG. 4 Global Lithium Carbonate Lithium Compounds Market, 2016-2026 (USD Million)
        FIG. 5 Global Lithium Carbonate Lithium Compounds  Market, 2016-2026 (Kilo Tons)
        FIG. 6 Global Lithium Chloride Lithium Compounds Market, 2016-2026 (USD Million)
        FIG. 7 Global Lithium Chloride Lithium Compounds  Market, 2016-2026 (Kilo Tons)
        FIG. 8 Global Lithium Hydroxide Lithium Compounds Market, 2016-2026 (USD Million)
        FIG. 9 Global Lithium Hydroxide Lithium Compounds  Market, 2016-2026 (Kilo Tons)
        FIG. 10 Global Butyl Lithium Lithium Compounds Market, 2016-2026 (USD Million)
        FIG. 11 Global Butyl Lithium Lithium Compounds  Market, 2016-2026 (Kilo Tons)
        FIG. 12 Global  Lithium Concentrate Lithium Compounds Market, 2016-2026 (USD Million)
        FIG. 13 Global  Lithium Concentrate Lithium Compounds  Market, 2016-2026 (Kilo Tons)
        FIG. 14 Global Lithium Metal Lithium Compounds Market, 2016-2026 (USD Million)
        FIG. 15 Global Lithium Metal Lithium Compounds  Market, 2016-2026 (Kilo Tons)
        FIG. 16 Global Lithium Compounds Market Share, by End Use, 2018 & 2025 (USD Million)
        FIG. 17 Global Lithium Compounds Market share, by End Use, 2018 & 2025 (Kilo Tons)
        FIG. 18 Global Li-Ion Batteries Lithium Compounds Market, 2016-2026 (USD Million)
        FIG. 19 Global Li-Ion Batteries Lithium Compounds  Market, 2016-2026 (Kilo Tons)
        FIG. 20 Global Lubricants Lithium Compounds Market, 2016-2026 (USD Million)
        FIG. 21 Global Lubricants Lithium Compounds  Market, 2016-2026 (Kilo Tons)
        FIG. 22 Global Medical Lithium Compounds Market, 2016-2026 (USD Million)
        FIG. 23 Global Medical Lithium Compounds  Market, 2016-2026 (Kilo Tons)
        FIG. 24 Global Glass & Ceramics Lithium Compounds Market, 2016-2026 (USD Million)
        FIG. 25 Global Glass & Ceramics Lithium Compounds  Market, 2016-2026 (Kilo Tons)
        FIG. 26 Global Lithium Compounds Market Share, by Region, 2018 & 2025
        FIG. 27 Global Lithium Compounds Market Share, by Region, 2018 & 2025
        FIG. 28 North America Lithium Compounds Market, 2016-2026
        FIG. 29 North America Lithium Compounds  Market, 2016-2026 (Kilo Tons)
        FIG. 30 U.S. Lithium Compounds Market, 2016-2026
        FIG. 31 U.S. Lithium Compounds  Market, 2016-2026 (Kilo Tons)
        FIG. 32 Canada Lithium Compounds Market, 2016-2026
        FIG. 33 Canada Lithium Compounds  Market, 2016-2026 (Kilo Tons)
        FIG. 34 Europe Lithium Compounds Market, 2016-2026
        FIG. 35 Europe Lithium Compounds  Market, 2016-2026 (Kilo Tons)
        FIG. 36 Germany Lithium Compounds Market, 2016-2026
        FIG. 37 Germany Lithium Compounds  Market, 2016-2026 (Kilo Tons)
        FIG. 38 France Lithium Compounds Market, 2016-2026
        FIG. 39 France Lithium Compounds  Market, 2016-2026 (Kilo Tons)
        FIG. 40 U.K. Lithium Compounds Market, 2016-2026
        FIG. 41 U.K. Lithium Compounds  Market, 2016-2026 (Kilo Tons)
        FIG. 42 Italy Lithium Compounds Market, 2016-2026
        FIG. 43 Italy Lithium Compounds  Market, 2016-2026 (Kilo Tons)
        FIG. 44 Spain Lithium Compounds Market, 2016-2026
        FIG. 45 Spain Lithium Compounds  Market, 2016-2026 (Kilo Tons)
        FIG. 46 Rest of Europe Lithium Compounds Market, 2016-2026
        FIG. 47 Rest of Europe Lithium Compounds  Market, 2016-2026 (Kilo Tons)
        FIG. 48 Asia Pacific Lithium Compounds Market, 2016-2026
        FIG. 49 Asia Pacific Lithium Compounds  Market, 2016-2026 (Kilo Tons)
        FIG. 50 China Lithium Compounds Market, 2016-2026
        FIG. 51 China Lithium Compounds  Market, 2016-2026 (Kilo Tons)
        FIG. 52 Japan Lithium Compounds Market, 2016-2026
        FIG. 53 Japan Lithium Compounds  Market, 2016-2026 (Kilo Tons)
        FIG. 54 India Lithium Compounds Market, 2016-2026
        FIG. 55 India Lithium Compounds  Market, 2016-2026 (Kilo Tons)
        FIG. 56 South  Korea Lithium Compounds Market, 2016-2026
        FIG. 57 South  Korea Lithium Compounds  Market, 2016-2026 (Kilo Tons)
        FIG. 58 South-East Asia Lithium Compounds Market, 2016-2026
        FIG. 59 South-East Asia Lithium Compounds  Market, 2016-2026 (Kilo Tons)
        FIG. 60 Rest of Asia Pacific Lithium Compounds Market, 2016-2026
        FIG. 61 Rest of Asia Pacific Lithium Compounds  Market, 2016-2026 (Kilo Tons)
        FIG. 62 Latin America Lithium Compounds Market, 2016-2026
        FIG. 63 Latin America Lithium Compounds  Market, 2016-2026 (Kilo Tons)
        FIG. 64 Brazil Lithium Compounds Market, 2016-2026
        FIG. 65 Brazil Lithium Compounds  Market, 2016-2026 (Kilo Tons)
        FIG. 66 Mexico Lithium Compounds Market, 2016-2026
        FIG. 67 Mexico Lithium Compounds  Market, 2016-2026 (Kilo Tons)
        FIG. 68 Rest of Latin America Lithium Compounds Market, 2016-2026
        FIG. 69 Rest of Latin America Lithium Compounds  Market, 2016-2026 (Kilo Tons)
        FIG. 70 The Middle-East and Africa Lithium Compounds Market, 2016-2026
        FIG. 71 The Middle-East and Africa Lithium Compounds  Market, 2016-2026 (Kilo Tons)
        FIG. 72 GCC Countries Lithium Compounds Market, 2016-2026
        FIG. 73 GCC Countries Lithium Compounds  Market, 2016-2026 (Kilo Tons)
        FIG. 74 South Africa Lithium Compounds Market, 2016-2026
        FIG. 75 South Africa Lithium Compounds  Market, 2016-2026 (Kilo Tons)
        FIG. 76 Rest of Middle-East Africa Lithium Compounds Market, 2016-2026
        FIG. 77 Rest of Middle-East Africa Lithium Compounds  Market, 2016-2026 (Kilo Tons)
        FIG. 78 Global Lithium Compounds production and revenue, 2015-2025 (USD Million) (Kilo Tons)
        FIG. 79 North America Lithium Compounds production and revenue, 2015-2025 (USD Million) (Kilo Tons)
        FIG. 80 Europe Lithium Compounds production and revenue, 2015-2025 (USD Million) (Kilo Tons)
        FIG. 81 Asia Pacific Lithium Compounds production and revenue, 2015-2025 (USD Million) (Kilo Tons)
        FIG. 82 Latin America Lithium Compounds production and revenue, 2015-2025 (USD Million) (Kilo Tons)
        FIG. 83 Middle East and Africa Lithium Compounds production and revenue, 2015-2025 (USD Million) (Kilo Tons)
        FIG. 84 Competitor Market Share – Revenue
        FIG. 85 Competitor Market Share – Volume
        FIG. 86 Sociedad Quimica y Minera de Chile S.A. Revenue and Growth Rate
        FIG. 87 Sociedad Quimica y Minera de Chile S.A. Market Share
        FIG. 88 Millennial Lithium Corporation Revenue and Growth Rate
        FIG. 89 Millennial Lithium Corporation Market Share
        FIG. 90 Livent Corporation Revenue and Growth Rate
        FIG. 91 Livent Corporation Market Share
        FIG. 92 Neo Lithium Corporation Revenue and Growth Rate
        FIG. 93 Neo Lithium Corporation Market Share
        FIG. 94 Albemarle Corporation Revenue and Growth Rate
        FIG. 95 Albemarle Corporation Market Share
        FIG. 96 Nemaska Lithium Inc. Revenue and Growth Rate
        FIG. 97 Nemaska Lithium Inc. Market Share
        FIG. 98 Shandong Ruifu Lithium Industry Company Limited Revenue and Growth Rate
        FIG. 99 Shandong Ruifu Lithium Industry Company Limited Market Share
        FIG. 100 Tianqi Lithium Industries Inc. Revenue and Growth Rate
        FIG. 101 Tianqi Lithium Industries Inc. Market Share
        FIG. 102 Orocobre Limited Revenue and Growth Rate
        FIG. 103 Orocobre Limited Market Share
        FIG. 104 Ganfeng Lithium Company Limited Revenue and Growth Rate
        FIG. 105 Ganfeng Lithium Company Limited Market Share
        FIG. 106 Galaxy Resources Limited Revenue and Growth Rate
        FIG. 107 Galaxy Resources Limited Market Share
        FIG. 108 China Lithium Products Technology Company Limited Revenue and Growth Rate
        FIG. 109 China Lithium Products Technology Company Limited Market Share
        FIG. 110 Lithium Americas Revenue and Growth Rate
        FIG. 111 Lithium Americas Market Share
        FIG. 112 Sichuan Ni&Co Guorun New Materials Company Limited Revenue and Growth Rate
        FIG. 113 Sichuan Ni&Co Guorun New Materials Company Limited Market Share
        FIG. 114 Bacanora Lithium Revenue and Growth Rate
        FIG. 115 Bacanora Lithium Market Share
        FIG. 116 Shanghai China Lithium Industrial Company Limited Revenue and Growth Rate
        FIG. 117 Shanghai China Lithium Industrial Company Limited Market Share
        FIG. 118 Market Dynamics
        FIG. 119 Global Lithium Compounds – Value Chain Analysis
        FIG. 120 Key Mandates and Regulations
        FIG. 121 Technology Roadmap and Timeline
        FIG. 122 Market Attractiveness Analysis – By Derivative
        FIG. 123 Market Attractiveness Analysis – By End Use
        FIG. 124 Market Attractiveness Analysis – By Region
        FIG. 125 Manufacturing Cost Structure of Lithium Compounds
        FIG. 126 Lithium Compounds Industrial Chain Analysis
        FIG. 127 Market Channel
        FIG. 128 Marketing Channel Development Trend
        FIG. 129 Growth in World Gross Product, 2008-2018

        List of Tables

        TABLE 1 Global Lithium Compounds market, 2018 & 2025 (USD Million)
        TABLE 2 Global Lithium Compounds market, by Derivative, 2016-2026 (USD Million)
        TABLE 3 Global Lithium Compounds market, by Derivative, 2016-2026 (Kilo Tons)
        TABLE 4 Global Lithium Compounds market, by End Use, 2016-2026 (USD Million)
        TABLE 5 Global Lithium Compounds market, by End Use, 2016-2026 (Kilo Tons)
        TABLE 6 Global Lithium Compounds market, by region, 2016-2026 (USD Million)
        TABLE 7 Global Lithium Compounds market, by region, 2016-2026 (Kilo Tons)
        TABLE 8 North America Lithium Compounds Market, by Derivative, 2016-2026 (USD Million)
        TABLE 9 North America Lithium Compounds Market, by Derivative, 2016-2026 (Kilo Tons)
        TABLE 10 North America Lithium Compounds Market, by End Use, 2016-2026 (USD Million)
        TABLE 11 North America Lithium Compounds Market, by End Use, 2016-2026 (Kilo Tons)
        TABLE 12 Europe Lithium Compounds Market, by Derivative, 2016-2026 (USD Million)
        TABLE 13 Europe Lithium Compounds Market, by Derivative, 2016-2026 (Kilo Tons)
        TABLE 14 Europe Lithium Compounds Market, by End Use, 2016-2026 (USD Million)
        TABLE 15 Europe Lithium Compounds Market, by End Use, 2016-2026 (Kilo Tons)
        TABLE 16 Asia Pacific Lithium Compounds Market, by Derivative, 2016-2026 (USD Million)
        TABLE 17 Asia Pacific Lithium Compounds Market, by Derivative, 2016-2026 (Kilo Tons)
        TABLE 18 Asia Pacific Lithium Compounds Market, by End Use, 2016-2026 (USD Million)
        TABLE 19 Asia Pacific Lithium Compounds Market, by End Use, 2016-2026 (Kilo Tons)
        TABLE 20 Latin America Lithium Compounds Market, by Derivative, 2016-2026 (USD Million)
        TABLE 21 Latin America Lithium Compounds Market, by Derivative, 2016-2026 (Kilo Tons)
        TABLE 22 Latin America Lithium Compounds Market, by End Use, 2016-2026 (USD Million)
        TABLE 23 Latin America Lithium Compounds Market, by End Use, 2016-2026 (Kilo Tons)
        TABLE 24 The Middle-East and Africa Lithium Compounds Market, by Derivative, 2016-2026 (USD Million)
        TABLE 25 The Middle-East and Africa Lithium Compounds Market, by Derivative, 2016-2026 (Kilo Tons)
        TABLE 26 The Middle-East and Africa Lithium Compounds Market, by End Use, 2016-2026 (USD Million)
        TABLE 27 The Middle-East and Africa Lithium Compounds Market, by End Use, 2016-2026 (Kilo Tons)
        TABLE 28 North America Lithium Compounds Production, Consumption, Export, Import, 2016-2019
        TABLE 29 Europe Lithium Compounds Production, Consumption, Export, Import, 2016-2019
        TABLE 30 Asia Pacific Lithium Compounds Production, Consumption, Export, Import, 2016-2019
        TABLE 31 Latin America Lithium Compounds Production, Consumption, Export, Import, 2016-2019
        TABLE 32 Middle East & Africa Lithium Compounds Production, Consumption, Export, Import, 2016-2019
        TABLE 33 Global Lithium Compounds Market - Company Revenue Analysis 2016-2019 (USD Million)
        TABLE 34 Global Lithium Compounds Market - Company Revenue Share Analysis 2016-2019(%)
        TABLE 35 Global Lithium Compounds Market - Company Volume Analysis 2016-2019 (Kilo Tons)
        TABLE 36 Global Lithium Compounds Market - Company Volume Share Analysis 2016-2019(%)
        TABLE 37 Acquisitions and Mergers
        TABLE 38 New Product/Service Launch
        TABLE 39 Research & Development Activities
        TABLE 40 Market Drivers
        TABLE 41 Market Restraints
        TABLE 42 Market Opportunities
        TABLE 43 Production Base and Market Concentration Rate of Raw Material
        TABLE 44 Key Suppliers of Raw Materials
        TABLE 45 Raw Materials Sources of Lithium Compounds Major Manufacturers in 2016
        TABLE 46 Major Buyers of Lithium Compounds
        TABLE 47 Distributors/Traders of Lithium Compounds by Region

Industry Major Market Players

  • Sociedad Quimica y Minera de Chile S.A.
  • Millennial Lithium Corporation
  • Livent Corporation
  • Neo Lithium Corporation
  • Albemarle Corporation
  • Nemaska Lithium Inc.
  • Shandong Ruifu Lithium Industry Company Limited
  • Tianqi Lithium Industries Inc.
  • Orocobre Limited
  • Ganfeng Lithium Company Limited
  • Galaxy Resources Limited
  • China Lithium Products Technology Company Limited
  • Lithium Americas
  • Sichuan Ni&Co Guorun New Materials Company Limited
  • Bacanora Lithium
  • Shanghai China Lithium Industrial Company Limited.