Search Market Research Report

Discover Our Latest Reports
Discover Our Featured Reports
Discover Top Selling Reports

Jerry Cans Market Size, Share Global Analysis Report, 2020–2026

report img

Jerry Cans Market By Type (Below 10 Liters, 10-25 Liters, and Above 25 Liters) and By Application (Agrochemicals, Food & Beverages, Industrial Chemicals, and Petroleum & Lubricants): Global Industry Outlook, Market Size, Business Intelligence, Consumer Preferences, Statistical Surveys, Comprehensive Analysis, Historical Developments, Current Trends, and Forecast 2020–2026

Industry Insights

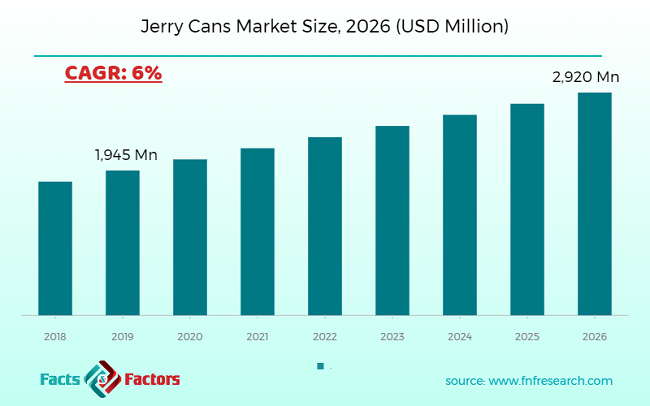
The Jerry Cans market report analyzes and notifies the industry statistics at the global as well as regional and country levels in order to acquire a thorough perspective of the entire Jerry Cans market. The historical and past insights are provided for FY 2016 to FY 2019 whereas projected trends are delivered for FY 2020 to FY 2026. The quantitative and numerical data is represented in terms of both volume (K Units) and value (USD Million) from FY 2016 – 2026.

This specialized and expertise-oriented industry research report scrutinizes the technical and commercial business outlook of the Jerry Cans industry. The report analyzes and declares the historical and current trends analysis of the Jerry Cans industry and subsequently recommends the projected trends anticipated to be observed in the Jerry Cans market during the upcoming years.

Jerry Cans Market Size

To know more about this report | Request Free Sample Copy

logoKey Insights from Primary Research

  • According to interview with industry participants, jerry cans has an extensive industrial application which has augmented the target market growth
  • Properties of jerry cans such as moisture-resistant, leakproof, and odorless features have surged the target market growth as well
  • The target market generated revenue of around USD1,826.22 Million in 2018
  • Europe was the major revenue-generating region followed by Asia Pacific in 2018
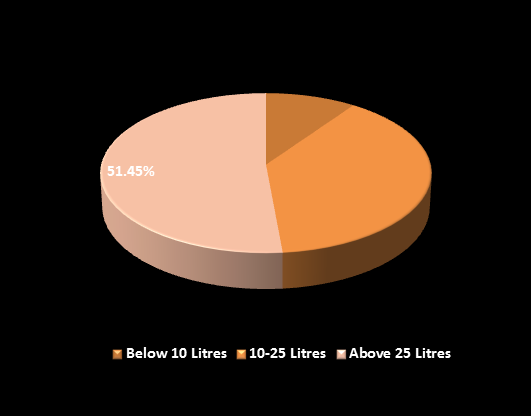
  • Above 25 liters and food & beverages of type and application segments were the major revenue-generating categories in 2018

logoKey Recommendations from Analysts

  • As per our analyst, several innovations associated with jerry cans are expected to create growth opportunities over the forecast period
  • The target market is estimated to generate revenue of around USD 2,920 Million by 2026.
  • The target market is projected to grow at a CAGR of around 6% over the forecast period
  • Asia Pacific is anticipated to generate major revenue in 2026
  • Above 25 liters and food & beverages of type and application segments are expected to be major revenue-generating categories in 2026

logoMarket Volume Share, by Type

To know more about this report | Request Free Sample Copy

The quantitative data is further underlined and reinforced by comprehensive qualitative data which comprises various across-the-board market dynamics. The rationales which directly or indirectly impact the Jerry Cansindustry are exemplified through parameters such as growth drivers, restraints, challenges, and opportunities among other impacting factors.

Throughout our research report, we have encompassed all the proven models and tools of industry analysis and extensively illustrated all the key business strategies and business models adopted in the Jerry Cans industry. The report provides an all-inclusive and detailed competitive landscape prevalent in the Jerry Cans market.

The report utilizes established industry analysis tools and models such as Porter’s Five Forces framework to analyze and recognize critical business strategies adopted by various stakeholders involved in the entire value chain of the Jerry Cans industry. The Jerry Cans market report additionally employs SWOT analysis and PESTLE analysis models for further in-depth analysis.

The report study further includes an in-depth analysis of industry players' market shares and provides an overview of leading players' market position in the Jerry Cans sector. Key strategic developments in the Jerry Cans market competitive landscape such as acquisitions & mergers, inaugurations of different products and services, partnerships & joint ventures, MoU agreements, VC & funding activities, R&D activities, and geographic expansion among other noteworthy activities by key players of the Jerry Cans market are appropriately highlighted in the report.

The rapid rise in the world lubricants & oil market and automobile sales is likely to boost the target market over the forecast period. Moreover, the increase in the petroleum, chemical, and lubricant industries has augmented the target market growth. Moreover, demand for jerry cans is enhanced by features such as a humidity-resistant factor, leak-proof quality, and odor reduction.

Recent innovations associated with jerry cans are estimated to fuel the target market over the forecast period. In addition, fuel containers such as scepter jerry cans and military jerry cans require more caution than water containers owing to the combustible as well as flammable nature of the liquid. This may harm the target market growth over the forecast period. Nevertheless, Jerry cans have huge applications in the craft beer industry which is likely to grow the Jerry Cans market in the near future.

The Jerry Cans market research report delivers an acute valuation and taxonomy of the Jerry Cans industry by practically splitting the market on the basis of different types, applications, and regions. Through the analysis of the historical and projected trends, all the segments and sub-segments were evaluated through the bottom-up approach, and different market sizes have been projected for FY 2020 to FY 2026. The regional segmentation of the Jerry Cans industry includes the complete classification of all the major continents including North America, Latin America, Europe, Asia Pacific, and the Middle East & Africa. Further, country-wise data for the Jerry Cans industry is provided for the leading economies of the world.

The Jerry Cans market is segmented based on Type and Application.  On the basis of type segmentation, the market is classified into 10 liters, 10-25 liters, and above 25 liters. In terms of Application segmentation, the market is bifurcated into agrochemicals, food & beverages, industrial chemicals, and petroleum & lubricants.

logoReport Scope

Report Attribute

Details

Market Size in 2019

USD 1,945 Million

Projected Market Size in 2026

USD 2,920 Million

CAGR Growth Rate

6% CAGR

Base Year

2019

Forecast Years

2020-2026

Key Market Players

Robert Buckle GmbH, Techno Packaging Industries, Greif, Inc., Sotralentz S.A.S., Elkhart Plastics Incorporated, Denios AG, Scepter Canada Inc., and Mauser Group B.V

Key Segment

By Type, By Application, By Region

Major Regions Covered

North America, Europe, Asia Pacific, Latin America, and the Middle East & Africa

Purchase Options

Request customized purchase options to meet your research needs. Explore purchase options

logoSome of the essential players operating in the Jerry Cans market, but not restricted to include:

  •  Robert Buckle GmbH
  •  Techno Packaging Industries
  •  Greif Inc.
  •  Sotralentz S.A.S.
  •  Elkhart Plastics Incorporated
  •  Denios AG
  •  Scepter Canada Inc.
  •  Mauser Group B.V.

The taxonomy of the Jerry Cans industry by its scope and segmentation is as follows:

logo By Type Segmentation Analysis(Customizable)

  • Below 10 Liters
  • 10-25 Liters
  • Above 25 Liters

logo By Application Segmentation Analysis(Customizable)

  • Agrochemicals
  • Food & Beverages
  • Industrial Chemicals
  • Petroleum & Lubricants

logo Regional Segmentation Analysis(Customizable)

  • North America
    • The U.S.
    • Canada
  • Europe
    • Germany
    • The UK
    • France
    • Spain
    • Italy
    • Rest of Europe
  • Asia Pacific
    • China
    • Japan
    • India
    • South Korea
    • Southeast Asia
    • Rest of Asia Pacific
  • Latin America
    • Brazil
    • Mexico
    • Rest of Latin America
  • Middle East & Africa
    • GCC
    • South Africa
    • Rest of the Middle East & Africa

Table of Content

  1. CHAPTER 1. Executive Summary
  2. CHAPTER 2. Jerry Cans market – Type Analysis
    1. 2.1. Global Jerry Cans Market – Type Overview
    2. 2.2. Global Jerry Cans Market Share, by Type, 2018 & 2025 (USD Million)
    3. 2.3. Global Jerry Cans Market share, by Type, 2018 & 2025 (K Units)
    4. 2.4. Below 10 Liters
      1. 2.4.1. Global Below 10 Liters Jerry Cans Market, 2016-2026 (USD Million)
      2. 2.4.2. Global Below 10 Liters Jerry Cans Market, 2016-2026 (K Units)
    5. 2.5. 10-25 Liters
      1. 2.5.1. Global 10-25 Liters Jerry Cans Market, 2016-2026 (USD Million)
      2. 2.5.2. Global 10-25 Liters Jerry Cans Market, 2016-2026 (K Units)
    6. 2.6. Above 25 Liters
      1. 2.6.1. Global Above 25 Liters Jerry Cans Market, 2016-2026 (USD Million)
      2. 2.6.2. Global Above 25 Liters Jerry Cans Market, 2016-2026 (K Units)
  3. CHAPTER 3. Jerry Cans market – Application Analysis
    1. 3.1. Global Jerry Cans Market – Application Overview
    2. 3.2. Global Jerry Cans Market Share, by Application, 2018 & 2025 (USD Million)
    3. 3.3. Global Jerry Cans Market share, by Application, 2018 & 2025 (K Units)
    4. 3.4. Agrochemicals
      1. 3.4.1. Global Agrochemicals Jerry Cans Market, 2016-2026 (USD Million)
      2. 3.4.2. Global Agrochemicals Jerry Cans Market, 2016-2026 (K Units)
    5. 3.5. Food & Beverages
      1. 3.5.1. Global Food & Beverages Jerry Cans Market, 2016-2026 (USD Million)
      2. 3.5.2. Global Food & Beverages Jerry Cans Market, 2016-2026 (K Units)
    6. 3.6. Industrial Chemicals
      1. 3.6.1. Global Industrial Chemicals Jerry Cans Market, 2016-2026 (USD Million)
      2. 3.6.2. Global Industrial Chemicals Jerry Cans Market, 2016-2026 (K Units)
    7. 3.7. Petroleum & Lubricants
      1. 3.7.1. Global Petroleum & Lubricants Jerry Cans Market, 2016-2026 (USD Million)
      2. 3.7.2. Global Petroleum & Lubricants Jerry Cans Market, 2016-2026 (K Units)
  4. CHAPTER 4. Jerry Cans market – Regional Analysis
    1. 4.1. Global Jerry Cans Market Regional Overview
    2. 4.2. Global Jerry Cans Market Share, by Region, 2018 & 2025 (Value)
    3. 4.3. Global Jerry Cans Market Share, by Region, 2018 & 2025 (Volume)
    4. 4.4. North America
      1. 4.4.1. North America Jerry Cans Market size and forecast, 2016-2026
      2. 4.4.2. North America Jerry Cans Market, by Country, 2018 - 2025 (USD Million)
      3. 4.4.3. North America Market size and forecast, 2016-2026 (K Units)
      4. 4.4.4. North America Jerry Cans Market, by Country, 2018 - 2025 (K Units)
      5. 4.4.5. North America Jerry Cans Market, by Type, 2016-2026
        1. 4.4.5.1. North America Jerry Cans Market, by Type, 2016-2026 (USD Million)
        2. 4.4.5.2. North America Jerry Cans Market, by Type, 2016-2026 (K Units)
      6. 4.4.6. North America Jerry Cans Market, by Application, 2016-2026
        1. 4.4.6.1. North America Jerry Cans Market, by Application, 2016-2026 (USD Million)
        2. 4.4.6.2. North America Jerry Cans Market, by Application, 2016-2026 (K Units)
      7. 4.4.7. U.S.
        1. 4.4.7.1. U.S. Market size and forecast, 2016-2026 (USD Million)
        2. 4.4.7.2. U.S. Market size and forecast, 2016-2026 (K Units)
      8. 4.4.8. Canada
        1. 4.4.8.1. Canada Market size and forecast, 2016-2026 (USD Million)
        2. 4.4.8.2. Canada Market size and forecast, 2016-2026 (K Units)
    5. 4.5. Europe
      1. 4.5.1. Europe Jerry Cans Market size and forecast, 2016-2026
      2. 4.5.2. Europe Jerry Cans Market, by Country, 2018 - 2025 (USD Million)
      3. 4.5.3. Europe Market size and forecast, 2016-2026 (K Units)
      4. 4.5.4. Europe Jerry Cans Market, by Country, 2018 - 2025 (K Units)
      5. 4.5.5. Europe Jerry Cans Market, by Type, 2016-2026
        1. 4.5.5.1. Europe Jerry Cans Market, by Type, 2016-2026 (USD Million)
        2. 4.5.5.2. Europe Jerry Cans Market, by Type, 2016-2026 (K Units)
      6. 4.5.6. Europe Jerry Cans Market, by Application, 2016-2026
        1. 4.5.6.1. Europe Jerry Cans Market, by Application, 2016-2026 (USD Million)
        2. 4.5.6.2. Europe Jerry Cans Market, by Application, 2016-2026 (K Units)
      7. 4.5.7. Germany
        1. 4.5.7.1. Germany Market size and forecast, 2016-2026 (USD Million)
        2. 4.5.7.2. Germany Market size and forecast, 2016-2026 (K Units)
      8. 4.5.8. France
        1. 4.5.8.1. France Market size and forecast, 2016-2026 (USD Million)
        2. 4.5.8.2. France Market size and forecast, 2016-2026 (K Units)
      9. 4.5.9. U.K.
        1. 4.5.9.1. U.K. Market size and forecast, 2016-2026 (USD Million)
        2. 4.5.9.2. U.K. Market size and forecast, 2016-2026 (K Units)
      10. 4.5.10. Italy
        1. 4.5.10.1. Italy Market size and forecast, 2016-2026 (USD Million)
        2. 4.5.10.2. Italy Market size and forecast, 2016-2026 (K Units)
      11. 4.5.11. Spain
        1. 4.5.11.1. Spain Market size and forecast, 2016-2026 (USD Million)
        2. 4.5.11.2. Spain Market size and forecast, 2016-2026 (K Units)
      12. 4.5.12. Rest of Europe
        1. 4.5.12.1. Rest of Europe Market size and forecast, 2016-2026 (USD Million)
        2. 4.5.12.2. Rest of Europe Market size and forecast, 2016-2026 (K Units)
    6. 4.6. Asia Pacific
      1. 4.6.1. Asia Pacific Jerry Cans Market size and forecast, 2016-2026
      2. 4.6.2. Asia Pacific Jerry Cans Market, by Country, 2018 - 2025 (USD Million)
      3. 4.6.3. Asia Pacific Market size and forecast, 2016-2026 (K Units)
      4. 4.6.4. Asia Pacific Jerry Cans Market, by Country, 2018 - 2025 (K Units)
      5. 4.6.5. Asia Pacific Jerry Cans Market, by Type, 2016-2026
        1. 4.6.5.1. Asia Pacific Jerry Cans Market, by Type, 2016-2026 (USD Million)
        2. 4.6.5.2. Asia Pacific Jerry Cans Market, by Type, 2016-2026 (K Units)
      6. 4.6.6. Asia Pacific Jerry Cans Market, by Application, 2016-2026
        1. 4.6.6.1. Asia Pacific Jerry Cans Market, by Application, 2016-2026 (USD Million)
        2. 4.6.6.2. Asia Pacific Jerry Cans Market, by Application, 2016-2026 (K Units)
      7. 4.6.7. China
        1. 4.6.7.1. China Market size and forecast, 2016-2026 (USD Million)
        2. 4.6.7.2. China Market size and forecast, 2016-2026 (K Units)
      8. 4.6.8. Japan
        1. 4.6.8.1. Japan Market size and forecast, 2016-2026 (USD Million)
        2. 4.6.8.2. Japan Market size and forecast, 2016-2026 (K Units)
      9. 4.6.9. India
        1. 4.6.9.1. India Market size and forecast, 2016-2026 (USD Million)
        2. 4.6.9.2. India Market size and forecast, 2016-2026 (K Units)
      10. 4.6.10. South Korea
        1. 4.6.10.1. South Korea Market size and forecast, 2016-2026 (USD Million)
        2. 4.6.10.2. South Korea Market size and forecast, 2016-2026 (K Units)
      11. 4.6.11. South-East Asia
        1. 4.6.11.1. South-East Asia Market size and forecast, 2016-2026 (USD Million)
        2. 4.6.11.2. South-East Asia Market size and forecast, 2016-2026 (K Units)
      12. 4.6.12. Rest of Asia Pacific
        1. 4.6.12.1. Rest of Asia Pacific Market size and forecast, 2016-2026 (USD Million)
        2. 4.6.12.2. Rest of Asia Pacific Market size and forecast, 2016-2026 (K Units)
    7. 4.7. Latin America
      1. 4.7.1. Latin America Jerry Cans Market size and forecast, 2016-2026
      2. 4.7.2. Latin America Jerry Cans Market, by Country, 2018 - 2025 (USD Million)
      3. 4.7.3. Latin America Market size and forecast, 2016-2026 (K Units)
      4. 4.7.4. Latin America Jerry Cans Market, by Country, 2018 - 2025 (K Units)
      5. 4.7.5. Latin America Jerry Cans Market, by Type, 2016-2026
        1. 4.7.5.1. Latin America Jerry Cans Market, by Type, 2016-2026 (USD Million)
        2. 4.7.5.2. Latin America Jerry Cans Market, by Type, 2016-2026 (K Units)
      6. 4.7.6. Latin America Jerry Cans Market, by Application, 2016-2026
        1. 4.7.6.1. Latin America Jerry Cans Market, by Application, 2016-2026 (USD Million)
        2. 4.7.6.2. Latin America Jerry Cans Market, by Application, 2016-2026 (K Units)
      7. 4.7.7. Brazil
        1. 4.7.7.1. Brazil Market size and forecast, 2016-2026 (USD Million)
        2. 4.7.7.2. Brazil Market size and forecast, 2016-2026 (K Units)
      8. 4.7.8. Mexico
        1. 4.7.8.1. Mexico Market size and forecast, 2016-2026 (USD Million)
        2. 4.7.8.2. Mexico Market size and forecast, 2016-2026 (K Units)
      9. 4.7.9. Rest of Latin America
        1. 4.7.9.1. Rest of Latin America Market size and forecast, 2016-2026 (USD Million)
        2. 4.7.9.2. Rest of Latin America Market size and forecast, 2016-2026 (K Units)
    8. 4.8. The Middle-East and Africa
      1. 4.8.1. The Middle-East and Africa Jerry Cans Market size and forecast, 2016-2026
      2. 4.8.2. The Middle-East and Africa Jerry Cans Market, by Country, 2018 - 2025 (USD Million)
      3. 4.8.3. The Middle-East and Africa Market size and forecast, 2016-2026 (K Units)
      4. 4.8.4. The Middle-East and Africa Jerry Cans Market, by Country, 2018 - 2025 (K Units)
      5. 4.8.5. The Middle-East and Africa Jerry Cans Market, by Type, 2016-2026
        1. 4.8.5.1. The Middle-East and Africa Jerry Cans Market, by Type, 2016-2026 (USD Million)
        2. 4.8.5.2. The Middle-East and Africa Jerry Cans Market, by Type, 2016-2026 (K Units)
      6. 4.8.6. The Middle-East and Africa Jerry Cans Market, by Application, 2016-2026
        1. 4.8.6.1. The Middle-East and Africa Jerry Cans Market, by Application, 2016-2026 (USD Million)
        2. 4.8.6.2. The Middle-East and Africa Jerry Cans Market, by Application, 2016-2026 (K Units)
      7. 4.8.7. GCC Countries
        1. 4.8.7.1. GCC Countries Market size and forecast, 2016-2026 (USD Million)
        2. 4.8.7.2. GCC Countries Market size and forecast, 2016-2026 (K Units)
      8. 4.8.8. South Africa
        1. 4.8.8.1. South Africa Market size and forecast, 2016-2026 (USD Million)
        2. 4.8.8.2. South Africa Market size and forecast, 2016-2026 (K Units)
      9. 4.8.9. Rest of Middle-East Africa
        1. 4.8.9.1. Rest of Middle-East Africa Market size and forecast, 2016-2026 (USD Million)
        2. 4.8.9.2. Rest of Middle-East Africa Market size and forecast, 2016-2026 (K Units)
  5. CHAPTER 5. Jerry Cans Production, Consumption, Export, Import by Regions
    1. 5.1. Global Jerry Cans production and revenue, 2015-2025 (USD Million) (K Units)
    2. 5.2. Global Import and Export Analysis, by Region
  6. CHAPTER 6. Jerry Cans market – Competitive Landscape
    1. 6.1. Competitor Market Share – Revenue
    2. 6.2. Market Concentration Rate Analysis, Top 3 and Top 5 Players
    3. 6.3. Competitor Market Share – Volume
    4. 6.4. Strategic Development
      1. 6.4.1. Acquisitions and Mergers
      2. 6.4.2. New Products
      3. 6.4.3. Research & Development Activities
  7. CHAPTER 7. Company Profiles
    1. 7.1. Robert Buckle GmbH
      1. 7.1.1. Company Overview
      2. 7.1.2. Robert Buckle GmbH Sales, Revenue, Price, and Gross Margin
      3. 7.1.3. Product portfolio
      4. 7.1.4. Recent initiatives
    2. 7.2. Techno Packaging Industries
      1. 7.2.1. Company Overview
      2. 7.2.2. Techno Packaging Industries Sales, Revenue, Price, and Gross Margin
      3. 7.2.3. Product portfolio
      4. 7.2.4. Recent initiatives
    3. 7.3. Greif, Inc.
      1. 7.3.1. Company Overview
      2. 7.3.2. Greif, Inc. Sales, Revenue, Price, and Gross Margin
      3. 7.3.3. Product portfolio
      4. 7.3.4. Recent initiatives
    4. 7.4. Sotralentz S.A.S.
      1. 7.4.1. Company Overview
      2. 7.4.2. Sotralentz S.A.S. Sales, Revenue, Price, and Gross Margin
      3. 7.4.3. Product portfolio
      4. 7.4.4. Recent initiatives
    5. 7.5. Elkhart Plastics Incorporated
      1. 7.5.1. Company Overview
      2. 7.5.2. Elkhart Plastics Incorporated Sales, Revenue, Price, and Gross Margin
      3. 7.5.3. Product portfolio
      4. 7.5.4. Recent initiatives
    6. 7.6. Denios AG
      1. 7.6.1. Company Overview
      2. 7.6.2. Denios AG Sales, Revenue, Price, and Gross Margin
      3. 7.6.3. Product portfolio
      4. 7.6.4. Recent initiatives
    7. 7.7. Scepter Canada Inc.
      1. 7.7.1. Company Overview
      2. 7.7.2. Scepter Canada Inc. Sales, Revenue, Price, and Gross Margin
      3. 7.7.3. Product portfolio
      4. 7.7.4. Recent initiatives
    8. 7.8. Mauser Group B.V
      1. 7.8.1. Company Overview
      2. 7.8.2. Mauser Group B.V Sales, Revenue, Price, and Gross Margin
      3. 7.8.3. Product portfolio
      4. 7.8.4. Recent initiatives
    9. 7.9. Others
      1. 7.9.1. Company Overview
      2. 7.9.2. Others Sales, Revenue, Price, and Gross Margin
      3. 7.9.3. Product portfolio
      4. 7.9.4. Recent initiatives
  8. CHAPTER 8. Jerry Cans — Industry Analysis
    1. 8.1. Introduction and Taxonomy
    2. 8.2. Jerry Cans Market – Key Trends
      1. 8.2.1. Market Drivers
      2. 8.2.2. Market Restraints
      3. 8.2.3. Market Opportunities
    3. 8.3. Value Chain Analysis
    4. 8.4. Key Mandates and Regulations
    5. 8.5. Technology Roadmap and Timeline
    6. 8.6. Jerry Cans market – Attractiveness Analysis
      1. 8.6.1. By Type
      2. 8.6.2. By Application
      3. 8.6.3. By Region
  9. CHAPTER 9. Raw Material analysis
    1. 9.1. Jerry Cans Key Raw Material Analysis
      1. 9.1.1. Key Raw Materials
      2. 9.1.2. Price Trend of Key Raw Materials
    2. 9.2. Key Suppliers of Raw Materials
    3. 9.3. Proportion of Manufacturing Cost Structure
      1. 9.3.1. Raw Materials
      2. 9.3.2. Labor Cost
    4. 9.4. Manufacturing Expenses Analysis of Jerry Cans
  10. CHAPTER 10. Industrial Chain, Sourcing Strategy and Downstream Buyers
    1. 10.1. Jerry Cans Industrial Chain Analysis
    2. 10.2. Upstream Raw Materials Sourcing
      1. 10.2.1. Risk Mitigation:
      2. 10.2.2. Supplier Relationships:
      3. 10.2.3. Business Processes:
      4. 10.2.4. Securing the Product:
    3. 10.3. Raw Materials Sources of Jerry Cans Major Manufacturers in 2016
    4. 10.4. Downstream Buyers
    5. 10.5. Distributors/Traders List
  11. CHAPTER 11. Marketing Strategy Analysis, Distributors
    1. 11.1. Marketing Channel
    2. 11.2. Direct Marketing
    3. 11.3. Indirect Marketing
    4. 11.4. Marketing Channel Development Trend
    5. 11.5. Economic/Political Environmental Change
  12. CHAPTER 12. Report Conclusion
  13. CHAPTER 13. Research Approach & Methodology
    1. 13.1. Report Description
    2. 13.2. Research Scope
    3. 13.3. Research Methodology
      1. 13.3.1. Secondary Research
      2. 13.3.2. Primary Research
      3. 13.3.3. Models
        1. 13.3.3.1. Company Share Analysis Model
        2. 13.3.3.2. Revenue Based Modeling
        3. 13.3.3.3. Research Limitations

        List of Figures

        FIG. 1 Global Jerry Cans Market, 2016-2026 (USD Million)
        FIG. 2 Global Jerry Cans Market Share, by Type, 2018 & 2025 (USD Million)
        FIG. 3 Global Jerry Cans Market share, by Type, 2018 & 2025 (K Units)
        FIG. 4 Global Below 10 Liters Jerry Cans Market, 2016-2026 (USD Million)
        FIG. 5 Global Below 10 Liters Jerry Cans  Market, 2016-2026 (K Units)
        FIG. 6 Global 10-25 Liters Jerry Cans Market, 2016-2026 (USD Million)
        FIG. 7 Global 10-25 Liters Jerry Cans  Market, 2016-2026 (K Units)
        FIG. 8 Global Above 25 Liters Jerry Cans Market, 2016-2026 (USD Million)
        FIG. 9 Global Above 25 Liters Jerry Cans  Market, 2016-2026 (K Units)
        FIG. 10 Global Jerry Cans Market Share, by Application, 2018 & 2025 (USD Million)
        FIG. 11 Global Jerry Cans Market share, by Application, 2018 & 2025 (K Units)
        FIG. 12 Global Agrochemicals Jerry Cans Market, 2016-2026 (USD Million)
        FIG. 13 Global Agrochemicals Jerry Cans  Market, 2016-2026 (K Units)
        FIG. 14 Global Food & Beverages Jerry Cans Market, 2016-2026 (USD Million)
        FIG. 15 Global Food & Beverages Jerry Cans  Market, 2016-2026 (K Units)
        FIG. 16 Global Industrial Chemicals Jerry Cans Market, 2016-2026 (USD Million)
        FIG. 17 Global Industrial Chemicals Jerry Cans  Market, 2016-2026 (K Units)
        FIG. 18 Global Petroleum & Lubricants Jerry Cans Market, 2016-2026 (USD Million)
        FIG. 19 Global Petroleum & Lubricants Jerry Cans  Market, 2016-2026 (K Units)
        FIG. 20 Global Jerry Cans Market Share, by Region, 2018 & 2025
        FIG. 21 Global Jerry Cans Market Share, by Region, 2018 & 2025
        FIG. 22 North America Jerry Cans Market, 2016-2026
        FIG. 23 North America Jerry Cans  Market, 2016-2026 (K Units)
        FIG. 24 U.S. Jerry Cans Market, 2016-2026
        FIG. 25 U.S. Jerry Cans  Market, 2016-2026 (K Units)
        FIG. 26 Canada Jerry Cans Market, 2016-2026
        FIG. 27 Canada Jerry Cans  Market, 2016-2026 (K Units)
        FIG. 28 Europe Jerry Cans Market, 2016-2026
        FIG. 29 Europe Jerry Cans  Market, 2016-2026 (K Units)
        FIG. 30 Germany Jerry Cans Market, 2016-2026
        FIG. 31 Germany Jerry Cans  Market, 2016-2026 (K Units)
        FIG. 32 France Jerry Cans Market, 2016-2026
        FIG. 33 France Jerry Cans  Market, 2016-2026 (K Units)
        FIG. 34 U.K. Jerry Cans Market, 2016-2026
        FIG. 35 U.K. Jerry Cans  Market, 2016-2026 (K Units)
        FIG. 36 Italy Jerry Cans Market, 2016-2026
        FIG. 37 Italy Jerry Cans  Market, 2016-2026 (K Units)
        FIG. 38 Spain Jerry Cans Market, 2016-2026
        FIG. 39 Spain Jerry Cans  Market, 2016-2026 (K Units)
        FIG. 40 Rest of Europe Jerry Cans Market, 2016-2026
        FIG. 41 Rest of Europe Jerry Cans  Market, 2016-2026 (K Units)
        FIG. 42 Asia Pacific Jerry Cans Market, 2016-2026
        FIG. 43 Asia Pacific Jerry Cans  Market, 2016-2026 (K Units)
        FIG. 44 China Jerry Cans Market, 2016-2026
        FIG. 45 China Jerry Cans  Market, 2016-2026 (K Units)
        FIG. 46 Japan Jerry Cans Market, 2016-2026
        FIG. 47 Japan Jerry Cans  Market, 2016-2026 (K Units)
        FIG. 48 India Jerry Cans Market, 2016-2026
        FIG. 49 India Jerry Cans  Market, 2016-2026 (K Units)
        FIG. 50 South  Korea Jerry Cans Market, 2016-2026
        FIG. 51 South  Korea Jerry Cans  Market, 2016-2026 (K Units)
        FIG. 52 South-East Asia Jerry Cans Market, 2016-2026
        FIG. 53 South-East Asia Jerry Cans  Market, 2016-2026 (K Units)
        FIG. 54 Rest of Asia Pacific Jerry Cans Market, 2016-2026
        FIG. 55 Rest of Asia Pacific Jerry Cans  Market, 2016-2026 (K Units)
        FIG. 56 Latin America Jerry Cans Market, 2016-2026
        FIG. 57 Latin America Jerry Cans  Market, 2016-2026 (K Units)
        FIG. 58 Brazil Jerry Cans Market, 2016-2026
        FIG. 59 Brazil Jerry Cans  Market, 2016-2026 (K Units)
        FIG. 60 Mexico Jerry Cans Market, 2016-2026
        FIG. 61 Mexico Jerry Cans  Market, 2016-2026 (K Units)
        FIG. 62 Rest of Latin America Jerry Cans Market, 2016-2026
        FIG. 63 Rest of Latin America Jerry Cans  Market, 2016-2026 (K Units)
        FIG. 64 The Middle-East and Africa Jerry Cans Market, 2016-2026
        FIG. 65 The Middle-East and Africa Jerry Cans  Market, 2016-2026 (K Units)
        FIG. 66 GCC Countries Jerry Cans Market, 2016-2026
        FIG. 67 GCC Countries Jerry Cans  Market, 2016-2026 (K Units)
        FIG. 68 South Africa Jerry Cans Market, 2016-2026
        FIG. 69 South Africa Jerry Cans  Market, 2016-2026 (K Units)
        FIG. 70 Rest of Middle-East Africa Jerry Cans Market, 2016-2026
        FIG. 71 Rest of Middle-East Africa Jerry Cans  Market, 2016-2026 (K Units)
        FIG. 72 Global Jerry Cans production and revenue, 2015-2025 (USD Million) (K Units)
        FIG. 73 North America Jerry Cans production and revenue, 2015-2025 (USD Million) (K Units)
        FIG. 74 Europe Jerry Cans production and revenue, 2015-2025 (USD Million) (K Units)
        FIG. 75 Asia Pacific Jerry Cans production and revenue, 2015-2025 (USD Million) (K Units)
        FIG. 76 Latin America Jerry Cans production and revenue, 2015-2025 (USD Million) (K Units)
        FIG. 77 Middle East and Africa Jerry Cans production and revenue, 2015-2025 (USD Million) (K Units)
        FIG. 78 Competitor Market Share – Revenue
        FIG. 79 Competitor Market Share – Volume
        FIG. 80 Robert Buckle GmbH Revenue and Growth Rate
        FIG. 81 Robert Buckle GmbH Market Share
        FIG. 82 Techno Packaging Industries Revenue and Growth Rate
        FIG. 83 Techno Packaging Industries Market Share
        FIG. 84 Greif, Inc. Revenue and Growth Rate
        FIG. 85 Greif, Inc. Market Share
        FIG. 86 Sotralentz S.A.S. Revenue and Growth Rate
        FIG. 87 Sotralentz S.A.S. Market Share
        FIG. 88 Elkhart Plastics Incorporated Revenue and Growth Rate
        FIG. 89 Elkhart Plastics Incorporated Market Share
        FIG. 90 Denios AG Revenue and Growth Rate
        FIG. 91 Denios AG Market Share
        FIG. 92 Scepter Canada Inc. Revenue and Growth Rate
        FIG. 93 Scepter Canada Inc. Market Share
        FIG. 94 Mauser Group B.V Revenue and Growth Rate
        FIG. 95 Mauser Group B.V Market Share
        FIG. 96 Others Revenue and Growth Rate
        FIG. 97 Others Market Share
        FIG. 98 Market Dynamics
        FIG. 99 Global Jerry Cans – Value Chain Analysis
        FIG. 100 Key Mandates and Regulations
        FIG. 101 Technology Roadmap and Timeline
        FIG. 102 Market Attractiveness Analysis – By Type
        FIG. 103 Market Attractiveness Analysis – By Application
        FIG. 104 Market Attractiveness Analysis – By Region
        FIG. 105 Manufacturing Cost Structure of Jerry Cans
        FIG. 106 Jerry Cans Industrial Chain Analysis
        FIG. 107 Market Channel
        FIG. 108 Marketing Channel Development Trend
        FIG. 109 Growth in World Gross Product, 2008-2018

        List of Tables

        TABLE 1 Global Jerry Cans market, 2018 & 2025 (USD Million)
        TABLE 2 Global Jerry Cans market, by Type, 2016-2026 (USD Million)
        TABLE 3 Global Jerry Cans market, by Type, 2016-2026 (K Units)
        TABLE 4 Global Jerry Cans market, by Application, 2016-2026 (USD Million)
        TABLE 5 Global Jerry Cans market, by Application, 2016-2026 (K Units)
        TABLE 6 Global Jerry Cans market, by region, 2016-2026 (USD Million)
        TABLE 7 Global Jerry Cans market, by region, 2016-2026 (K Units)
        TABLE 8 North America Jerry Cans Market, by Type, 2016-2026 (USD Million)
        TABLE 9 North America Jerry Cans Market, by Type, 2016-2026 (K Units)
        TABLE 10 North America Jerry Cans Market, by Application, 2016-2026 (USD Million)
        TABLE 11 North America Jerry Cans Market, by Application, 2016-2026 (K Units)
        TABLE 12 Europe Jerry Cans Market, by Type, 2016-2026 (USD Million)
        TABLE 13 Europe Jerry Cans Market, by Type, 2016-2026 (K Units)
        TABLE 14 Europe Jerry Cans Market, by Application, 2016-2026 (USD Million)
        TABLE 15 Europe Jerry Cans Market, by Application, 2016-2026 (K Units)
        TABLE 16 Asia Pacific Jerry Cans Market, by Type, 2016-2026 (USD Million)
        TABLE 17 Asia Pacific Jerry Cans Market, by Type, 2016-2026 (K Units)
        TABLE 18 Asia Pacific Jerry Cans Market, by Application, 2016-2026 (USD Million)
        TABLE 19 Asia Pacific Jerry Cans Market, by Application, 2016-2026 (K Units)
        TABLE 20 Latin America Jerry Cans Market, by Type, 2016-2026 (USD Million)
        TABLE 21 Latin America Jerry Cans Market, by Type, 2016-2026 (K Units)
        TABLE 22 Latin America Jerry Cans Market, by Application, 2016-2026 (USD Million)
        TABLE 23 Latin America Jerry Cans Market, by Application, 2016-2026 (K Units)
        TABLE 24 The Middle-East and Africa Jerry Cans Market, by Type, 2016-2026 (USD Million)
        TABLE 25 The Middle-East and Africa Jerry Cans Market, by Type, 2016-2026 (K Units)
        TABLE 26 The Middle-East and Africa Jerry Cans Market, by Application, 2016-2026 (USD Million)
        TABLE 27 The Middle-East and Africa Jerry Cans Market, by Application, 2016-2026 (K Units)
        TABLE 28 North America Jerry Cans Production, Consumption, Export, Import, 2016-2019
        TABLE 29 Europe Jerry Cans Production, Consumption, Export, Import, 2016-2019
        TABLE 30 Asia Pacific Jerry Cans Production, Consumption, Export, Import, 2016-2019
        TABLE 31 Latin America Jerry Cans Production, Consumption, Export, Import, 2016-2019
        TABLE 32 Middle East & Africa Jerry Cans Production, Consumption, Export, Import, 2016-2019
        TABLE 33 Global Jerry Cans Market - Company Revenue Analysis 2016-2019 (USD Million)
        TABLE 34 Global Jerry Cans Market - Company Revenue Share Analysis 2016-2019(%)
        TABLE 35 Global Jerry Cans Market - Company Volume Analysis 2016-2019 (K Units)
        TABLE 36 Global Jerry Cans Market - Company Volume Share Analysis 2016-2019(%)
        TABLE 37 Acquisitions and Mergers
        TABLE 38 New Product/Service Launch
        TABLE 39 Research & Development Activities
        TABLE 40 Market Drivers
        TABLE 41 Market Restraints
        TABLE 42 Market Opportunities
        TABLE 43 Production Base and Market Concentration Rate of Raw Material
        TABLE 44 Key Suppliers of Raw Materials
        TABLE 45 Raw Materials Sources of Jerry Cans Major Manufacturers in 2016
        TABLE 46 Major Buyers of Jerry Cans
        TABLE 47 Distributors/Traders of Jerry Cans by Region

Industry Major Market Players

  •  Robert Buckle GmbH
  •  Techno Packaging Industries
  •  Greif Inc..
  •  Sotralentz S.A.S.
  •  Elkhart Plastics Incorporated
  •  Denios AG
  •  Scepter Canada Inc.
  •  Mauser Group B.V.