Search Market Research Report

Discover Our Latest Reports
Discover Our Featured Reports
Discover Top Selling Reports

Industrial Solvents Market Size, Share Global Analysis Report, 2020–2026

report img

Industrial Solvents Market By Product (Hydrocarbons, Acids, Esters, Glycols, Aromatics, Alcohols, Ketones, Ethers and Other) and By Application (Dissolution Agent, Cleaning and Degreasing, Paints and Coatings, Applications in Printing Products and Cleaning, Cosmetics, Printing Ink, Adhesives and Other): Global Industry Outlook, Market Size, Business Intelligence, Consumer Preferences, Statistical Surveys, Comprehensive Analysis, Historical Developments, Current Trends, and Forecast 2020–2026

Industry Insights

The industrial solvents market report analyzes and notifies the industry statistics at the global as well as regional and country levels in order to acquire a thorough perspective of the entire industrial solvents market. The historical and past insights are provided for FY 2016 to FY 2019 whereas projected trends are delivered for FY 2020 to FY 2026. The quantitative and numerical data is represented in terms of both volume (Kilo Tons) and value (USD Million) from FY 2016 – 2026.

This specialized and expertise-oriented industry research report scrutinizes the technical and commercial business outlook of the industrial solvents industry. The report analyzes and declares the historical and current trends analysis of the industrial solvents industry and subsequently recommends the projected trends anticipated to be observed in the industrial solvents market during the upcoming years.

Industrial Solvents Market Size

To know more about this report | Request Free Sample Copy

logoKey Insights from Primary Research

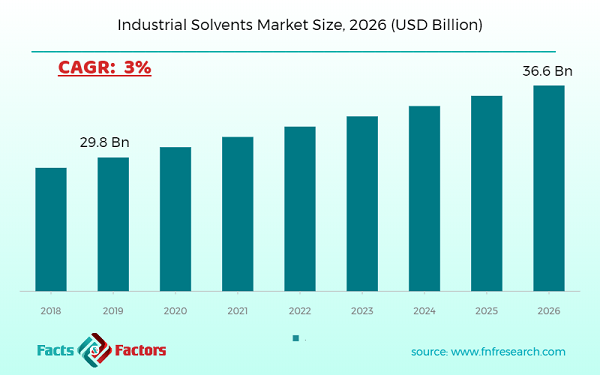
  • As per our primary respondents, the industrial solvents market is set to grow annually at a rate of around 3%
  • It was established through primary research that the industrial solvents market was valued at around USD 29.8 billion in 2019
  • The Asia Pacific held the largest market share of industrial solvents in terms of revenue in 2019
  • The “Hydrocarbons” category, on the basis of product segmentation, was the leading revenue-generating category in 2019
  • The “Dissolution Agent” category, on the basis of application segmentation, was the leading revenue-generating in 2019

logoKey Recommendations from Analysts

  • As per our analysts, rapid industrialization in emerging economies has led to noteworthy demand for industrial solvents market
  • The rising concern for environmental issues caused due to solvents may hamper the growth of this market
  • The rising infrastructure sector in developing countries coupled with ongoing research for untapped uses is likely to open new opportunities for the industrial solvent market in the coming years
  • Stringent regulation on the manufacturing of industrial solvents is one of the restraints for the market
  • Surging demand for industrial solvents in adhesives, paint industries, and printing drives the industrial solvents market

logoIndustrial Solvents Market Share – By Region

Industrial Solvents Market

To know more about this report | Request Free Sample Copy

The quantitative data is further underlined and reinforced by comprehensive qualitative data which comprises various across-the-board market dynamics. The rationales which directly or indirectly impact the industrial solvents industry are exemplified through parameters such as growth drivers, restraints, challenges, and opportunities among other impacting factors.

Throughout our research report, we have encompassed all the proven models and tools of industry analysis and extensively illustrated all the key business strategies and business models adopted in the industrial solvent industry. The report provides an all-inclusive and detailed competitive landscape prevalent in the industrial solvent market.

The report utilizes established industry analysis tools and models such as Porter’s Five Forces framework to analyze and recognize critical business strategies adopted by various stakeholders involved in the entire value chain of the industrial solvents industry. The industrial solvents market report additionally employs SWOT analysis and PESTLE analysis models for further in-depth analysis.

The report study further includes an in-depth analysis of industry players' market shares and provides an overview of leading players' market position in the industrial solvents sector. Key strategic developments in the industrial solvents market competitive landscape such as acquisitions & mergers, inaugurations of different products and services, partnerships & joint ventures, MoU agreements, VC & funding activities, R&D activities, and geographic expansion among other noteworthy activities by key players of the industrial solvents market are appropriately highlighted in the report.

Increasing demand from the paint and printing industries is mostly driving the market for industrial solvents. Besides, increasing urbanization and rapidly evolving industrialization is leading to demand growth for industrial solvents.

Yet, the government's strict regulations for the use of solvents due to their impact on the environment hinder this market's growth. Nevertheless, the growing demand for infrastructure from emerging economies is expected in the near future to experience a lucrative opportunity.

The industrial solvents market research report delivers an acute valuation and taxonomy of the industrial solvents industry by practically splitting the market on the basis of different types, applications, and regions. Through the analysis of the historical and projected trends, all the segments and sub-segments were evaluated through the bottom-up approach, and different market sizes have been projected for FY 2020 to FY 2026.

The regional segmentation of the industrial solvents industry includes the complete classification of all the major continents including North America, Latin America, Europe, Asia Pacific, and the Middle East & Africa. Further, country-wise data for the industrial solvent industry is provided for the leading economies of the world.

The industrial solvent market is segmented based on product and application. On the basis of product segmentation, the market is classified into hydrocarbons, acids, esters, glycols, aromatics, alcohols, ketones, ethers, and others. In terms of application segmentation, the market is bifurcated into dissolution agents, cleaning and degreasing, paints and coatings, applications in printing products and cleaning, cosmetics, printing ink, adhesives, and others.

logoReport Scope

Report Attribute

Details

Market Size in 2019

USD 29.8 Billion

Projected Market Size in 2026

USD 36.6 Billion

CAGR Growth Rate

3% CAGR

Base Year

2019

Forecast Years

2020-2026

Key Market Players

Daicel Chemical Industries, Lyondell Basell Industries N.V., Arkema S.A., Royal Dutch Shell PLC, SK Innovation Co., Ltd., Sinopec Corp., BP PLC, BASF SE, Exxon Mobil Corporation, Eni S.p.A., Nippon Refine Co., Ltd., The Dow Chemical Company, Petroleo Brasileiro S.A., JX Holdings, Inc., and Others.

Key Segment

By Product, By Application, By Region

Major Regions Covered

North America, Europe, Asia Pacific, Latin America, and the Middle East & Africa

Purchase Options

Request customized purchase options to meet your research needs. Explore purchase options

logoSome of the essential players operating in the industrial solvents market, but not restricted to include:

  •  Daicel Chemical Industries
  •  Lyondell Basell Industries N.V.
  •  Arkema S.A.
  •  Royal Dutch Shell PLC
  •  SK Innovation Co. Ltd.
  •  Sinopec Corp.
  •  BP PLC
  •  BASF SE
  •  Exxon Mobil Corporation
  •  Eni S.p.A.
  •  Nippon Refine Co. Ltd.
  •  The Dow Chemical Company
  •  Petroleo Brasileiro S.A.
  •  JX Holdings Inc.

The taxonomy of the industrial solvents industry by its scope and segmentation is as follows:

logo By Product Segmentation Analysis (Customizable)

  • Hydrocarbons
  • Acids
  • Esters
  • Glycols
  • Aromatics
  • Alcohols
  • Ketones
  • Ethers
  • Other

logo By Application Segmentation Analysis (Customizable)

  • Dissolution agent
  • Cleaning and degreasing
  • Paints and coating
  • Printing products and cleaning
  • Others

logo Regional Segmentation Analysis (Customizable)

  • North America
    • The U.S.
    • Canada
  • Europe
    • Germany
    • The UK
    • France
    • Spain
    • Italy
    • Rest of Europe
  • Asia Pacific
    • China
    • Japan
    • India
    • South Korea
    • Southeast Asia
    • Rest of Asia Pacific
  • Latin America
    • Brazil
    • Mexico
    • Rest of Latin America
  • Middle East & Africa
    • GCC
    • South Africa
    • Rest of the Middle East & Africa

Table of Content

  1. CHAPTER 1. Executive Summary
  2. CHAPTER 2. Industrial Solvents market – Product Analysis
    1. 2.1. Global Industrial Solvents Market – Product Overview
    2. 2.2. Global Industrial Solvents Market Share, by Product, 2019 & 2026 (USD Million)
    3. 2.3. Global Industrial Solvents Market share, by Product, 2019 & 2026 (Kilo Tons)
    4. 2.4. Hydrocarbons
      1. 2.4.1. Global Hydrocarbons Industrial Solvents Market, 2016-2026 (USD Million)
      2. 2.4.2. Global Hydrocarbons Industrial Solvents Market, 2016-2026 (Kilo Tons)
    5. 2.5. Acids
      1. 2.5.1. Global Acids Industrial Solvents Market, 2016-2026 (USD Million)
      2. 2.5.2. Global Acids Industrial Solvents Market, 2016-2026 (Kilo Tons)
    6. 2.6. Esters
      1. 2.6.1. Global Esters Industrial Solvents Market, 2016-2026 (USD Million)
      2. 2.6.2. Global Esters Industrial Solvents Market, 2016-2026 (Kilo Tons)
    7. 2.7. Glycols
      1. 2.7.1. Global Glycols Industrial Solvents Market, 2016-2026 (USD Million)
      2. 2.7.2. Global Glycols Industrial Solvents Market, 2016-2026 (Kilo Tons)
    8. 2.8. Aromatics
      1. 2.8.1. Global Aromatics Industrial Solvents Market, 2016-2026 (USD Million)
      2. 2.8.2. Global Aromatics Industrial Solvents Market, 2016-2026 (Kilo Tons)
    9. 2.9. Alcohols
      1. 2.9.1. Global Alcohols Industrial Solvents Market, 2016-2026 (USD Million)
      2. 2.9.2. Global Alcohols Industrial Solvents Market, 2016-2026 (Kilo Tons)
    10. 2.10. Ketones
      1. 2.10.1. Global Ketones Industrial Solvents Market, 2016-2026 (USD Million)
      2. 2.10.2. Global Ketones Industrial Solvents Market, 2016-2026 (Kilo Tons)
    11. 2.11. Ethers
      1. 2.11.1. Global Ethers Industrial Solvents Market, 2016-2026 (USD Million)
      2. 2.11.2. Global Ethers Industrial Solvents Market, 2016-2026 (Kilo Tons)
    12. 2.12. Other
      1. 2.12.1. Global Other Industrial Solvents Market, 2016-2026 (USD Million)
      2. 2.12.2. Global Other Industrial Solvents Market, 2016-2026 (Kilo Tons)
  3. CHAPTER 3. Industrial Solvents market – Application Analysis
    1. 3.1. Global Industrial Solvents Market – Application Overview
    2. 3.2. Global Industrial Solvents Market Share, by Application, 2019 & 2026 (USD Million)
    3. 3.3. Global Industrial Solvents Market share, by Application, 2019 & 2026 (Kilo Tons)
    4. 3.4. Dissolution agent
      1. 3.4.1. Global Dissolution agent Industrial Solvents Market, 2016-2026 (USD Million)
      2. 3.4.2. Global Dissolution agent Industrial Solvents Market, 2016-2026 (Kilo Tons)
    5. 3.5. Cleaning and Degreasing
      1. 3.5.1. Global Cleaning and Degreasing Industrial Solvents Market, 2016-2026 (USD Million)
      2. 3.5.2. Global Cleaning and Degreasing Industrial Solvents Market, 2016-2026 (Kilo Tons)
    6. 3.6. Paints and Coating
      1. 3.6.1. Global Paints and Coating Industrial Solvents Market, 2016-2026 (USD Million)
      2. 3.6.2. Global Paints and Coating Industrial Solvents Market, 2016-2026 (Kilo Tons)
    7. 3.7. Printing Products and Cleaning
      1. 3.7.1. Global Printing Products and Cleaning Industrial Solvents Market, 2016-2026 (USD Million)
      2. 3.7.2. Global Printing Products and Cleaning Industrial Solvents Market, 2016-2026 (Kilo Tons)
    8. 3.8. Other
      1. 3.8.1. Global Other Industrial Solvents Market, 2016-2026 (USD Million)
      2. 3.8.2. Global Other Industrial Solvents Market, 2016-2026 (Kilo Tons)
  4. CHAPTER 4. Industrial Solvents market – Regional Analysis
    1. 4.1. Global Industrial Solvents Market Regional Overview
    2. 4.2. Global Industrial Solvents Market Share, by Region, 2019 & 2026 (Value)
    3. 4.3. Global Industrial Solvents Market Share, by Region, 2019 & 2026 (Volume)
    4. 4.4. North America
      1. 4.4.1. North America Industrial Solvents Market size and forecast, 2016-2026
      2. 4.4.2. North America Industrial Solvents Market, by Country, 2019 - 2026 (USD Million)
      3. 4.4.3. North America Market size and forecast, 2016-2026 (Kilo Tons)
      4. 4.4.4. North America Industrial Solvents Market, by Country, 2019 - 2026 (Kilo Tons)
      5. 4.4.5. North America Industrial Solvents Market, by Product, 2016-2026
        1. 4.4.5.1. North America Industrial Solvents Market, by Product, 2016-2026 (USD Million)
        2. 4.4.5.2. North America Industrial Solvents Market, by Product, 2016-2026 (Kilo Tons)
      6. 4.4.6. North America Industrial Solvents Market, by Application, 2016-2026
        1. 4.4.6.1. North America Industrial Solvents Market, by Application, 2016-2026 (USD Million)
        2. 4.4.6.2. North America Industrial Solvents Market, by Application, 2016-2026 (Kilo Tons)
      7. 4.4.7. U.S.
        1. 4.4.7.1. U.S. Market size and forecast, 2016-2026 (USD Million)
        2. 4.4.7.2. U.S. Market size and forecast, 2016-2026 (Kilo Tons)
      8. 4.4.8. Canada
        1. 4.4.8.1. Canada Market size and forecast, 2016-2026 (USD Million)
        2. 4.4.8.2. Canada Market size and forecast, 2016-2026 (Kilo Tons)
    5. 4.5. Europe
      1. 4.5.1. Europe Industrial Solvents Market size and forecast, 2016-2026
      2. 4.5.2. Europe Industrial Solvents Market, by Country, 2019 - 2026 (USD Million)
      3. 4.5.3. Europe Market size and forecast, 2016-2026 (Kilo Tons)
      4. 4.5.4. Europe Industrial Solvents Market, by Country, 2019 - 2026 (Kilo Tons)
      5. 4.5.5. Europe Industrial Solvents Market, by Product, 2016-2026
        1. 4.5.5.1. Europe Industrial Solvents Market, by Product, 2016-2026 (USD Million)
        2. 4.5.5.2. Europe Industrial Solvents Market, by Product, 2016-2026 (Kilo Tons)
      6. 4.5.6. Europe Industrial Solvents Market, by Application, 2016-2026
        1. 4.5.6.1. Europe Industrial Solvents Market, by Application, 2016-2026 (USD Million)
        2. 4.5.6.2. Europe Industrial Solvents Market, by Application, 2016-2026 (Kilo Tons)
      7. 4.5.7. Germany
        1. 4.5.7.1. Germany Market size and forecast, 2016-2026 (USD Million)
        2. 4.5.7.2. Germany Market size and forecast, 2016-2026 (Kilo Tons)
      8. 4.5.8. France
        1. 4.5.8.1. France Market size and forecast, 2016-2026 (USD Million)
        2. 4.5.8.2. France Market size and forecast, 2016-2026 (Kilo Tons)
      9. 4.5.9. U.K.
        1. 4.5.9.1. U.K. Market size and forecast, 2016-2026 (USD Million)
        2. 4.5.9.2. U.K. Market size and forecast, 2016-2026 (Kilo Tons)
      10. 4.5.10. Italy
        1. 4.5.10.1. Italy Market size and forecast, 2016-2026 (USD Million)
        2. 4.5.10.2. Italy Market size and forecast, 2016-2026 (Kilo Tons)
      11. 4.5.11. Spain
        1. 4.5.11.1. Spain Market size and forecast, 2016-2026 (USD Million)
        2. 4.5.11.2. Spain Market size and forecast, 2016-2026 (Kilo Tons)
      12. 4.5.12. Rest of Europe
        1. 4.5.12.1. Rest of Europe Market size and forecast, 2016-2026 (USD Million)
        2. 4.5.12.2. Rest of Europe Market size and forecast, 2016-2026 (Kilo Tons)
    6. 4.6. Asia Pacific
      1. 4.6.1. Asia Pacific Industrial Solvents Market size and forecast, 2016-2026
      2. 4.6.2. Asia Pacific Industrial Solvents Market, by Country, 2019 - 2026 (USD Million)
      3. 4.6.3. Asia Pacific Market size and forecast, 2016-2026 (Kilo Tons)
      4. 4.6.4. Asia Pacific Industrial Solvents Market, by Country, 2019 - 2026 (Kilo Tons)
      5. 4.6.5. Asia Pacific Industrial Solvents Market, by Product, 2016-2026
        1. 4.6.5.1. Asia Pacific Industrial Solvents Market, by Product, 2016-2026 (USD Million)
        2. 4.6.5.2. Asia Pacific Industrial Solvents Market, by Product, 2016-2026 (Kilo Tons)
      6. 4.6.6. Asia Pacific Industrial Solvents Market, by Application, 2016-2026
        1. 4.6.6.1. Asia Pacific Industrial Solvents Market, by Application, 2016-2026 (USD Million)
        2. 4.6.6.2. Asia Pacific Industrial Solvents Market, by Application, 2016-2026 (Kilo Tons)
      7. 4.6.7. China
        1. 4.6.7.1. China Market size and forecast, 2016-2026 (USD Million)
        2. 4.6.7.2. China Market size and forecast, 2016-2026 (Kilo Tons)
      8. 4.6.8. Japan
        1. 4.6.8.1. Japan Market size and forecast, 2016-2026 (USD Million)
        2. 4.6.8.2. Japan Market size and forecast, 2016-2026 (Kilo Tons)
      9. 4.6.9. India
        1. 4.6.9.1. India Market size and forecast, 2016-2026 (USD Million)
        2. 4.6.9.2. India Market size and forecast, 2016-2026 (Kilo Tons)
      10. 4.6.10. South Korea
        1. 4.6.10.1. South Korea Market size and forecast, 2016-2026 (USD Million)
        2. 4.6.10.2. South Korea Market size and forecast, 2016-2026 (Kilo Tons)
      11. 4.6.11. South-East Asia
        1. 4.6.11.1. South-East Asia Market size and forecast, 2016-2026 (USD Million)
        2. 4.6.11.2. South-East Asia Market size and forecast, 2016-2026 (Kilo Tons)
      12. 4.6.12. Rest of Asia Pacific
        1. 4.6.12.1. Rest of Asia Pacific Market size and forecast, 2016-2026 (USD Million)
        2. 4.6.12.2. Rest of Asia Pacific Market size and forecast, 2016-2026 (Kilo Tons)
    7. 4.7. Latin America
      1. 4.7.1. Latin America Industrial Solvents Market size and forecast, 2016-2026
      2. 4.7.2. Latin America Industrial Solvents Market, by Country, 2019 - 2026 (USD Million)
      3. 4.7.3. Latin America Market size and forecast, 2016-2026 (Kilo Tons)
      4. 4.7.4. Latin America Industrial Solvents Market, by Country, 2019 - 2026 (Kilo Tons)
      5. 4.7.5. Latin America Industrial Solvents Market, by Product, 2016-2026
        1. 4.7.5.1. Latin America Industrial Solvents Market, by Product, 2016-2026 (USD Million)
        2. 4.7.5.2. Latin America Industrial Solvents Market, by Product, 2016-2026 (Kilo Tons)
      6. 4.7.6. Latin America Industrial Solvents Market, by Application, 2016-2026
        1. 4.7.6.1. Latin America Industrial Solvents Market, by Application, 2016-2026 (USD Million)
        2. 4.7.6.2. Latin America Industrial Solvents Market, by Application, 2016-2026 (Kilo Tons)
      7. 4.7.7. Brazil
        1. 4.7.7.1. Brazil Market size and forecast, 2016-2026 (USD Million)
        2. 4.7.7.2. Brazil Market size and forecast, 2016-2026 (Kilo Tons)
      8. 4.7.8. Mexico
        1. 4.7.8.1. Mexico Market size and forecast, 2016-2026 (USD Million)
        2. 4.7.8.2. Mexico Market size and forecast, 2016-2026 (Kilo Tons)
      9. 4.7.9. Rest of Latin America
        1. 4.7.9.1. Rest of Latin America Market size and forecast, 2016-2026 (USD Million)
        2. 4.7.9.2. Rest of Latin America Market size and forecast, 2016-2026 (Kilo Tons)
    8. 4.8. The Middle-East and Africa
      1. 4.8.1. The Middle-East and Africa Industrial Solvents Market size and forecast, 2016-2026
      2. 4.8.2. The Middle-East and Africa Industrial Solvents Market, by Country, 2019 - 2026 (USD Million)
      3. 4.8.3. The Middle-East and Africa Market size and forecast, 2016-2026 (Kilo Tons)
      4. 4.8.4. The Middle-East and Africa Industrial Solvents Market, by Country, 2019 - 2026 (Kilo Tons)
      5. 4.8.5. The Middle-East and Africa Industrial Solvents Market, by Product, 2016-2026
        1. 4.8.5.1. The Middle-East and Africa Industrial Solvents Market, by Product, 2016-2026 (USD Million)
        2. 4.8.5.2. The Middle-East and Africa Industrial Solvents Market, by Product, 2016-2026 (Kilo Tons)
      6. 4.8.6. The Middle-East and Africa Industrial Solvents Market, by Application, 2016-2026
        1. 4.8.6.1. The Middle-East and Africa Industrial Solvents Market, by Application, 2016-2026 (USD Million)
        2. 4.8.6.2. The Middle-East and Africa Industrial Solvents Market, by Application, 2016-2026 (Kilo Tons)
      7. 4.8.7. GCC Countries
        1. 4.8.7.1. GCC Countries Market size and forecast, 2016-2026 (USD Million)
        2. 4.8.7.2. GCC Countries Market size and forecast, 2016-2026 (Kilo Tons)
      8. 4.8.8. South Africa
        1. 4.8.8.1. South Africa Market size and forecast, 2016-2026 (USD Million)
        2. 4.8.8.2. South Africa Market size and forecast, 2016-2026 (Kilo Tons)
      9. 4.8.9. Rest of Middle-East Africa
        1. 4.8.9.1. Rest of Middle-East Africa Market size and forecast, 2016-2026 (USD Million)
        2. 4.8.9.2. Rest of Middle-East Africa Market size and forecast, 2016-2026 (Kilo Tons)
  5. CHAPTER 5. Industrial Solvents Production, Consumption, Export, Import by Regions
    1. 5.1. Global Industrial Solvents production and revenue, 2016-2026 (USD Million) (Kilo Tons)
    2. 5.2. Global Import and Export Analysis, by Region
  6. CHAPTER 6. Industrial Solvents market – Competitive Landscape
    1. 6.1. Competitor Market Share – Revenue
    2. 6.2. Market Concentration Rate Analysis, Top 3 and Top 5 Players
    3. 6.3. Competitor Market Share – Volume
    4. 6.4. Strategic Development
      1. 6.4.1. Acquisitions and Mergers
      2. 6.4.2. New Products
      3. 6.4.3. Research & Development Activities
  7. CHAPTER 7. Company Profiles
    1. 7.1. BASF SE
      1. 7.1.1. Company Overview
      2. 7.1.2. BASF SE Sales, Revenue, Price, and Gross Margin
      3. 7.1.3. Product portfolio
      4. 7.1.4. Recent initiatives
    2. 7.2. Daicel Chemical Industries
      1. 7.2.1. Company Overview
      2. 7.2.2. Daicel Chemical Industries Sales, Revenue, Price, and Gross Margin
      3. 7.2.3. Product portfolio
      4. 7.2.4. Recent initiatives
    3. 7.3. Exxon Mobil Corporation
      1. 7.3.1. Company Overview
      2. 7.3.2. Exxon Mobil Corporation Sales, Revenue, Price, and Gross Margin
      3. 7.3.3. Product portfolio
      4. 7.3.4. Recent initiatives
    4. 7.4. Lyondell Basell Industries N.V.
      1. 7.4.1. Company Overview
      2. 7.4.2. Lyondell Basell Industries N.V. Sales, Revenue, Price, and Gross Margin
      3. 7.4.3. Product portfolio
      4. 7.4.4. Recent initiatives
    5. 7.5. Eni S.p.A.
      1. 7.5.1. Company Overview
      2. 7.5.2. Eni S.p.A. Sales, Revenue, Price, and Gross Margin
      3. 7.5.3. Product portfolio
      4. 7.5.4. Recent initiatives
    6. 7.6. Arkema S.A.
      1. 7.6.1. Company Overview
      2. 7.6.2. Arkema S.A. Sales, Revenue, Price, and Gross Margin
      3. 7.6.3. Product portfolio
      4. 7.6.4. Recent initiatives
    7. 7.7. Nippon Refine Co., Ltd.
      1. 7.7.1. Company Overview
      2. 7.7.2. Nippon Refine Co., Ltd. Sales, Revenue, Price, and Gross Margin
      3. 7.7.3. Product portfolio
      4. 7.7.4. Recent initiatives
    8. 7.8. Royal Dutch Shell PLC
      1. 7.8.1. Company Overview
      2. 7.8.2. Royal Dutch Shell PLC Sales, Revenue, Price, and Gross Margin
      3. 7.8.3. Product portfolio
      4. 7.8.4. Recent initiatives
    9. 7.9. The Dow Chemical Company
      1. 7.9.1. Company Overview
      2. 7.9.2. The Dow Chemical Company Sales, Revenue, Price, and Gross Margin
      3. 7.9.3. Product portfolio
      4. 7.9.4. Recent initiatives
    10. 7.10. SK Innovation Co., Ltd.
      1. 7.10.1. Company Overview
      2. 7.10.2. SK Innovation Co., Ltd. Sales, Revenue, Price, and Gross Margin
      3. 7.10.3. Product portfolio
      4. 7.10.4. Recent initiatives
    11. 7.11. Petroleo Brasileiro S.A.
      1. 7.11.1. Company Overview
      2. 7.11.2. Petroleo Brasileiro S.A. Sales, Revenue, Price, and Gross Margin
      3. 7.11.3. Product portfolio
      4. 7.11.4. Recent initiatives
    12. 7.12. Sinopec Corp.
      1. 7.12.1. Company Overview
      2. 7.12.2. Sinopec Corp. Sales, Revenue, Price, and Gross Margin
      3. 7.12.3. Product portfolio
      4. 7.12.4. Recent initiatives
    13. 7.13. JX Holdings, Inc.
      1. 7.13.1. Company Overview
      2. 7.13.2. JX Holdings, Inc. Sales, Revenue, Price, and Gross Margin
      3. 7.13.3. Product portfolio
      4. 7.13.4. Recent initiatives
    14. 7.14. BP PLC
      1. 7.14.1. Company Overview
      2. 7.14.2. BP PLC Sales, Revenue, Price, and Gross Margin
      3. 7.14.3. Product portfolio
      4. 7.14.4. Recent initiatives
  8. CHAPTER 8. Industrial Solvents — Industry Analysis
    1. 8.1. Introduction and Taxonomy
    2. 8.2. Industrial Solvents Market – Key Trends
      1. 8.2.1. Market Drivers
      2. 8.2.2. Market Restraints
      3. 8.2.3. Market Opportunities
    3. 8.3. Value Chain Analysis
    4. 8.4. Key Mandates and Regulations
    5. 8.5. Technology Roadmap and Timeline
    6. 8.6. Industrial Solvents market – Attractiveness Analysis
      1. 8.6.1. By Product
      2. 8.6.2. By Application
      3. 8.6.3. By Region
  9. CHAPTER 9. Raw Material analysis
    1. 9.1. Industrial Solvents Key Raw Material Analysis
      1. 9.1.1. Key Raw Materials
      2. 9.1.2. Price Trend of Key Raw Materials
    2. 9.2. Key Suppliers of Raw Materials
    3. 9.3. Proportion of Manufacturing Cost Structure
      1. 9.3.1. Raw Materials
      2. 9.3.2. Labor Cost
    4. 9.4. Manufacturing Expenses Analysis of Industrial Solvents
  10. CHAPTER 10. Industrial Chain, Sourcing Strategy and Downstream Buyers
    1. 10.1. Industrial Solvents Industrial Chain Analysis
    2. 10.2. Upstream Raw Materials Sourcing
      1. 10.2.1. Risk Mitigation:
      2. 10.2.2. Supplier Relationships:
      3. 10.2.3. Business Processes:
      4. 10.2.4. Securing the Product:
    3. 10.3. Raw Materials Sources of Industrial Solvents Major Manufacturers in 2016
    4. 10.4. Downstream Buyers
    5. 10.5. Distributors/Traders List
  11. CHAPTER 11. Marketing Strategy Analysis, Distributors
    1. 11.1. Marketing Channel
    2. 11.2. Direct Marketing
    3. 11.3. Indirect Marketing
    4. 11.4. Marketing Channel Development Trend
    5. 11.5. Economic/Political Environmental Change
  12. CHAPTER 12. Report Conclusion
  13. CHAPTER 13. Research Approach & Methodology
    1. 13.1. Report Description
    2. 13.2. Research Scope
    3. 13.3. Research Methodology
      1. 13.3.1. Secondary Research
      2. 13.3.2. Primary Research
      3. 13.3.3. Models
        1. 13.3.3.1. Company Share Analysis Model
        2. 13.3.3.2. Revenue Based Modeling
        3. 13.3.3.3. Research Limitations

        List of Figures

        FIG. 1 Global Industrial Solvents Market, 2016-2026 (USD Million)
        FIG. 2 Global Industrial Solvents Market Share, by Product, 2019 & 2026 (USD Million)
        FIG. 3 Global Industrial Solvents Market share, by Product, 2019 & 2026 (Kilo Tons)
        FIG. 4 Global Hydrocarbons Industrial Solvents Market, 2016-2026 (USD Million)
        FIG. 5 Global Hydrocarbons Industrial Solvents  Market, 2016-2026 (Kilo Tons)
        FIG. 6 Global Acids Industrial Solvents Market, 2016-2026 (USD Million)
        FIG. 7 Global Acids Industrial Solvents  Market, 2016-2026 (Kilo Tons)
        FIG. 8 Global Esters Industrial Solvents Market, 2016-2026 (USD Million)
        FIG. 9 Global Esters Industrial Solvents  Market, 2016-2026 (Kilo Tons)
        FIG. 10 Global Glycols Industrial Solvents Market, 2016-2026 (USD Million)
        FIG. 11 Global Glycols Industrial Solvents  Market, 2016-2026 (Kilo Tons)
        FIG. 12 Global Aromatics Industrial Solvents Market, 2016-2026 (USD Million)
        FIG. 13 Global Aromatics Industrial Solvents  Market, 2016-2026 (Kilo Tons)
        FIG. 14 Global Alcohols Industrial Solvents Market, 2016-2026 (USD Million)
        FIG. 15 Global Alcohols Industrial Solvents  Market, 2016-2026 (Kilo Tons)
        FIG. 16 Global Ketones Industrial Solvents Market, 2016-2026 (USD Million)
        FIG. 17 Global Ketones Industrial Solvents  Market, 2016-2026 (Kilo Tons)
        FIG. 18 Global Ethers Industrial Solvents Market, 2016-2026 (USD Million)
        FIG. 19 Global Ethers Industrial Solvents  Market, 2016-2026 (Kilo Tons)
        FIG. 20 Global Other Industrial Solvents Market, 2016-2026 (USD Million)
        FIG. 21 Global Other Industrial Solvents  Market, 2016-2026 (Kilo Tons)
        FIG. 22 Global Industrial Solvents Market Share, by Application, 2019 & 2026 (USD Million)
        FIG. 23 Global Industrial Solvents Market share, by Application, 2019 & 2026 (Kilo Tons)
        FIG. 24 Global Dissolution agent Industrial Solvents Market, 2016-2026 (USD Million)
        FIG. 25 Global Dissolution agent Industrial Solvents  Market, 2016-2026 (Kilo Tons)
        FIG. 26 Global Cleaning and Degreasing Industrial Solvents Market, 2016-2026 (USD Million)
        FIG. 27 Global Cleaning and Degreasing Industrial Solvents  Market, 2016-2026 (Kilo Tons)
        FIG. 28 Global Paints and Coating Industrial Solvents Market, 2016-2026 (USD Million)
        FIG. 29 Global Paints and Coating Industrial Solvents  Market, 2016-2026 (Kilo Tons)
        FIG. 30 Global Printing Products and Cleaning Industrial Solvents Market, 2016-2026 (USD Million)
        FIG. 31 Global Printing Products and Cleaning Industrial Solvents  Market, 2016-2026 (Kilo Tons)
        FIG. 32 Global Other Industrial Solvents Market, 2016-2026 (USD Million)
        FIG. 33 Global Other Industrial Solvents  Market, 2016-2026 (Kilo Tons)
        FIG. 34 Global Industrial Solvents Market Share, by Region, 2019 & 2026
        FIG. 35 Global Industrial Solvents Market Share, by Region, 2019 & 2026
        FIG. 36 North America Industrial Solvents Market, 2016-2026
        FIG. 37 North America Industrial Solvents  Market, 2016-2026 (Kilo Tons)
        FIG. 38 U.S. Industrial Solvents Market, 2016-2026
        FIG. 39 U.S. Industrial Solvents  Market, 2016-2026 (Kilo Tons)
        FIG. 40 Canada Industrial Solvents Market, 2016-2026
        FIG. 41 Canada Industrial Solvents  Market, 2016-2026 (Kilo Tons)
        FIG. 42 Europe Industrial Solvents Market, 2016-2026
        FIG. 43 Europe Industrial Solvents  Market, 2016-2026 (Kilo Tons)
        FIG. 44 Germany Industrial Solvents Market, 2016-2026
        FIG. 45 Germany Industrial Solvents  Market, 2016-2026 (Kilo Tons)
        FIG. 46 France Industrial Solvents Market, 2016-2026
        FIG. 47 France Industrial Solvents  Market, 2016-2026 (Kilo Tons)
        FIG. 48 U.K. Industrial Solvents Market, 2016-2026
        FIG. 49 U.K. Industrial Solvents  Market, 2016-2026 (Kilo Tons)
        FIG. 50 Italy Industrial Solvents Market, 2016-2026
        FIG. 51 Italy Industrial Solvents  Market, 2016-2026 (Kilo Tons)
        FIG. 52 Spain Industrial Solvents Market, 2016-2026
        FIG. 53 Spain Industrial Solvents  Market, 2016-2026 (Kilo Tons)
        FIG. 54 Rest of Europe Industrial Solvents Market, 2016-2026
        FIG. 55 Rest of Europe Industrial Solvents  Market, 2016-2026 (Kilo Tons)
        FIG. 56 Asia Pacific Industrial Solvents Market, 2016-2026
        FIG. 57 Asia Pacific Industrial Solvents  Market, 2016-2026 (Kilo Tons)
        FIG. 58 China Industrial Solvents Market, 2016-2026
        FIG. 59 China Industrial Solvents  Market, 2016-2026 (Kilo Tons)
        FIG. 60 Japan Industrial Solvents Market, 2016-2026
        FIG. 61 Japan Industrial Solvents  Market, 2016-2026 (Kilo Tons)
        FIG. 62 India Industrial Solvents Market, 2016-2026
        FIG. 63 India Industrial Solvents  Market, 2016-2026 (Kilo Tons)
        FIG. 64 South  Korea Industrial Solvents Market, 2016-2026
        FIG. 65 South  Korea Industrial Solvents  Market, 2016-2026 (Kilo Tons)
        FIG. 66 South-East Asia Industrial Solvents Market, 2016-2026
        FIG. 67 South-East Asia Industrial Solvents  Market, 2016-2026 (Kilo Tons)
        FIG. 68 Rest of Asia Pacific Industrial Solvents Market, 2016-2026
        FIG. 69 Rest of Asia Pacific Industrial Solvents  Market, 2016-2026 (Kilo Tons)
        FIG. 70 Latin America Industrial Solvents Market, 2016-2026
        FIG. 71 Latin America Industrial Solvents  Market, 2016-2026 (Kilo Tons)
        FIG. 72 Brazil Industrial Solvents Market, 2016-2026
        FIG. 73 Brazil Industrial Solvents  Market, 2016-2026 (Kilo Tons)
        FIG. 74 Mexico Industrial Solvents Market, 2016-2026
        FIG. 75 Mexico Industrial Solvents  Market, 2016-2026 (Kilo Tons)
        FIG. 76 Rest of Latin America Industrial Solvents Market, 2016-2026
        FIG. 77 Rest of Latin America Industrial Solvents  Market, 2016-2026 (Kilo Tons)
        FIG. 78 The Middle-East and Africa Industrial Solvents Market, 2016-2026
        FIG. 79 The Middle-East and Africa Industrial Solvents  Market, 2016-2026 (Kilo Tons)
        FIG. 80 GCC Countries Industrial Solvents Market, 2016-2026
        FIG. 81 GCC Countries Industrial Solvents  Market, 2016-2026 (Kilo Tons)
        FIG. 82 South Africa Industrial Solvents Market, 2016-2026
        FIG. 83 South Africa Industrial Solvents  Market, 2016-2026 (Kilo Tons)
        FIG. 84 Rest of Middle-East Africa Industrial Solvents Market, 2016-2026
        FIG. 85 Rest of Middle-East Africa Industrial Solvents  Market, 2016-2026 (Kilo Tons)
        FIG. 86 Global Industrial Solvents production and revenue, 2016-2026 (USD Million) (Kilo Tons)
        FIG. 87 North America Industrial Solvents production and revenue, 2016-2026 (USD Million) (Kilo Tons)
        FIG. 88 Europe Industrial Solvents production and revenue, 2016-2026 (USD Million) (Kilo Tons)
        FIG. 89 Asia Pacific Industrial Solvents production and revenue, 2016-2026 (USD Million) (Kilo Tons)
        FIG. 90 Latin America Industrial Solvents production and revenue, 2016-2026 (USD Million) (Kilo Tons)
        FIG. 91 Middle East and Africa Industrial Solvents production and revenue, 2016-2026 (USD Million) (Kilo Tons)
        FIG. 92 Competitor Market Share – Revenue
        FIG. 93 Competitor Market Share – Volume
        FIG. 94 BASF SE Revenue and Growth Rate
        FIG. 95 BASF SE Market Share
        FIG. 96 Daicel Chemical Industries Revenue and Growth Rate
        FIG. 97 Daicel Chemical Industries Market Share
        FIG. 98 Exxon Mobil Corporation Revenue and Growth Rate
        FIG. 99 Exxon Mobil Corporation Market Share
        FIG. 100 Lyondell Basell Industries N.V. Revenue and Growth Rate
        FIG. 101 Lyondell Basell Industries N.V. Market Share
        FIG. 102 Eni S.p.A. Revenue and Growth Rate
        FIG. 103 Eni S.p.A. Market Share
        FIG. 104 Arkema S.A. Revenue and Growth Rate
        FIG. 105 Arkema S.A. Market Share
        FIG. 106 Nippon Refine Co., Ltd. Revenue and Growth Rate
        FIG. 107 Nippon Refine Co., Ltd. Market Share
        FIG. 108 Royal Dutch Shell PLC Revenue and Growth Rate
        FIG. 109 Royal Dutch Shell PLC Market Share
        FIG. 110 The Dow Chemical Company Revenue and Growth Rate
        FIG. 111 The Dow Chemical Company Market Share
        FIG. 112 SK Innovation Co., Ltd. Revenue and Growth Rate
        FIG. 113 SK Innovation Co., Ltd. Market Share
        FIG. 114 Petroleo Brasileiro S.A. Revenue and Growth Rate
        FIG. 115 Petroleo Brasileiro S.A. Market Share
        FIG. 116 Sinopec Corp. Revenue and Growth Rate
        FIG. 117 Sinopec Corp. Market Share
        FIG. 118 JX Holdings, Inc. Revenue and Growth Rate
        FIG. 119 JX Holdings, Inc. Market Share
        FIG. 120 BP PLC Revenue and Growth Rate
        FIG. 121 BP PLC Market Share
        FIG. 122 Market Dynamics
        FIG. 123 Global Industrial Solvents – Value Chain Analysis
        FIG. 124 Key Mandates and Regulations
        FIG. 125 Technology Roadmap and Timeline
        FIG. 126 Market Attractiveness Analysis – By Product
        FIG. 127 Market Attractiveness Analysis – By Application
        FIG. 128 Market Attractiveness Analysis – By Region
        FIG. 129 Manufacturing Cost Structure of Industrial Solvents
        FIG. 130 Industrial Solvents Industrial Chain Analysis
        FIG. 131 Market Channel
        FIG. 132 Marketing Channel Development Trend
        FIG. 133 Growth in World Gross Product, 2008-2019

        List of Tables

        TABLE 1 Global Industrial Solvents market, 2019 & 2026 (USD Million)
        TABLE 2 Global Industrial Solvents market, by Product, 2016-2026 (USD Million)
        TABLE 3 Global Industrial Solvents market, by Product, 2016-2026 (Kilo Tons)
        TABLE 4 Global Industrial Solvents market, by Application, 2016-2026 (USD Million)
        TABLE 5 Global Industrial Solvents market, by Application, 2016-2026 (Kilo Tons)
        TABLE 6 Global Industrial Solvents market, by region, 2016-2026 (USD Million)
        TABLE 7 Global Industrial Solvents market, by region, 2016-2026 (Kilo Tons)
        TABLE 8 North America Industrial Solvents Market, by Product, 2016-2026 (USD Million)
        TABLE 9 North America Industrial Solvents Market, by Product, 2016-2026 (Kilo Tons)
        TABLE 10 North America Industrial Solvents Market, by Application, 2016-2026 (USD Million)
        TABLE 11 North America Industrial Solvents Market, by Application, 2016-2026 (Kilo Tons)
        TABLE 12 Europe Industrial Solvents Market, by Product, 2016-2026 (USD Million)
        TABLE 13 Europe Industrial Solvents Market, by Product, 2016-2026 (Kilo Tons)
        TABLE 14 Europe Industrial Solvents Market, by Application, 2016-2026 (USD Million)
        TABLE 15 Europe Industrial Solvents Market, by Application, 2016-2026 (Kilo Tons)
        TABLE 16 Asia Pacific Industrial Solvents Market, by Product, 2016-2026 (USD Million)
        TABLE 17 Asia Pacific Industrial Solvents Market, by Product, 2016-2026 (Kilo Tons)
        TABLE 18 Asia Pacific Industrial Solvents Market, by Application, 2016-2026 (USD Million)
        TABLE 19 Asia Pacific Industrial Solvents Market, by Application, 2016-2026 (Kilo Tons)
        TABLE 20 Latin America Industrial Solvents Market, by Product, 2016-2026 (USD Million)
        TABLE 21 Latin America Industrial Solvents Market, by Product, 2016-2026 (Kilo Tons)
        TABLE 22 Latin America Industrial Solvents Market, by Application, 2016-2026 (USD Million)
        TABLE 23 Latin America Industrial Solvents Market, by Application, 2016-2026 (Kilo Tons)
        TABLE 24 The Middle-East and Africa Industrial Solvents Market, by Product, 2016-2026 (USD Million)
        TABLE 25 The Middle-East and Africa Industrial Solvents Market, by Product, 2016-2026 (Kilo Tons)
        TABLE 26 The Middle-East and Africa Industrial Solvents Market, by Application, 2016-2026 (USD Million)
        TABLE 27 The Middle-East and Africa Industrial Solvents Market, by Application, 2016-2026 (Kilo Tons)
        TABLE 28 North America Industrial Solvents Production, Consumption, Export, Import, 2016-2019
        TABLE 29 Europe Industrial Solvents Production, Consumption, Export, Import, 2016-2019
        TABLE 30 Asia Pacific Industrial Solvents Production, Consumption, Export, Import, 2016-2019
        TABLE 31 Latin America Industrial Solvents Production, Consumption, Export, Import, 2016-2019
        TABLE 32 Middle East & Africa Industrial Solvents Production, Consumption, Export, Import, 2016-2019
        TABLE 33 Global Industrial Solvents Market - Company Revenue Analysis 2016-2019 (USD Million)
        TABLE 34 Global Industrial Solvents Market - Company Revenue Share Analysis 2016-2019(%)
        TABLE 35 Global Industrial Solvents Market - Company Volume Analysis 2016-2019 (Kilo Tons)
        TABLE 36 Global Industrial Solvents Market - Company Volume Share Analysis 2016-2019(%)
        TABLE 37 Acquisitions and Mergers
        TABLE 38 New Product/Service Launch
        TABLE 39 Research & Development Activities
        TABLE 40 Market Drivers
        TABLE 41 Market Restraints
        TABLE 42 Market Opportunities
        TABLE 43 Production Base and Market Concentration Rate of Raw Material
        TABLE 44 Key Suppliers of Raw Materials
        TABLE 45 Raw Materials Sources of Industrial Solvents Major Manufacturers in 2016
        TABLE 46 Major Buyers of Industrial Solvents
        TABLE 47 Distributors/Traders of Industrial Solvents by Region

Industry Major Market Players

  •  Daicel Chemical Industries
  •  Lyondell Basell Industries N.V.
  •  Arkema S.A.
  •  Royal Dutch Shell PLC
  •  SK Innovation Co. Ltd.
  •  Sinopec Corp.
  •  BP PLC
  •  BASF SE
  •  Exxon Mobil Corporation
  •  Eni S.p.A.
  •  Nippon Refine Co. Ltd.
  •  The Dow Chemical Company
  •  Petroleo Brasileiro S.A.
  •  JX Holdings Inc.