Search Market Research Report

Discover Our Latest Reports
Discover Our Featured Reports
Discover Top Selling Reports

Industrial Cleaning Agents Market Size, Share Global Analysis Report, 2020–2026

report img

Industrial Cleaning Agents Market By Type (General purpose Cleaner, Metal Cleaner, Textile Detergents) and By Application (Food & Beverage, Pharmaceuticals, Automotive, Others): Global Industry Outlook, Market Size, Business Intelligence, Consumer Preferences, Statistical Surveys, Comprehensive Analysis, Historical Developments, Current Trends, and Forecast 2020–2026

Industry Insights

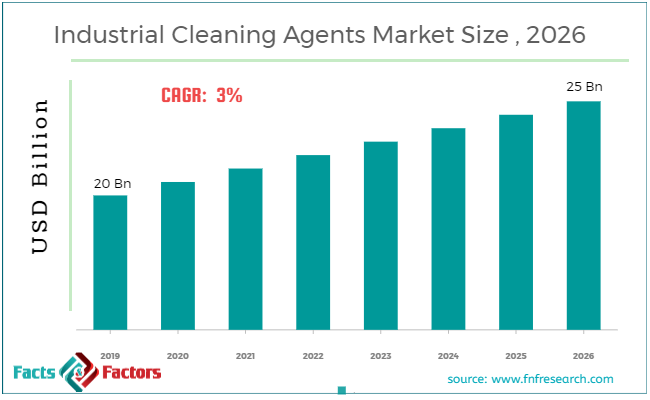
 According to the report published by Facts & Factors, the global Industrial Cleaning Agents Market size was worth around USD 20 billion in 2019 and is predicted to grow around USD 25 billion by 2026 with a compound annual growth rate (CAGR) of roughly 3% between 2020 and 2026. The report analyzes the global Industrial Cleaning Agents Market drivers, restraints/challenges, and the effect they have on the demands during the projection period. In addition, the report explores emerging opportunities in the Industrial Cleaning Agents Market.

Industrial Cleaning Agents Market

To know more about this report | Request Free Sample Copy

This specialized and expertise oriented industry research report scrutinizes the technical and commercial business outlook of the industrial cleaning agents industry. The report analyzes and declares the historical and current trends analysis of the industrial cleaning agents industry and subsequently recommends the projected trends anticipated to be observed in the industrial cleaning agents market during the upcoming years.

The industrial cleaning agents market report analyzes and notifies the industry statistics at the global as well as regional and country levels in order to acquire a thorough perspective of the entire industrial cleaning agents market. The historical and past insights are provided for FY 2016 to FY 2019 whereas projected trends are delivered for FY 2020 to FY 2026. The quantitative and numerical data is represented in terms of both volume (Kilo Tons) and value (USD Billion) from FY 2016 – 2026.

logoKey Insights from Primary Research

  • According to the CXO’s operating in the global industrial cleaning agents market, the market was valued at USD 20 billion and is expected to be valued over USD 25 billion.
  • The industrial cleaning agents market is predicted to witness a significant growth of over3% during the years 2020-2026 due to the rising awareness about hygiene.
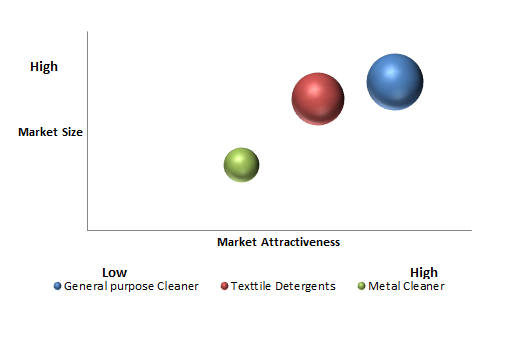
  • By type analysis, In 2019, the general-purpose cleaner segment-headed the market with nearly USD 9 billion owing to the increasing use of cleaner in the industry to clean greasy, dirty machinery, etc.
  • By application analysis, the global industrial cleaning agents market was led by food & beverages. It accounted for more than a 30% share of the market in 2019.
  • By geography, North America region dominated the global market in 2019. North America constituted more than 30% market share of the global industrial cleaning agent market, owing to the rising industrialization in this region.

logoKey Recommendations from Analysts

  • Our analysts recommend that the Asia-Pacific is projected to grow in the future years owing to increasing focus on health hygiene and increasing demand for industrial cleaning in healthcare in these regions.
  • Europe region for industrial cleaning agents is expected to be one of the fastest-growing regions due to the growth in the infrastructure sector and growth in the hospitality sector.
  • Due to rising investment in the healthcare industry, and growing investment by various Pharmaceuticals companies, the Pharmaceuticals category is expected to grow over the forecast period.
  • By type, the textile detergents category is expected to grow during the forthcoming years attributed to increasing demand in the textile industry.
  • Due to the rising awareness among consumers about hygiene, robust industrialization and increasing expenditure for hygiene and demand for eco-friendly productsexpected to bring lucrative opportunities in the market.

logoMarket Attractiveness By Type Analysis

Industrial Cleaning Agents Market

To know more about this report | Request Free Sample Copy

The quantitative data is further underlined and reinforced by comprehensive qualitative data which comprises various across-the-board market dynamics. The rationales which directly or indirectly impact the Industrial Cleaning Agents industry are exemplified through parameters such as growth drivers, restraints, challenges, and opportunities among other impacting factors.

Throughout our research report, we have encompassed all the proven models and tools of industry analysis and extensively illustrated all the key business strategies and business models adopted in the industrial cleaning agents industry. The report provides an all-inclusive and detailed competitive landscape prevalent in the industrial cleaning agents market.

The report utilizes established industry analysis tools and models such as Porter’s Five Forces framework to analyze and recognize critical business strategies adopted by various stakeholders involved in the entire value chain of the industrial cleaning agents industry. The industrial cleaning agents market report additionally employs SWOT analysis and PESTLE analysis models for further in-depth analysis.

The report study further includes an in-depth analysis of industry players' market shares and provides an overview of leading players' market position in the industrial cleaning agents sector. Key strategic developments in the industrial cleaning agents market competitive landscape such as acquisitions & mergers, inaugurations of different products and services, partnerships & joint ventures, MoU agreements, VC & funding activities, R&D activities, and geographic expansion among other noteworthy activities by key players of the industrial cleaning agents market are appropriately highlighted in the report.

The substances that are used to clean dirt are referred to as a cleaning agent. It is used to clean dust, clutter on the surface, stain in order to kill the bacteria, remove dirt. Generally, cleaning agents are acidic, alkaline, natural, degreaser, sourcing agents, etc. They are used in various industries such as automotive and aerospace industry, hospitality, healthcare industry, retail, and foodservice industry, etc. Various raw materials including chelating agents, solvents, and surfactants are used in various cleaning applications.

logoReport Scope

Report Attribute

Details

Market Size in 2019

USD 20 Billion

Projected Market Size in 2026

USD 25 Billion

CAGR Growth Rate

CAGR 03%

Base Year

2019

Forecast Years

2020-2026

Key Market Players

Church & Dwight Co., Inc., Kimberly-Clark Corporation, KGaA, Reckitt Benckiser Group (RB), Sealed Air Corporation (Diversey Care), Ecolab, Prayon, 3M Company, The Clorox Company, Procter & Gamble (P&G), Henkel AG & Co. Unilever, Zep Inc., Guardian Chemicals, PQ Corporation (Carlyle Group), Spartan Chemical Company, Inc., Betco Corporation and others.

Key Segment

By Product, Application, and Region

Major Regions Covered

North America, Europe, Asia Pacific, Latin America, and the Middle East &, Africa

Purchase Options

Request customized purchase options to meet your research needs. Explore purchase options

The rising awareness regarding cleanliness at workplace and hygiene and increasing expenditure on healthcare services are the factors driving the industrial cleaning agent industry. Rise in the tourism industry, hospitality industry, manufacturing industry drives the market for industrial cleaning agents. Environmental cleaning is an important concept for avoiding diseases associated with healthcare. Additionally, companies' strategies such as collaboration, merger, new product launches are the factors driving the global market. However, a large number of chemicals are used by industrial cleaning agents that can harm the environment. Strict government and environmental regulations about the effect of these chemicals may hinder market growth. On the other hand, many companies are tending to manufacture eco-friendly bio-based products due to strict environmental regulations. Bio-based products are made from agricultural products containing soybeans extract, corn, and even coconuts. The use of bio-based products and increasing industrialization may bring lucrative opportunities in the industrial cleaning agent market.

The industrial cleaning agents market research report delivers an acute valuation and taxonomy of the Industrial Cleaning Agents industry by practically splitting the market on the basis of different types, applications, and regions. Through the analysis of the historical and projected trends, all the segments and sub-segments were evaluated through the bottom-up approach, and different market sizes have been projected for FY 2020 to FY 2026. The regional segmentation of the industrial cleaning agents industry includes the complete classification of all the major continents including North America, Latin America, Europe, Asia Pacific, and Middle East & Africa. Further, country-wise data for the industrial cleaning agents industry is provided for the leading economies of the world.

The industrial cleaning agents market is segmented based on type and application.  On the basis of type segmentation, the market is classified into a general-purpose cleaner, metal cleaner, textile detergent. In terms of application segmentation, the market is bifurcated into food & beverage, pharmaceuticals, automotive, and others.

logoCompetitive Players

Some of the essential players operating in the industrial cleaning agents market, but not restricted to include :

  • Church & Dwight Co. Inc.
  •  Kimberly-Clark Corporation
  •  KGaA
  •  Reckitt Benckiser Group (RB)
  •  Sealed Air Corporation (Diversey Care)
  •  Ecolab
  •  Prayon
  •  3M Company
  •  The Clorox Company
  •  Procter & Gamble (P&G)
  •  Henkel AG & Co. Unilever
  •  Zep Inc.
  •  Guardian Chemicals
  •  PQ Corporation (Carlyle Group)
  •  Spartan Chemical Company Inc.
  •  Betco Corporation

The taxonomy of the industrial cleaning agents industry by its scope and segmentation is as follows:

logo By Type Segmentation Analysis

  • General-purpose Cleaner
  • Metal Cleaner
  • Textile Detergents

logo By Application Segmentation Analysis

  • Food & Beverage
  • Pharmaceuticals
  • Automotive
  • Others

logo Regional Segmentation Analysis

  • North America
    • The U.S.
    • Canada
  • Europe
    • Germany
    • The UK
    • France
    • Spain
    • Italy
    • Rest of Europe
  • Asia Pacific
    • China
    • Japan
    • India
    • South Korea
    • Southeast Asia
    • Rest of Asia Pacific
  • Latin America
    • Brazil
    • Mexico
    • Rest of Latin America
  • Middle East & Africa
    • GCC
    • South Africa
    • Rest of Middle East & Africa

Table of Content

  1. CHAPTER 1. Executive Summary
  2. CHAPTER 2. Industrial Cleaning Agents market – Type Analysis
    1. 2.1. Global Industrial Cleaning Agents Market – Type Overview
    2. 2.2. Global Industrial Cleaning Agents Market Share, by Type, 2019&2026 (USD Billion)
    3. 2.3. Global Industrial Cleaning Agents Market share, by Type, 2019&2026 (Kilo Tons)
    4. 2.4. General purpose Cleaner
      1. 2.4.1. Global General purpose Cleaner Industrial Cleaning Agents Market, 2016-2026 (USD Billion)
      2. 2.4.2. Global General purpose Cleaner Industrial Cleaning Agents Market, 2016-2026 (Kilo Tons)
    5. 2.5. Metal Cleaner
      1. 2.5.1. Global Metal Cleaner Industrial Cleaning Agents Market, 2016-2026 (USD Billion)
      2. 2.5.2. Global Metal Cleaner Industrial Cleaning Agents Market, 2016-2026 (Kilo Tons)
    6. 2.6. Texttile Detergents
      1. 2.6.1. Global Texttile Detergents Industrial Cleaning Agents Market, 2016-2026 (USD Billion)
      2. 2.6.2. Global Texttile Detergents Industrial Cleaning Agents Market, 2016-2026 (Kilo Tons)
  3. CHAPTER 3. Industrial Cleaning Agents market – Appliaction Analysis
    1. 3.1. Global Industrial Cleaning Agents Market – Appliaction Overview
    2. 3.2. Global Industrial Cleaning Agents Market Share, by Appliaction, 2019&2026 (USD Billion)
    3. 3.3. Global Industrial Cleaning Agents Market share, by Appliaction, 2019&2026 (Kilo Tons)
    4. 3.4. Food & Beverage
      1. 3.4.1. Global Food & Beverage Industrial Cleaning Agents Market, 2016-2026 (USD Billion)
      2. 3.4.2. Global Food & Beverage Industrial Cleaning Agents Market, 2016-2026 (Kilo Tons)
    5. 3.5. Pharmaceuticals
      1. 3.5.1. Global Pharmaceuticals Industrial Cleaning Agents Market, 2016-2026 (USD Billion)
      2. 3.5.2. Global Pharmaceuticals Industrial Cleaning Agents Market, 2016-2026 (Kilo Tons)
    6. 3.6. Automotive
      1. 3.6.1. Global Automotive Industrial Cleaning Agents Market, 2016-2026 (USD Billion)
      2. 3.6.2. Global Automotive Industrial Cleaning Agents Market, 2016-2026 (Kilo Tons)
    7. 3.7. Others
      1. 3.7.1. Global Others Industrial Cleaning Agents Market, 2016-2026 (USD Billion)
      2. 3.7.2. Global Others Industrial Cleaning Agents Market, 2016-2026 (Kilo Tons)
  4. CHAPTER 4. Industrial Cleaning Agents market – Regional Analysis
    1. 4.1. Global Industrial Cleaning Agents Market Regional Overview
    2. 4.2. Global Industrial Cleaning Agents Market Share, by Region, 2019&2026 (Value)
    3. 4.3. Global Industrial Cleaning Agents Market Share, by Region, 2019&2026 (Volume)
    4. 4.4. North America
      1. 4.4.1. North America Industrial Cleaning Agents Market size and forecast, 2016-2026
      2. 4.4.2. North America Industrial Cleaning Agents Market, by Country, 2019 - 2026 (USD Billion)
      3. 4.4.3. North America Market size and forecast, 2016-2026 (Kilo Tons)
      4. 4.4.4. North America Industrial Cleaning Agents Market, by Country, 2019 - 2026 (Kilo Tons)
      5. 4.4.5. North America Industrial Cleaning Agents Market, by Type, 2016-2026
        1. 4.4.5.1. North America Industrial Cleaning Agents Market, by Type, 2016-2026 (USD Billion)
        2. 4.4.5.2. North America Industrial Cleaning Agents Market, by Type, 2016-2026 (Kilo Tons)
      6. 4.4.6. North America Industrial Cleaning Agents Market, by Appliaction, 2016-2026
        1. 4.4.6.1. North America Industrial Cleaning Agents Market, by Appliaction, 2016-2026 (USD Billion)
        2. 4.4.6.2. North America Industrial Cleaning Agents Market, by Appliaction, 2016-2026 (Kilo Tons)
      7. 4.4.7. U.S.
        1. 4.4.7.1. U.S. Market size and forecast, 2016-2026 (USD Billion)
        2. 4.4.7.2. U.S. Market size and forecast, 2016-2026 (Kilo Tons)
      8. 4.4.8. Canada
        1. 4.4.8.1. Canada Market size and forecast, 2016-2026 (USD Billion)
        2. 4.4.8.2. Canada Market size and forecast, 2016-2026 (Kilo Tons)
    5. 4.5. Europe
      1. 4.5.1. Europe Industrial Cleaning Agents Market size and forecast, 2016-2026
      2. 4.5.2. Europe Industrial Cleaning Agents Market, by Country, 2019 - 2026 (USD Billion)
      3. 4.5.3. Europe Market size and forecast, 2016-2026 (Kilo Tons)
      4. 4.5.4. Europe Industrial Cleaning Agents Market, by Country, 2019 - 2026 (Kilo Tons)
      5. 4.5.5. Europe Industrial Cleaning Agents Market, by Type, 2016-2026
        1. 4.5.5.1. Europe Industrial Cleaning Agents Market, by Type, 2016-2026 (USD Billion)
        2. 4.5.5.2. Europe Industrial Cleaning Agents Market, by Type, 2016-2026 (Kilo Tons)
      6. 4.5.6. Europe Industrial Cleaning Agents Market, by Appliaction, 2016-2026
        1. 4.5.6.1. Europe Industrial Cleaning Agents Market, by Appliaction, 2016-2026 (USD Billion)
        2. 4.5.6.2. Europe Industrial Cleaning Agents Market, by Appliaction, 2016-2026 (Kilo Tons)
      7. 4.5.7. Germany
        1. 4.5.7.1. Germany Market size and forecast, 2016-2026 (USD Billion)
        2. 4.5.7.2. Germany Market size and forecast, 2016-2026 (Kilo Tons)
      8. 4.5.8. France
        1. 4.5.8.1. France Market size and forecast, 2016-2026 (USD Billion)
        2. 4.5.8.2. France Market size and forecast, 2016-2026 (Kilo Tons)
      9. 4.5.9. U.K.
        1. 4.5.9.1. U.K. Market size and forecast, 2016-2026 (USD Billion)
        2. 4.5.9.2. U.K. Market size and forecast, 2016-2026 (Kilo Tons)
      10. 4.5.10. Italy
        1. 4.5.10.1. Italy Market size and forecast, 2016-2026 (USD Billion)
        2. 4.5.10.2. Italy Market size and forecast, 2016-2026 (Kilo Tons)
      11. 4.5.11. Spain
        1. 4.5.11.1. Spain Market size and forecast, 2016-2026 (USD Billion)
        2. 4.5.11.2. Spain Market size and forecast, 2016-2026 (Kilo Tons)
      12. 4.5.12. Rest of Europe
        1. 4.5.12.1. Rest of Europe Market size and forecast, 2016-2026 (USD Billion)
        2. 4.5.12.2. Rest of Europe Market size and forecast, 2016-2026 (Kilo Tons)
    6. 4.6. Asia Pacific
      1. 4.6.1. Asia Pacific Industrial Cleaning Agents Market size and forecast, 2016-2026
      2. 4.6.2. Asia Pacific Industrial Cleaning Agents Market, by Country, 2019 - 2026 (USD Billion)
      3. 4.6.3. Asia Pacific Market size and forecast, 2016-2026 (Kilo Tons)
      4. 4.6.4. Asia Pacific Industrial Cleaning Agents Market, by Country, 2019 - 2026 (Kilo Tons)
      5. 4.6.5. Asia Pacific Industrial Cleaning Agents Market, by Type, 2016-2026
        1. 4.6.5.1. Asia Pacific Industrial Cleaning Agents Market, by Type, 2016-2026 (USD Billion)
        2. 4.6.5.2. Asia Pacific Industrial Cleaning Agents Market, by Type, 2016-2026 (Kilo Tons)
      6. 4.6.6. Asia Pacific Industrial Cleaning Agents Market, by Appliaction, 2016-2026
        1. 4.6.6.1. Asia Pacific Industrial Cleaning Agents Market, by Appliaction, 2016-2026 (USD Billion)
        2. 4.6.6.2. Asia Pacific Industrial Cleaning Agents Market, by Appliaction, 2016-2026 (Kilo Tons)
      7. 4.6.7. China
        1. 4.6.7.1. China Market size and forecast, 2016-2026 (USD Billion)
        2. 4.6.7.2. China Market size and forecast, 2016-2026 (Kilo Tons)
      8. 4.6.8. Japan
        1. 4.6.8.1. Japan Market size and forecast, 2016-2026 (USD Billion)
        2. 4.6.8.2. Japan Market size and forecast, 2016-2026 (Kilo Tons)
      9. 4.6.9. India
        1. 4.6.9.1. India Market size and forecast, 2016-2026 (USD Billion)
        2. 4.6.9.2. India Market size and forecast, 2016-2026 (Kilo Tons)
      10. 4.6.10. South Korea
        1. 4.6.10.1. South Korea Market size and forecast, 2016-2026 (USD Billion)
        2. 4.6.10.2. South Korea Market size and forecast, 2016-2026 (Kilo Tons)
      11. 4.6.11. South-East Asia
        1. 4.6.11.1. South-East Asia Market size and forecast, 2016-2026 (USD Billion)
        2. 4.6.11.2. South-East Asia Market size and forecast, 2016-2026 (Kilo Tons)
      12. 4.6.12. Rest of Asia Pacific
        1. 4.6.12.1. Rest of Asia Pacific Market size and forecast, 2016-2026 (USD Billion)
        2. 4.6.12.2. Rest of Asia Pacific Market size and forecast, 2016-2026 (Kilo Tons)
    7. 4.7. Latin America
      1. 4.7.1. Latin America Industrial Cleaning Agents Market size and forecast, 2016-2026
      2. 4.7.2. Latin America Industrial Cleaning Agents Market, by Country, 2019 - 2026 (USD Billion)
      3. 4.7.3. Latin America Market size and forecast, 2016-2026 (Kilo Tons)
      4. 4.7.4. Latin America Industrial Cleaning Agents Market, by Country, 2019 - 2026 (Kilo Tons)
      5. 4.7.5. Latin America Industrial Cleaning Agents Market, by Type, 2016-2026
        1. 4.7.5.1. Latin America Industrial Cleaning Agents Market, by Type, 2016-2026 (USD Billion)
        2. 4.7.5.2. Latin America Industrial Cleaning Agents Market, by Type, 2016-2026 (Kilo Tons)
      6. 4.7.6. Latin America Industrial Cleaning Agents Market, by Appliaction, 2016-2026
        1. 4.7.6.1. Latin America Industrial Cleaning Agents Market, by Appliaction, 2016-2026 (USD Billion)
        2. 4.7.6.2. Latin America Industrial Cleaning Agents Market, by Appliaction, 2016-2026 (Kilo Tons)
      7. 4.7.7. Brazil
        1. 4.7.7.1. Brazil Market size and forecast, 2016-2026 (USD Billion)
        2. 4.7.7.2. Brazil Market size and forecast, 2016-2026 (Kilo Tons)
      8. 4.7.8. Mexico
        1. 4.7.8.1. Mexico Market size and forecast, 2016-2026 (USD Billion)
        2. 4.7.8.2. Mexico Market size and forecast, 2016-2026 (Kilo Tons)
      9. 4.7.9. Rest of Latin America
        1. 4.7.9.1. Rest of Latin America Market size and forecast, 2016-2026 (USD Billion)
        2. 4.7.9.2. Rest of Latin America Market size and forecast, 2016-2026 (Kilo Tons)
    8. 4.8. The Middle-East and Africa
      1. 4.8.1. The Middle-East and Africa Industrial Cleaning Agents Market size and forecast, 2016-2026
      2. 4.8.2. The Middle-East and Africa Industrial Cleaning Agents Market, by Country, 2019 - 2026 (USD Billion)
      3. 4.8.3. The Middle-East and Africa Market size and forecast, 2016-2026 (Kilo Tons)
      4. 4.8.4. The Middle-East and Africa Industrial Cleaning Agents Market, by Country, 2019 - 2026 (Kilo Tons)
      5. 4.8.5. The Middle-East and Africa Industrial Cleaning Agents Market, by Type, 2016-2026
        1. 4.8.5.1. The Middle-East and Africa Industrial Cleaning Agents Market, by Type, 2016-2026 (USD Billion)
        2. 4.8.5.2. The Middle-East and Africa Industrial Cleaning Agents Market, by Type, 2016-2026 (Kilo Tons)
      6. 4.8.6. The Middle-East and Africa Industrial Cleaning Agents Market, by Appliaction, 2016-2026
        1. 4.8.6.1. The Middle-East and Africa Industrial Cleaning Agents Market, by Appliaction, 2016-2026 (USD Billion)
        2. 4.8.6.2. The Middle-East and Africa Industrial Cleaning Agents Market, by Appliaction, 2016-2026 (Kilo Tons)
      7. 4.8.7. GCC Countries
        1. 4.8.7.1. GCC Countries Market size and forecast, 2016-2026 (USD Billion)
        2. 4.8.7.2. GCC Countries Market size and forecast, 2016-2026 (Kilo Tons)
      8. 4.8.8. South Africa
        1. 4.8.8.1. South Africa Market size and forecast, 2016-2026 (USD Billion)
        2. 4.8.8.2. South Africa Market size and forecast, 2016-2026 (Kilo Tons)
      9. 4.8.9. Rest of Middle-East Africa
        1. 4.8.9.1. Rest of Middle-East Africa Market size and forecast, 2016-2026 (USD Billion)
        2. 4.8.9.2. Rest of Middle-East Africa Market size and forecast, 2016-2026 (Kilo Tons)
  5. CHAPTER 5. Industrial Cleaning Agents Production, Consumption, Export, Import by Regions
    1. 5.1. Global Industrial Cleaning Agents production and revenue, 2016-2026 (USD Billion) (Kilo Tons)
    2. 5.2. Global Import and Export Analysis, by Region
  6. CHAPTER 6. Industrial Cleaning Agents market – Competitive Landscape
    1. 6.1. Competitor Market Share – Revenue
    2. 6.2. Market Concentration Rate Analysis, Top 3 and Top 5 Players
    3. 6.3. Competitor Market Share – Volume
    4. 6.4. Strategic Development
      1. 6.4.1. Acquisitions and Mergers
      2. 6.4.2. New Products
      3. 6.4.3. Research & Development Activities
  7. CHAPTER 7. Company Profiles
    1. 7.1. Ecolab
      1. 7.1.1. Company Overview
      2. 7.1.2. Ecolab Sales, Revenue, Price, and Gross Margin
      3. 7.1.3. Product portfolio
      4. 7.1.4. Recent initiatives
    2. 7.2. Kimberly-Clark Corporation
      1. 7.2.1. Company Overview
      2. 7.2.2. Kimberly-Clark Corporation Sales, Revenue, Price, and Gross Margin
      3. 7.2.3. Product portfolio
      4. 7.2.4. Recent initiatives
    3. 7.3. Kimberly-Clark Corporation
      1. 7.3.1. Company Overview
      2. 7.3.2. Kimberly-Clark Corporation Sales, Revenue, Price, and Gross Margin
      3. 7.3.3. Product portfolio
      4. 7.3.4. Recent initiatives
    4. 7.4. Sealed Air Corporation (Diversey Care)
      1. 7.4.1. Company Overview
      2. 7.4.2. Sealed Air Corporation (Diversey Care) Sales, Revenue, Price, and Gross Margin
      3. 7.4.3. Product portfolio
      4. 7.4.4. Recent initiatives
    5. 7.5. The Clorox Company
      1. 7.5.1. Company Overview
      2. 7.5.2. The Clorox Company Sales, Revenue, Price, and Gross Margin
      3. 7.5.3. Product portfolio
      4. 7.5.4. Recent initiatives
    6. 7.6. Procter & Gamble (P&G)
      1. 7.6.1. Company Overview
      2. 7.6.2. Procter & Gamble (P&G) Sales, Revenue, Price, and Gross Margin
      3. 7.6.3. Product portfolio
      4. 7.6.4. Recent initiatives
    7. 7.7. Henkel AG & Co. KGaA
      1. 7.7.1. Company Overview
      2. 7.7.2. Henkel AG & Co. KGaA Sales, Revenue, Price, and Gross Margin
      3. 7.7.3. Product portfolio
      4. 7.7.4. Recent initiatives
    8. 7.8. Reckitt Benckiser Group (RB)
      1. 7.8.1. Company Overview
      2. 7.8.2. Reckitt Benckiser Group (RB) Sales, Revenue, Price, and Gross Margin
      3. 7.8.3. Product portfolio
      4. 7.8.4. Recent initiatives
    9. 7.9. Unilever
      1. 7.9.1. Company Overview
      2. 7.9.2. Unilever Sales, Revenue, Price, and Gross Margin
      3. 7.9.3. Product portfolio
      4. 7.9.4. Recent initiatives
    10. 7.10. Zep Inc.
      1. 7.10.1. Company Overview
      2. 7.10.2. Zep Inc. Sales, Revenue, Price, and Gross Margin
      3. 7.10.3. Product portfolio
      4. 7.10.4. Recent initiatives
    11. 7.11. Church & Dwight Co.
      1. 7.11.1. Company Overview
      2. 7.11.2. Church & Dwight Co. Sales, Revenue, Price, and Gross Margin
      3. 7.11.3. Product portfolio
      4. 7.11.4. Recent initiatives
    12. 7.12. Inc.
      1. 7.12.1. Company Overview
      2. 7.12.2. Inc. Sales, Revenue, Price, and Gross Margin
      3. 7.12.3. Product portfolio
      4. 7.12.4. Recent initiatives
    13. 7.13. Guardian Chemicals
      1. 7.13.1. Company Overview
      2. 7.13.2. Guardian Chemicals Sales, Revenue, Price, and Gross Margin
      3. 7.13.3. Product portfolio
      4. 7.13.4. Recent initiatives
    14. 7.14. PQ Corporation (Carlyle Group)
      1. 7.14.1. Company Overview
      2. 7.14.2. PQ Corporation (Carlyle Group) Sales, Revenue, Price, and Gross Margin
      3. 7.14.3. Product portfolio
      4. 7.14.4. Recent initiatives
    15. 7.15. Prayon
      1. 7.15.1. Company Overview
      2. 7.15.2. Prayon Sales, Revenue, Price, and Gross Margin
      3. 7.15.3. Product portfolio
      4. 7.15.4. Recent initiatives
    16. 7.16. 3M Company
      1. 7.16.1. Company Overview
      2. 7.16.2. 3M Company Sales, Revenue, Price, and Gross Margin
      3. 7.16.3. Product portfolio
      4. 7.16.4. Recent initiatives
    17. 7.17. Spartan Chemical Company
      1. 7.17.1. Company Overview
      2. 7.17.2. Spartan Chemical Company Sales, Revenue, Price, and Gross Margin
      3. 7.17.3. Product portfolio
      4. 7.17.4. Recent initiatives
    18. 7.18. Inc.
      1. 7.18.1. Company Overview
      2. 7.18.2. Inc. Sales, Revenue, Price, and Gross Margin
      3. 7.18.3. Product portfolio
      4. 7.18.4. Recent initiatives
    19. 7.19. Betco Corporation
      1. 7.19.1. Company Overview
      2. 7.19.2. Betco Corporation Sales, Revenue, Price, and Gross Margin
      3. 7.19.3. Product portfolio
      4. 7.19.4. Recent initiatives
  8. CHAPTER 8. Industrial Cleaning Agents — Industry Analysis
    1. 8.1. Introduction and Taxonomy
    2. 8.2. Industrial Cleaning Agents Market – Key Trends
      1. 8.2.1. Market Drivers
      2. 8.2.2. Market Restraints
      3. 8.2.3. Market Opportunities
    3. 8.3. Value Chain Analysis
    4. 8.4. Key Mandates and Regulations
    5. 8.5. Technology Roadmap and Timeline
    6. 8.6. Industrial Cleaning Agents market – Attractiveness Analysis
      1. 8.6.1. By Type
      2. 8.6.2. By Appliaction
      3. 8.6.3. By Region
  9. CHAPTER 9. Raw Material analysis
    1. 9.1. Industrial Cleaning Agents Key Raw Material Analysis
      1. 9.1.1. Key Raw Materials
      2. 9.1.2. Price Trend of Key Raw Materials
    2. 9.2. Key Suppliers of Raw Materials
    3. 9.3. Proportion of Manufacturing Cost Structure
      1. 9.3.1. Raw Materials
      2. 9.3.2. Labor Cost
    4. 9.4. Manufacturing Expenses Analysis of Industrial Cleaning Agents
  10. CHAPTER 10. Industrial Chain, Sourcing Strategy and Downstream Buyers
    1. 10.1. Industrial Cleaning Agents Industrial Chain Analysis
    2. 10.2. Upstream Raw Materials Sourcing
      1. 10.2.1. Risk Mitigation:
      2. 10.2.2. Supplier Relationships:
      3. 10.2.3. Business Processes:
      4. 10.2.4. Securing the Product:
    3. 10.3. Raw Materials Sources of Industrial Cleaning Agents Major Manufacturers in 2016
    4. 10.4. Downstream Buyers
    5. 10.5. Distributors/Traders List
  11. CHAPTER 11. Marketing Strategy Analysis, Distributors
    1. 11.1. Marketing Channel
    2. 11.2. Direct Marketing
    3. 11.3. Indirect Marketing
    4. 11.4. Marketing Channel Development Trend
    5. 11.5. Economic/Political Environmental Change
  12. CHAPTER 12. Report Conclusion
  13. CHAPTER 13. Research Approach & Methodology
    1. 13.1. Report Description
    2. 13.2. Research Scope
    3. 13.3. Research Methodology
      1. 13.3.1. Secondary Research
      2. 13.3.2. Primary Research
      3. 13.3.3. Models
        1. 13.3.3.1. Company Share Analysis Model
        2. 13.3.3.2. Revenue Based Modeling
        3. 13.3.3.3. Research Limitations

        List of Figures

        FIG. 1 Global Industrial Cleaning Agents Market, 2016-2026 (USD Billion)
        FIG. 2 Global Industrial Cleaning Agents Market Share, by Type, 2019&2026 (USD Billion)
        FIG. 3 Global Industrial Cleaning Agents Market share, by Type, 2019&2026 (Kilo Tons)
        FIG. 4 Global General purpose Cleaner Industrial Cleaning Agents Market, 2016-2026 (USD Billion)
        FIG. 5 Global General purpose Cleaner Industrial Cleaning Agents  Market, 2016-2026 (Kilo Tons)
        FIG. 6 Global Metal Cleaner Industrial Cleaning Agents Market, 2016-2026 (USD Billion)
        FIG. 7 Global Metal Cleaner Industrial Cleaning Agents  Market, 2016-2026 (Kilo Tons)
        FIG. 8 Global Texttile Detergents Industrial Cleaning Agents Market, 2016-2026 (USD Billion)
        FIG. 9 Global Texttile Detergents Industrial Cleaning Agents  Market, 2016-2026 (Kilo Tons)
        FIG. 10 Global Industrial Cleaning Agents Market Share, by Appliaction, 2019&2026 (USD Billion)
        FIG. 11 Global Industrial Cleaning Agents Market share, by Appliaction, 2019&2026 (Kilo Tons)
        FIG. 12 Global Food & Beverage Industrial Cleaning Agents Market, 2016-2026 (USD Billion)
        FIG. 13 Global Food & Beverage Industrial Cleaning Agents  Market, 2016-2026 (Kilo Tons)
        FIG. 14 Global Pharmaceuticals Industrial Cleaning Agents Market, 2016-2026 (USD Billion)
        FIG. 15 Global Pharmaceuticals Industrial Cleaning Agents  Market, 2016-2026 (Kilo Tons)
        FIG. 16 Global Automotive Industrial Cleaning Agents Market, 2016-2026 (USD Billion)
        FIG. 17 Global Automotive Industrial Cleaning Agents  Market, 2016-2026 (Kilo Tons)
        FIG. 18 Global Others Industrial Cleaning Agents Market, 2016-2026 (USD Billion)
        FIG. 19 Global Others Industrial Cleaning Agents  Market, 2016-2026 (Kilo Tons)
        FIG. 20 Global Industrial Cleaning Agents Market Share, by Region, 2019&2026
        FIG. 21 Global Industrial Cleaning Agents Market Share, by Region, 2019&2026
        FIG. 22 North America Industrial Cleaning Agents Market, 2016-2026
        FIG. 23 North America Industrial Cleaning Agents  Market, 2016-2026 (Kilo Tons)
        FIG. 24 U.S. Industrial Cleaning Agents Market, 2016-2026
        FIG. 25 U.S. Industrial Cleaning Agents  Market, 2016-2026 (Kilo Tons)
        FIG. 26 Canada Industrial Cleaning Agents Market, 2016-2026
        FIG. 27 Canada Industrial Cleaning Agents  Market, 2016-2026 (Kilo Tons)
        FIG. 28 Europe Industrial Cleaning Agents Market, 2016-2026
        FIG. 29 Europe Industrial Cleaning Agents  Market, 2016-2026 (Kilo Tons)
        FIG. 30 Germany Industrial Cleaning Agents Market, 2016-2026
        FIG. 31 Germany Industrial Cleaning Agents  Market, 2016-2026 (Kilo Tons)
        FIG. 32 France Industrial Cleaning Agents Market, 2016-2026
        FIG. 33 France Industrial Cleaning Agents  Market, 2016-2026 (Kilo Tons)
        FIG. 34 U.K. Industrial Cleaning Agents Market, 2016-2026
        FIG. 35 U.K. Industrial Cleaning Agents  Market, 2016-2026 (Kilo Tons)
        FIG. 36 Italy Industrial Cleaning Agents Market, 2016-2026
        FIG. 37 Italy Industrial Cleaning Agents  Market, 2016-2026 (Kilo Tons)
        FIG. 38 Spain Industrial Cleaning Agents Market, 2016-2026
        FIG. 39 Spain Industrial Cleaning Agents  Market, 2016-2026 (Kilo Tons)
        FIG. 40 Rest of Europe Industrial Cleaning Agents Market, 2016-2026
        FIG. 41 Rest of Europe Industrial Cleaning Agents  Market, 2016-2026 (Kilo Tons)
        FIG. 42 Asia Pacific Industrial Cleaning Agents Market, 2016-2026
        FIG. 43 Asia Pacific Industrial Cleaning Agents  Market, 2016-2026 (Kilo Tons)
        FIG. 44 China Industrial Cleaning Agents Market, 2016-2026
        FIG. 45 China Industrial Cleaning Agents  Market, 2016-2026 (Kilo Tons)
        FIG. 46 Japan Industrial Cleaning Agents Market, 2016-2026
        FIG. 47 Japan Industrial Cleaning Agents  Market, 2016-2026 (Kilo Tons)
        FIG. 48 India Industrial Cleaning Agents Market, 2016-2026
        FIG. 49 India Industrial Cleaning Agents  Market, 2016-2026 (Kilo Tons)
        FIG. 50 South  Korea Industrial Cleaning Agents Market, 2016-2026
        FIG. 51 South  Korea Industrial Cleaning Agents  Market, 2016-2026 (Kilo Tons)
        FIG. 52 South-East Asia Industrial Cleaning Agents Market, 2016-2026
        FIG. 53 South-East Asia Industrial Cleaning Agents  Market, 2016-2026 (Kilo Tons)
        FIG. 54 Rest of Asia Pacific Industrial Cleaning Agents Market, 2016-2026
        FIG. 55 Rest of Asia Pacific Industrial Cleaning Agents  Market, 2016-2026 (Kilo Tons)
        FIG. 56 Latin America Industrial Cleaning Agents Market, 2016-2026
        FIG. 57 Latin America Industrial Cleaning Agents  Market, 2016-2026 (Kilo Tons)
        FIG. 58 Brazil Industrial Cleaning Agents Market, 2016-2026
        FIG. 59 Brazil Industrial Cleaning Agents  Market, 2016-2026 (Kilo Tons)
        FIG. 60 Mexico Industrial Cleaning Agents Market, 2016-2026
        FIG. 61 Mexico Industrial Cleaning Agents  Market, 2016-2026 (Kilo Tons)
        FIG. 62 Rest of Latin America Industrial Cleaning Agents Market, 2016-2026
        FIG. 63 Rest of Latin America Industrial Cleaning Agents  Market, 2016-2026 (Kilo Tons)
        FIG. 64 The Middle-East and Africa Industrial Cleaning Agents Market, 2016-2026
        FIG. 65 The Middle-East and Africa Industrial Cleaning Agents  Market, 2016-2026 (Kilo Tons)
        FIG. 66 GCC Countries Industrial Cleaning Agents Market, 2016-2026
        FIG. 67 GCC Countries Industrial Cleaning Agents  Market, 2016-2026 (Kilo Tons)
        FIG. 68 South Africa Industrial Cleaning Agents Market, 2016-2026
        FIG. 69 South Africa Industrial Cleaning Agents  Market, 2016-2026 (Kilo Tons)
        FIG. 70 Rest of Middle-East Africa Industrial Cleaning Agents Market, 2016-2026
        FIG. 71 Rest of Middle-East Africa Industrial Cleaning Agents  Market, 2016-2026 (Kilo Tons)
        FIG. 72 Global Industrial Cleaning Agents production and revenue, 2016-2026 (USD Billion) (Kilo Tons)
        FIG. 73 North America Industrial Cleaning Agents production and revenue, 2016-2026 (USD Billion) (Kilo Tons)
        FIG. 74 Europe Industrial Cleaning Agents production and revenue, 2016-2026 (USD Billion) (Kilo Tons)
        FIG. 75 Asia Pacific Industrial Cleaning Agents production and revenue, 2016-2026 (USD Billion) (Kilo Tons)
        FIG. 76 Latin America Industrial Cleaning Agents production and revenue, 2016-2026 (USD Billion) (Kilo Tons)
        FIG. 77 Middle East and Africa Industrial Cleaning Agents production and revenue, 2016-2026 (USD Billion) (Kilo Tons)
        FIG. 78 Competitor Market Share – Revenue
        FIG. 79 Competitor Market Share – Volume
        FIG. 80 Ecolab Revenue and Growth Rate
        FIG. 81 Ecolab Market Share
        FIG. 82 Kimberly-Clark Corporation Revenue and Growth Rate
        FIG. 83 Kimberly-Clark Corporation Market Share
        FIG. 84 Kimberly-Clark Corporation Revenue and Growth Rate
        FIG. 85 Kimberly-Clark Corporation Market Share
        FIG. 86 Sealed Air Corporation (Diversey Care) Revenue and Growth Rate
        FIG. 87 Sealed Air Corporation (Diversey Care) Market Share
        FIG. 88 The Clorox Company Revenue and Growth Rate
        FIG. 89 The Clorox Company Market Share
        FIG. 90 Procter & Gamble (P&G) Revenue and Growth Rate
        FIG. 91 Procter & Gamble (P&G) Market Share
        FIG. 92 Henkel AG & Co. KGaA Revenue and Growth Rate
        FIG. 93 Henkel AG & Co. KGaA Market Share
        FIG. 94 Reckitt Benckiser Group (RB) Revenue and Growth Rate
        FIG. 95 Reckitt Benckiser Group (RB) Market Share
        FIG. 96 Unilever Revenue and Growth Rate
        FIG. 97 Unilever Market Share
        FIG. 98 Zep Inc. Revenue and Growth Rate
        FIG. 99 Zep Inc. Market Share
        FIG. 100 Church & Dwight Co. Revenue and Growth Rate
        FIG. 101 Church & Dwight Co. Market Share
        FIG. 102 Inc. Revenue and Growth Rate
        FIG. 103 Inc. Market Share
        FIG. 104 Guardian Chemicals Revenue and Growth Rate
        FIG. 105 Guardian Chemicals Market Share
        FIG. 106 PQ Corporation (Carlyle Group) Revenue and Growth Rate
        FIG. 107 PQ Corporation (Carlyle Group) Market Share
        FIG. 108 Prayon Revenue and Growth Rate
        FIG. 109 Prayon Market Share
        FIG. 110 3M Company Revenue and Growth Rate
        FIG. 111 3M Company Market Share
        FIG. 112 Spartan Chemical Company Revenue and Growth Rate
        FIG. 113 Spartan Chemical Company Market Share
        FIG. 114 Inc. Revenue and Growth Rate
        FIG. 115 Inc. Market Share
        FIG. 116 Betco Corporation Revenue and Growth Rate
        FIG. 117 Betco Corporation Market Share
        FIG. 118 Market Dynamics
        FIG. 119 Global Industrial Cleaning Agents – Value Chain Analysis
        FIG. 120 Key Mandates and Regulations
        FIG. 121 Technology Roadmap and Timeline
        FIG. 122 Market Attractiveness Analysis – By Type
        FIG. 123 Market Attractiveness Analysis – By Appliaction
        FIG. 124 Market Attractiveness Analysis – By Region
        FIG. 125 Manufacturing Cost Structure of Industrial Cleaning Agents
        FIG. 126 Industrial Cleaning Agents Industrial Chain Analysis
        FIG. 127 Market Channel
        FIG. 128 Marketing Channel Development Trend
        FIG. 129 Growth in World Gross Product, 2008-2019

        List of Tables

        TABLE 1 Global Industrial Cleaning Agents market, 2019&2026 (USD Billion)
        TABLE 2 Global Industrial Cleaning Agents market, by Type, 2016-2026 (USD Billion)
        TABLE 3 Global Industrial Cleaning Agents market, by Type, 2016-2026 (Kilo Tons)
        TABLE 4 Global Industrial Cleaning Agents market, by Appliaction, 2016-2026 (USD Billion)
        TABLE 5 Global Industrial Cleaning Agents market, by Appliaction, 2016-2026 (Kilo Tons)
        TABLE 6 Global Industrial Cleaning Agents market, by region, 2016-2026 (USD Billion)
        TABLE 7 Global Industrial Cleaning Agents market, by region, 2016-2026 (Kilo Tons)
        TABLE 8 North America Industrial Cleaning Agents Market, by Type, 2016-2026 (USD Billion)
        TABLE 9 North America Industrial Cleaning Agents Market, by Type, 2016-2026 (Kilo Tons)
        TABLE 10 North America Industrial Cleaning Agents Market, by Appliaction, 2016-2026 (USD Billion)
        TABLE 11 North America Industrial Cleaning Agents Market, by Appliaction, 2016-2026 (Kilo Tons)
        TABLE 12 Europe Industrial Cleaning Agents Market, by Type, 2016-2026 (USD Billion)
        TABLE 13 Europe Industrial Cleaning Agents Market, by Type, 2016-2026 (Kilo Tons)
        TABLE 14 Europe Industrial Cleaning Agents Market, by Appliaction, 2016-2026 (USD Billion)
        TABLE 15 Europe Industrial Cleaning Agents Market, by Appliaction, 2016-2026 (Kilo Tons)
        TABLE 16 Asia Pacific Industrial Cleaning Agents Market, by Type, 2016-2026 (USD Billion)
        TABLE 17 Asia Pacific Industrial Cleaning Agents Market, by Type, 2016-2026 (Kilo Tons)
        TABLE 18 Asia Pacific Industrial Cleaning Agents Market, by Appliaction, 2016-2026 (USD Billion)
        TABLE 19 Asia Pacific Industrial Cleaning Agents Market, by Appliaction, 2016-2026 (Kilo Tons)
        TABLE 20 Latin America Industrial Cleaning Agents Market, by Type, 2016-2026 (USD Billion)
        TABLE 21 Latin America Industrial Cleaning Agents Market, by Type, 2016-2026 (Kilo Tons)
        TABLE 22 Latin America Industrial Cleaning Agents Market, by Appliaction, 2016-2026 (USD Billion)
        TABLE 23 Latin America Industrial Cleaning Agents Market, by Appliaction, 2016-2026 (Kilo Tons)
        TABLE 24 The Middle-East and Africa Industrial Cleaning Agents Market, by Type, 2016-2026 (USD Billion)
        TABLE 25 The Middle-East and Africa Industrial Cleaning Agents Market, by Type, 2016-2026 (Kilo Tons)
        TABLE 26 The Middle-East and Africa Industrial Cleaning Agents Market, by Appliaction, 2016-2026 (USD Billion)
        TABLE 27 The Middle-East and Africa Industrial Cleaning Agents Market, by Appliaction, 2016-2026 (Kilo Tons)
        TABLE 28 North America Industrial Cleaning Agents Production, Consumption, Export, Import, 2016-2019
        TABLE 29 Europe Industrial Cleaning Agents Production, Consumption, Export, Import, 2016-2019
        TABLE 30 Asia Pacific Industrial Cleaning Agents Production, Consumption, Export, Import, 2016-2019
        TABLE 31 Latin America Industrial Cleaning Agents Production, Consumption, Export, Import, 2016-2019
        TABLE 32 Middle East & Africa Industrial Cleaning Agents Production, Consumption, Export, Import, 2016-2019
        TABLE 33 Global Industrial Cleaning Agents Market - Company Revenue Analysis 2016-2019 (USD Billion)
        TABLE 34 Global Industrial Cleaning Agents Market - Company Revenue Share Analysis 2016-2019(%)
        TABLE 35 Global Industrial Cleaning Agents Market - Company Volume Analysis 2016-2019 (Kilo Tons)
        TABLE 36 Global Industrial Cleaning Agents Market - Company Volume Share Analysis 2016-2019(%)
        TABLE 37 Acquisitions and Mergers
        TABLE 38 New Product/Service Launch
        TABLE 39 Research & Development Activities
        TABLE 40 Market Drivers
        TABLE 41 Market Restraints
        TABLE 42 Market Opportunities
        TABLE 43 Production Base and Market Concentration Rate of Raw Material
        TABLE 44 Key Suppliers of Raw Materials
        TABLE 45 Raw Materials Sources of Industrial Cleaning Agents Major Manufacturers in 2016
        TABLE 46 Major Buyers of Industrial Cleaning Agents
        TABLE 47 Distributors/Traders of Industrial Cleaning Agents by Region

Industry Major Market Players

  • Church & Dwight Co. Inc.
  •  Kimberly-Clark Corporation
  •  KGaA
  •  Reckitt Benckiser Group (RB)
  •  Sealed Air Corporation (Diversey Care)
  •  Ecolab
  •  Prayon
  •  3M Company
  •  The Clorox Company
  •  Procter & Gamble (P&G)
  •  Henkel AG & Co. Unilever
  •  Zep Inc.
  •  Guardian Chemicals
  •  PQ Corporation (Carlyle Group)
  •  Spartan Chemical Company Inc.
  •  Betco Corporation