![]()
Search Market Research Report
ICT Investment in Government Market Size, Share Global Analysis Report, ment in Government Market by Solution (Devices, Software, IT Services, Data Center Systems, and Communication Services) and By Technology (IoT, Big data, Cloud Computing, Content management, and Security): Global Industry Perspective, Comprehensive Analysis, and Forecast, 2021 – 2026

ICT Investment in Government Market by Solution (Devices, Software, IT Services, Data Center Systems, and Communication Services) and By Technology (IoT, Big data, Cloud Computing, Content management, and Security): Global Industry Perspective, Comprehensive Analysis, and Forecast, 2021 – 2026
Industry Insights
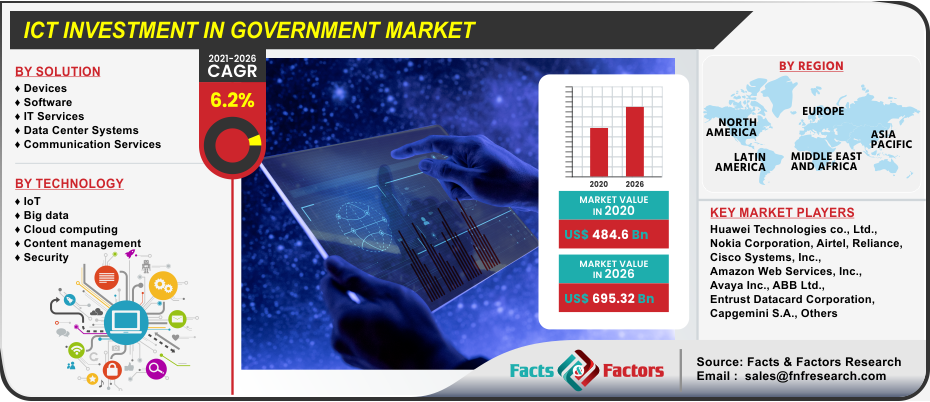
[179+ Pages Research Report] As per the Facts and Factors market research report, the global ICT investment in government market is expected to reach USD 695.32 billion by 2026 from USD 484.6 Billion in 2020, and grow at a CAGR of around 6.2% during the forecast period.
 Market Overview
ICT investments in North America are expected to rise as a result of the need to improve IT asset management. Due to the continuous retooling of settings with infrastructure, cloud, IoT, and mobility solutions, the demand for enhanced products and services to solve vulnerabilities in information security may expand. ICT spending in the Asia Pacific may increase as a result of a greater emphasis on cross-functional activities to promote long-term local innovation. Furthermore, regional governments in the Asia Pacific, which are expected to assist with market growth improvisation in the near future, could operate as catalysts for foreign direct investment (FDI) and local organizational development.
Industry Growth Factors
Organizations are taking advantage of the cost-cutting and long-term benefits that mobility and cloud technology providers. In order to adopt IoT and cloud-based solutions, regional governments are incorporating information and communication strategies into their service transformation roadmaps. For instance, the State governments in Australia are implementing cloud-first policies to encourage cloud investments as part of their entire ICT stack.
Application developers are becoming an important element of the ICT ecosystem, collaborating closely with vendors and partner communities to provide government agencies with solutions. While driving digital innovation in the public sector, Chief Information Officers (CIOs) are focusing on maximizing their companies and IT expenditures. They're also dealing with cultural and institutional issues that are restricting IoT, data analytics, cloud, and mobile's ability to create transformative change.
Report Scope
Report Attribute |
Details |
Market Size in 2020 |
USD 484.6 Billion |
Projected Market Size in 2026 |
USD 695.32 Billion |
CAGR Growth Rate |
6.2% CAGR |
Base Year |
2020 |
Forecast Years |
2021-2026 |
Key Market Players |
Huawei Technologies co., Ltd., Nokia Corporation, Airtel, Reliance, Cisco Systems, Inc., Amazon Web Services, Inc., Avaya Inc., ABB Ltd., Entrust Datacard Corporation, Capgemini S.A., Imex Systems Inc., Symantec Corporation, IBM Corporation, Oracle Corporation, and OpenGov Inc., among others. |
Key Segment |
By Solution, By Technology, and By Region |
Major Regions Covered |
North America, Europe, Asia Pacific, Latin America, and the Middle East & Africa |
Purchase Options |
Request customized purchase options to meet your research needs. Explore purchase options |
Segmentation Analysis
Based on the solution, the market is bifurcated into software, devices, IT services, communication services, and data center systems. Based on technology, the market is bifurcated into security, IoT, cloud computing, big data, and content management.
Regional Analysis
Based on regions, the global ICT Investment In the Government market can be divided into five main regions namely, North America, Europe, Latin America, Asia Pacific, and The Middle East and Africa.
Due to the increased penetration of smart technologies such as the Internet of Things, big data, and cloud computing, the market in North America is expected to rise significantly during the forecast period. Furthermore, in the North American areas, there has been an increase in investment for the deployment of smart solutions at various government levels. In terms of ICT investments, the Asia Pacific region is predicted to be the fastest-growing region; this growth can be due to increased collaboration between solution providers, telecom service providers, and device vendors. The drive to diversify the MEA economy beyond oil and gas has resulted in substantial industrial refocusing, as well as the embrace of IoT and the expansion of smart city programs.
Competitive Players
The key players in the ICT Investment In Government market are :
- Huawei Technologies co. Ltd.
- Nokia Corporation
- Airtel
- Reliance
- Cisco Systems Inc.
- Amazon Web Services Inc.
- Avaya Inc.
- ABB Ltd.
- Entrust Datacard Corporation
- Capgemini S.A.
- Imex Systems Inc.
- Symantec Corporation
- IBM Corporation
- Oracle Corporation
- OpenGov Inc.
By Solution Segment Analysis
- Devices
- Software
- IT Services
- Data Center Systems
- Communication Services
By Technology Segment Analysis
- IoT
- Big data
- Cloud computing
- Content management
- Security
Regional Segment Analysis
- North America
- U.S.
- Canada
- Europe
- The UK
- France
- Germany
- Italy
- Spain
- Rest of Europe
- Asia Pacific
- China
- Japan
- India
- South Korea
- Southeast Asia
- Rest of Asia Pacific
- Latin America
- Brazil
- Mexico
- Rest of Latin America
- Middle East and Africa
- GCC Countries
- South Africa
- Rest of Middle East and Africa
Table of Content
Industry Major Market Players
- Huawei Technologies co. Ltd.
- Nokia Corporation
- Airtel
- Reliance
- Cisco Systems Inc.
- Amazon Web Services Inc.
- Avaya Inc.
- ABB Ltd.
- Entrust Datacard Corporation
- Capgemini S.A.
- Imex Systems Inc.
- Symantec Corporation
- IBM Corporation
- Oracle Corporation
- OpenGov Inc.


Copyright © 2025 - 2026, All Rights Reserved, Facts and Factors