Search Market Research Report

Discover Our Latest Reports
Discover Our Featured Reports
Discover Top Selling Reports

Hospital Mobile X-Ray Market Size, Share Global Analysis Report, , 2021 – 2026

report img

Hospital Mobile X-Ray Market By Technology (Computed Radiography & Direct Radiography), By Configuration (Fixed Arm & Rotating Arm), By End-Users (Operating Theatres, Emergency Departments, ICU and Neonatal ICU (Intensive Care Units), Central X-ray Departments, Premature Birth Wards, & Others), And By Regions – Global & Regional Industry Perspective, Comprehensive Analysis, and Forecast, 2021 – 2026

Industry Insights

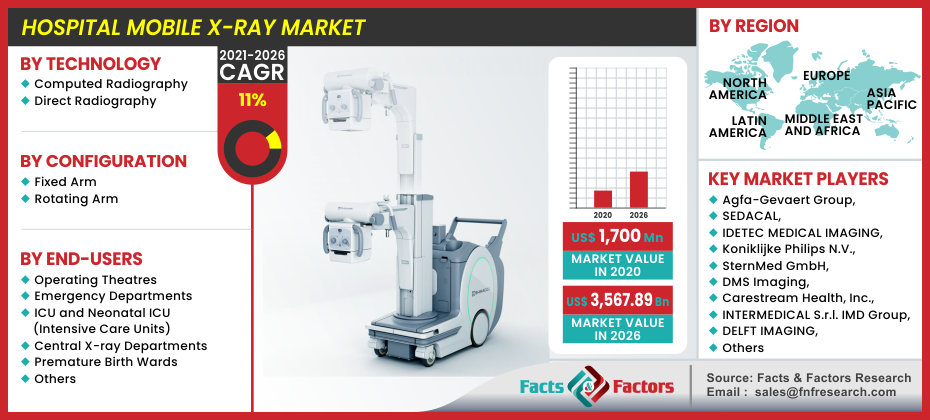
[176+ Pages Report] The latest offering from facts and factors, named “Hospital Mobile X-Ray Market,” provides a thorough analysis of the product, as well as a global view. We forecast the global Hospital Mobile X-Ray Market to reach a whopping USD 3,567.89 Million in 2026, up 11% from a value of USD 1,700 Million in the base year of 2020.

logoMarket Overview

Mobile radiographic units are a mechanical system that can be transported from one place to another for conducting procedures that a regular x-ray can perform. Portable x-rays often eliminate the unnecessary transport in the patient’s body and are often appreciated for easy functionality and usability. Additionally these devices offer less processing time and downtime after operations are completed. As traditional X-rays can often emit larger amounts of radiographic waves, portable X-ray units reduce the X-ray exposure by tenfold. The latest iteration of mobile X-rays even produce superior images when compared to its counterpart.

logoIndustry Growth Factors

The global hospital mobile X-ray market is driven by a rise in chronic diseases and a growing trend of adaption of such devices for prominent procedures. Increase in cancerous, cardiovascular conditions, and musculoskeletal diseases are among the lead conditions that will further lead to a boost in sales related to the hospital mobile X-ray market. Furthermore, increase in conditions arising from arthritis among adults and children alike will open new revenue opportunities for the market to flourish during the forecast. A significant rise in people suffering from muscular conditions will further enable the global mobile X-ray market to establish a higher footprint across a global outlook.

Advancements in technology coupled with addition of new features such as motorized transportation, easy usability, and streamlined process will boost the sales of hospital mobile X-ray devices. Addition of security feature such as anti-collision technology and pressure sensitive steering will further enable medical practitioners and professionals to acquire better quality images while saving valuable time. However, poor reimbursement checks and high cost of operation will disrupt the market of hospital mobile X-ray market to a certain extent.

Hospital Mobile X-Ray Market

To know more about this report | Request Free Sample Copy

logoSegmentation Analysis

The global hospital mobile x-ray market can be segmented on the basis of technology, configuration, end-users, and regions.

The global hospital mobile X-ray market is divided into computed radiography & direct radiography on the basis of technology. The computed radiography is expected to occupy the largest market share during the forecast owing to low risk complication when compared to its counterpart along with less downtime. However, the segment of direct radiography will witness the fastest growing CAGR. The hospital mobile X-ray market is bifurcated into fixed arm & rotating arm on the basis of configuration. The fixed arm segment is expected to witness the largest market share during the forecast owing to configuration and functionality. The global hospital X-ray market can be fragmented into by ward, operating theatres, emergency departments, ICU and neonatal ICU (Intensive Care Units), central X-ray departments, premature birth wards, and others on the basis of end-users. The segment of operating theaters is expected to witness the highest market share during the advent of the forecast owing to increase of patients admitted in hospitals with complaints of acute respiratory failure, acute cardiopulmonary edema, chronic obstructive pulmonary disease, and asthma.

logo Regional Analysis

Asia Pacific market is estimated to exhibit highest CAGR owing to the growing investments in diagnostic imaging, advancements in healthcare infrastructure, high disposable income, and bigger insurance coverage. Additionally, the speedy reimbursements coupled with government initiative programs to create more awareness about health are likely to offer immense potential to the hospital mobile X-ay products market.

logoReport Scope

Report Attribute

Details

Market Size in 2020

USD 1,700 Million

Projected Market Size in 2026

USD 3,567.89 Million

CAGR Growth Rate

11% CAGR

Base Year

2020

Forecast Years

2021–2026

Key Market Players

Agfa-Gevaert Group, SEDACAL, IDETEC MEDICAL IMAGING, Koniklijke Philips N.V., SternMed GmbH, DMS Imaging, Carestream Health, Inc., INTERMEDICAL S.r.l. IMD Group, DELFT IMAGING, and OR Technology, among others.

Key Segment

By Technology, By Configuration, By End-User, and By Region

Major Regions Covered

North America, Europe, Asia Pacific, Latin America, and the Middle East & Africa

Purchase Options

Request customized purchase options to meet your research needs. Explore purchase options

logo Competitive Players

The key participants in the global hospital mobile X-ray market are :

  • Agfa-Gevaert Group
  • SEDACAL
  • IDETEC MEDICAL IMAGING
  • Koniklijke Philips N.V.
  • SternMed GmbH
  • DMS Imaging
  • Carestream Health Inc.
  • INTERMEDICAL S.r.l. IMD Group
  • DELFT IMAGING  
  • OR Technology

logo By Technology Segment Analysis

  • Computed Radiography
  • Direct Radiography

logo By Configuration Segment Analysis

  • Fixed Arm
  • Rotating Arm

logo By End-Users Segment Analysis

  • Operating Theatres
  • Emergency Departments
  • ICU and Neonatal ICU (Intensive Care Units)
  • Central X-ray Departments
  • Premature Birth Wards
  • Others

logo By Regional Segment Analysis

  • North America
    • U.S.
    • Canada
    • Mexico
  • Europe
    • UK
    • France
    • Germany
    • Italy
    • Spain
    • Rest of Europe
  • Asia Pacific
    • China
    • Japan
    • India
    • South Korea
    • Southeast Asia
    • Rest of Asia Pacific
  • Latin America
    • Brazil
    • Mexico
    • Rest of Latin America
  • Middle East and Africa
    • GCC Countries
    • South Africa
    • Rest of MEA

Table of Content

  1. Chapter 1 Executive Summary
    1. 1.1. Introduction of Hospital Mobile X-Ray
    2. 1.2. Global Hospital Mobile X-Ray Market, 2020 & 2026 (USD Million)
    3. 1.3. Global Hospital Mobile X-Ray Market, 2016 – 2026 (USD Million)
    4. 1.4. Global Hospital Mobile X-Ray Market Absolute Revenue Opportunity, 2016 – 2026 (USD Million)
    5. 1.5. Global Hospital Mobile X-Ray Market Incremental Revenue Opportunity, 2020 – 2026 (USD Million)
  2. Chapter 2 Hospital Mobile X-Ray Market – Technology Analysis
    1. 2.1. Global Hospital Mobile X-Ray Market – Technology Overview
    2. 2.2. Global Hospital Mobile X-Ray Market Share, by Technology, 2020 & 2026 (USD Million)
    3. 2.3. Computed Radiography
      1. 2.3.1. Global Computed Radiography Hospital Mobile X-Ray Market, 2016 – 2026 (USD Million)
    4. 2.4. Direct Radiography
      1. 2.4.1. Global Direct Radiography Hospital Mobile X-Ray Market, 2016 – 2026 (USD Million)
  3. Chapter 3 Hospital Mobile X-Ray Market – Configuration Analysis
    1. 3.1. Global Hospital Mobile X-Ray Market – Configuration Overview
    2. 3.2. Global Hospital Mobile X-Ray Market Share, by Configuration, 2020 & 2026 (USD Million)
    3. 3.3. Fixed Arm
      1. 3.3.1. Global Fixed Arm Hospital Mobile X-Ray Market, 2016 – 2026 (USD Million)
    4. 3.4. Rotating Arm
      1. 3.4.1. Global Rotating Arm Hospital Mobile X-Ray Market, 2016 – 2026 (USD Million)
  4. Chapter 4 Hospital Mobile X-Ray Market – End-Users Analysis
    1. 4.1. Global Hospital Mobile X-Ray Market – End-Users Overview
    2. 4.2. Global Hospital Mobile X-Ray Market Share, by End-Users, 2020 & 2026 (USD Million)
    3. 4.3. Operating Theatres
      1. 4.3.1. Global Operating Theatres Hospital Mobile X-Ray Market, 2016 – 2026 (USD Million)
    4. 4.4. Emergency Departments
      1. 4.4.1. Global Emergency Departments Hospital Mobile X-Ray Market, 2016 – 2026 (USD Million)
    5. 4.5. ICU and Neonatal ICU (Intensive Care Units)
      1. 4.5.1. Global ICU and Neonatal ICU (Intensive Care Units) Hospital Mobile X-Ray Market, 2016 – 2026 (USD Million)
    6. 4.6. Central X-ray Departments
      1. 4.6.1. Global Central X-ray Departments Hospital Mobile X-Ray Market, 2016 – 2026 (USD Million)
    7. 4.7. Premature Birth Wards
      1. 4.7.1. Global Premature Birth Wards Hospital Mobile X-Ray Market, 2016 – 2026 (USD Million)
    8. 4.8. Others
      1. 4.8.1. Global Others Hospital Mobile X-Ray Market, 2016 – 2026 (USD Million)
  5. Chapter 5 Hospital Mobile X-Ray Market – Regional Analysis
    1. 5.1. Global Hospital Mobile X-Ray Market Regional Overview
    2. 5.2. Global Hospital Mobile X-Ray Market Share, by Region, 2020 & 2026 (USD Million)
    3. 5.3. North America
      1. 5.3.1. North America Hospital Mobile X-Ray Market, 2016 – 2026 (USD Million)
        1. 5.3.1.1. North America Hospital Mobile X-Ray Market, by Country, 2016 - 2026 (USD Million)
      2. 5.3.2. North America Hospital Mobile X-Ray Market, by Technology, 2016 – 2026
        1. 5.3.2.1. North America Hospital Mobile X-Ray Market, by Technology, 2016 – 2026 (USD Million)
      3. 5.3.3. North America Hospital Mobile X-Ray Market, by Configuration, 2016 – 2026
        1. 5.3.3.1. North America Hospital Mobile X-Ray Market, by Configuration, 2016 – 2026 (USD Million)
      4. 5.3.4. North America Hospital Mobile X-Ray Market, by End-Users, 2016 – 2026
        1. 5.3.4.1. North America Hospital Mobile X-Ray Market, by End-Users, 2016 – 2026 (USD Million)
      5. 5.3.5. U.S.
        1. 5.3.5.1. U.S. Hospital Mobile X-Ray Market, 2016 – 2026 (USD Million)
      6. 5.3.6. Canada
        1. 5.3.6.1. Canada Hospital Mobile X-Ray Market, 2016 – 2026 (USD Million)
      7. 5.3.7. Mexico
        1. 5.3.7.1. Mexico Hospital Mobile X-Ray Market, 2016 – 2026 (USD Million)
    4. 5.4. Europe
      1. 5.4.1. Europe Hospital Mobile X-Ray Market, 2016 – 2026 (USD Million)
        1. 5.4.1.1. Europe Hospital Mobile X-Ray Market, by Country, 2016 - 2026 (USD Million)
      2. 5.4.2. Europe Hospital Mobile X-Ray Market, by Technology, 2016 – 2026
        1. 5.4.2.1. Europe Hospital Mobile X-Ray Market, by Technology, 2016 – 2026 (USD Million)
      3. 5.4.3. Europe Hospital Mobile X-Ray Market, by Configuration, 2016 – 2026
        1. 5.4.3.1. Europe Hospital Mobile X-Ray Market, by Configuration, 2016 – 2026 (USD Million)
      4. 5.4.4. Europe Hospital Mobile X-Ray Market, by End-Users, 2016 – 2026
        1. 5.4.4.1. Europe Hospital Mobile X-Ray Market, by End-Users, 2016 – 2026 (USD Million)
      5. 5.4.5. Germany
        1. 5.4.5.1. Germany Hospital Mobile X-Ray Market, 2016 – 2026 (USD Million)
      6. 5.4.6. France
        1. 5.4.6.1. France Hospital Mobile X-Ray Market, 2016 – 2026 (USD Million)
      7. 5.4.7. U.K.
        1. 5.4.7.1. U.K. Hospital Mobile X-Ray Market, 2016 – 2026 (USD Million)
      8. 5.4.8. Italy
        1. 5.4.8.1. Italy Hospital Mobile X-Ray Market, 2016 – 2026 (USD Million)
      9. 5.4.9. Spain
        1. 5.4.9.1. Spain Hospital Mobile X-Ray Market, 2016 – 2026 (USD Million)
      10. 5.4.10. Rest of Europe
        1. 5.4.10.1. Rest of Europe Hospital Mobile X-Ray Market, 2016 – 2026 (USD Million)
    5. 5.5. Asia Pacific
      1. 5.5.1. Asia Pacific Hospital Mobile X-Ray Market, 2016 – 2026 (USD Million)
        1. 5.5.1.1. Asia Pacific Hospital Mobile X-Ray Market, by Country, 2016 - 2026 (USD Million)
      2. 5.5.2. Asia Pacific Hospital Mobile X-Ray Market, by Technology, 2016 – 2026
        1. 5.5.2.1. Asia Pacific Hospital Mobile X-Ray Market, by Technology, 2016 – 2026 (USD Million)
      3. 5.5.3. Asia Pacific Hospital Mobile X-Ray Market, by Configuration, 2016 – 2026
        1. 5.5.3.1. Asia Pacific Hospital Mobile X-Ray Market, by Configuration, 2016 – 2026 (USD Million)
      4. 5.5.4. Asia Pacific Hospital Mobile X-Ray Market, by End-Users, 2016 – 2026
        1. 5.5.4.1. Asia Pacific Hospital Mobile X-Ray Market, by End-Users, 2016 – 2026 (USD Million)
      5. 5.5.5. China
        1. 5.5.5.1. China Hospital Mobile X-Ray Market, 2016 – 2026 (USD Million)
      6. 5.5.6. Japan
        1. 5.5.6.1. Japan Hospital Mobile X-Ray Market, 2016 – 2026 (USD Million)
      7. 5.5.7. India
        1. 5.5.7.1. India Hospital Mobile X-Ray Market, 2016 – 2026 (USD Million)
      8. 5.5.8. South Korea
        1. 5.5.8.1. South Korea Hospital Mobile X-Ray Market, 2016 – 2026 (USD Million)
      9. 5.5.9. South-East Asia
        1. 5.5.9.1. South-East Asia Hospital Mobile X-Ray Market, 2016 – 2026 (USD Million)
      10. 5.5.10. Rest of Asia Pacific
        1. 5.5.10.1. Rest of Asia Pacific Hospital Mobile X-Ray Market, 2016 – 2026 (USD Million)
    6. 5.6. Latin America
      1. 5.6.1. Latin America Hospital Mobile X-Ray Market, 2016 – 2026 (USD Million)
        1. 5.6.1.1. Latin America Hospital Mobile X-Ray Market, by Country, 2016 - 2026 (USD Million)
      2. 5.6.2. Latin America Hospital Mobile X-Ray Market, by Technology, 2016 – 2026
        1. 5.6.2.1. Latin America Hospital Mobile X-Ray Market, by Technology, 2016 – 2026 (USD Million)
      3. 5.6.3. Latin America Hospital Mobile X-Ray Market, by Configuration, 2016 – 2026
        1. 5.6.3.1. Latin America Hospital Mobile X-Ray Market, by Configuration, 2016 – 2026 (USD Million)
      4. 5.6.4. Latin America Hospital Mobile X-Ray Market, by End-Users, 2016 – 2026
        1. 5.6.4.1. Latin America Hospital Mobile X-Ray Market, by End-Users, 2016 – 2026 (USD Million)
      5. 5.6.5. Brazil
        1. 5.6.5.1. Brazil Hospital Mobile X-Ray Market, 2016 – 2026 (USD Million)
      6. 5.6.6. Argentina
        1. 5.6.6.1. Argentina Hospital Mobile X-Ray Market, 2016 – 2026 (USD Million)
      7. 5.6.7. Rest of Latin America
        1. 5.6.7.1. Rest of Latin America Hospital Mobile X-Ray Market, 2016 – 2026 (USD Million)
    7. 5.7. The Middle-East and Africa
      1. 5.7.1. The Middle-East and Africa Hospital Mobile X-Ray Market, 2016 – 2026 (USD Million)
        1. 5.7.1.1. The Middle-East and Africa Hospital Mobile X-Ray Market, by Country, 2016 - 2026 (USD Million)
      2. 5.7.2. The Middle-East and Africa Hospital Mobile X-Ray Market, by Technology, 2016 – 2026
        1. 5.7.2.1. The Middle-East and Africa Hospital Mobile X-Ray Market, by Technology, 2016 – 2026 (USD Million)
      3. 5.7.3. The Middle-East and Africa Hospital Mobile X-Ray Market, by Configuration, 2016 – 2026
        1. 5.7.3.1. The Middle-East and Africa Hospital Mobile X-Ray Market, by Configuration, 2016 – 2026 (USD Million)
      4. 5.7.4. The Middle-East and Africa Hospital Mobile X-Ray Market, by End-Users, 2016 – 2026
        1. 5.7.4.1. The Middle-East and Africa Hospital Mobile X-Ray Market, by End-Users, 2016 – 2026 (USD Million)
      5. 5.7.5. GCC Countries
        1. 5.7.5.1. GCC Countries Hospital Mobile X-Ray Market, 2016 – 2026 (USD Million)
      6. 5.7.6. South Africa
        1. 5.7.6.1. South Africa Hospital Mobile X-Ray Market, 2016 – 2026 (USD Million)
      7. 5.7.7. Rest of Middle-East Africa
        1. 5.7.7.1. Rest of Middle-East Africa Hospital Mobile X-Ray Market, 2016 – 2026 (USD Million)
  6. Chapter 6 Hospital Mobile X-Ray Market – Competitive Landscape
    1. 6.1. Competitor Market Share – Revenue
    2. 6.2. Market Concentration Rate Analysis, Top 3 and Top 5 Players
    3. 6.3. Strategic Developments
      1. 6.3.1. Acquisitions and Mergers
      2. 6.3.2. New Products
      3. 6.3.3. Research & Development Activities
  7. Chapter 7 Company Profiles
    1. 7.1. Agfa-Gevaert Group
      1. 7.1.1. Company Overview
      2. 7.1.2. Product/Service Portfolio
      3. 7.1.3. Agfa-Gevaert Group Sales, Revenue, and Gross Margin
      4. 7.1.4. Agfa-Gevaert Group Revenue and Growth Rate
      5. 7.1.5. Agfa-Gevaert Group Market Share
      6. 7.1.6. Recent Initiatives, Funding/VC Activities, and Technological Innovations
    2. 7.2. SEDACAL
      1. 7.2.1. Company Overview
      2. 7.2.2. Product/Service Portfolio
      3. 7.2.3. SEDACAL Sales, Revenue, and Gross Margin
      4. 7.2.4. SEDACAL Revenue and Growth Rate
      5. 7.2.5. SEDACAL Market Share
      6. 7.2.6. Recent Initiatives, Funding/VC Activities, and Technological Innovations
    3. 7.3. IDETEC MEDICAL IMAGING
      1. 7.3.1. Company Overview
      2. 7.3.2. Product/Service Portfolio
      3. 7.3.3. IDETEC MEDICAL IMAGING Sales, Revenue, and Gross Margin
      4. 7.3.4. IDETEC MEDICAL IMAGING Revenue and Growth Rate
      5. 7.3.5. IDETEC MEDICAL IMAGING Market Share
      6. 7.3.6. Recent Initiatives, Funding/VC Activities, and Technological Innovations
    4. 7.4. Koniklijke Philips N.V.
      1. 7.4.1. Company Overview
      2. 7.4.2. Product/Service Portfolio
      3. 7.4.3. Koniklijke Philips N.V. Sales, Revenue, and Gross Margin
      4. 7.4.4. Koniklijke Philips N.V. Revenue and Growth Rate
      5. 7.4.5. Koniklijke Philips N.V. Market Share
      6. 7.4.6. Recent Initiatives, Funding/VC Activities, and Technological Innovations
    5. 7.5. SternMed GmbH
      1. 7.5.1. Company Overview
      2. 7.5.2. Product/Service Portfolio
      3. 7.5.3. SternMed GmbH Sales, Revenue, and Gross Margin
      4. 7.5.4. SternMed GmbH Revenue and Growth Rate
      5. 7.5.5. SternMed GmbH Market Share
      6. 7.5.6. Recent Initiatives, Funding/VC Activities, and Technological Innovations
    6. 7.6. DMS Imaging
      1. 7.6.1. Company Overview
      2. 7.6.2. Product/Service Portfolio
      3. 7.6.3. DMS Imaging Sales, Revenue, and Gross Margin
      4. 7.6.4. DMS Imaging Revenue and Growth Rate
      5. 7.6.5. DMS Imaging Market Share
      6. 7.6.6. Recent Initiatives, Funding/VC Activities, and Technological Innovations
    7. 7.7. Carestream Health Inc.
      1. 7.7.1. Company Overview
      2. 7.7.2. Product/Service Portfolio
      3. 7.7.3. Carestream Health Inc. Sales, Revenue, and Gross Margin
      4. 7.7.4. Carestream Health Inc. Revenue and Growth Rate
      5. 7.7.5. Carestream Health Inc. Market Share
      6. 7.7.6. Recent Initiatives, Funding/VC Activities, and Technological Innovations
    8. 7.8. INTERMEDICAL S.r.l. IMD Group
      1. 7.8.1. Company Overview
      2. 7.8.2. Product/Service Portfolio
      3. 7.8.3. INTERMEDICAL S.r.l. IMD Group Sales, Revenue, and Gross Margin
      4. 7.8.4. INTERMEDICAL S.r.l. IMD Group Revenue and Growth Rate
      5. 7.8.5. INTERMEDICAL S.r.l. IMD Group Market Share
      6. 7.8.6. Recent Initiatives, Funding/VC Activities, and Technological Innovations
    9. 7.9. DELFT IMAGING
      1. 7.9.1. Company Overview
      2. 7.9.2. Product/Service Portfolio
      3. 7.9.3. DELFT IMAGING Sales, Revenue, and Gross Margin
      4. 7.9.4. DELFT IMAGING Revenue and Growth Rate
      5. 7.9.5. DELFT IMAGING Market Share
      6. 7.9.6. Recent Initiatives, Funding/VC Activities, and Technological Innovations
    10. 7.10. OR Technology
      1. 7.10.1. Company Overview
      2. 7.10.2. Product/Service Portfolio
      3. 7.10.3. OR Technology Sales, Revenue, and Gross Margin
      4. 7.10.4. OR Technology Revenue and Growth Rate
      5. 7.10.5. OR Technology Market Share
      6. 7.10.6. Recent Initiatives, Funding/VC Activities, and Technological Innovations
  8. Chapter 8 Hospital Mobile X-Ray — Industry Analysis
    1. 8.1. Introduction and Taxonomy
    2. 8.2. Hospital Mobile X-Ray Market – Key Trends
      1. 8.2.1. Market Drivers
      2. 8.2.2. Market Restraints
      3. 8.2.3. Market Opportunities
    3. 8.3. Value Chain Analysis
    4. 8.4. Key Mandates and Regulations
    5. 8.5. Technology Roadmap and Timeline
    6. 8.6. Hospital Mobile X-Ray Market – Attractiveness Analysis
      1. 8.6.1. By Technology
      2. 8.6.2. By Configuration
      3. 8.6.3. By End-Users
      4. 8.6.4. By Region
  9. Chapter 9 Industrial Chain, Sourcing Strategy, and Downstream Buyers
    1. 9.1. Hospital Mobile X-Ray Industrial Chain Analysis
    2. 9.2. Downstream Buyers
    3. 9.3. Distributors/Traders List
  10. Chapter 10 Marketing Strategy Analysis
    1. 10.1. Marketing Channel
    2. 10.2. Direct Marketing
    3. 10.3. Indirect Marketing
    4. 10.4. Marketing Channel Development Trends
    5. 10.5. Economic/Political Environmental Change
  11. Chapter 11 Report Conclusion & Key Insights
    1. 11.1. Key Insights from Primary Interviews & Surveys Respondents
    2. 11.2. Key Takeaways from Analysts, Consultants, and Industry Leaders
  12. Chapter 12 Research Approach & Methodology
    1. 12.1. Report Description
    2. 12.2. Research Scope
    3. 12.3. Research Methodology
      1. 12.3.1. Secondary Research
      2. 12.3.2. Primary Research
      3. 12.3.3. Statistical Models
        1. 12.3.3.1. Company Share Analysis Model
        2. 12.3.3.2. Revenue Based Modeling
      4. 12.3.4. Research Limitations

      List of Figures

      Fig.1	Product Picture of Hospital Mobile X-Ray
      Fig.2	Global Hospital Mobile X-Ray Market, 2016 – 2026 (USD Million)
      Fig.3	Global Hospital Mobile X-Ray Market Absolute Revenue Opportunity, 2016 – 2026 (USD Million)
      Fig.4	Global Hospital Mobile X-Ray Market Incremental Revenue Opportunity, 2020 – 2026 (USD Million)
      Fig.5	Global Hospital Mobile X-Ray Market Share, by Technology, 2020 & 2026 (USD Million)
      Fig.6	Global Computed Radiography Hospital Mobile X-Ray Market, 2016 – 2026 (USD Million)
      Fig.7	Global Direct Radiography Hospital Mobile X-Ray Market, 2016 – 2026 (USD Million)
      Fig.8	Global Hospital Mobile X-Ray Market Share, by Configuration, 2020 & 2026 (USD Million)
      Fig.9	Global Fixed Arm Hospital Mobile X-Ray Market, 2016 – 2026 (USD Million)
      Fig.10	Global Rotating Arm Hospital Mobile X-Ray Market, 2016 – 2026 (USD Million)
      Fig.11	Global Hospital Mobile X-Ray Market Share, by End-Users, 2020 & 2026 (USD Million)
      Fig.12	Global Operating Theatres Hospital Mobile X-Ray Market, 2016 – 2026 (USD Million)
      Fig.13	Global Emergency Departments Hospital Mobile X-Ray Market, 2016 – 2026 (USD Million)
      Fig.14	Global ICU and Neonatal ICU (Intensive Care Units) Hospital Mobile X-Ray Market, 2016 – 2026 (USD Million)
      Fig.15	Global Central X-ray Departments Hospital Mobile X-Ray Market, 2016 – 2026 (USD Million)
      Fig.16	Global Premature Birth Wards Hospital Mobile X-Ray Market, 2016 – 2026 (USD Million)
      Fig.17	Global Others Hospital Mobile X-Ray Market, 2016 – 2026 (USD Million)
      Fig.18	Global Hospital Mobile X-Ray Market Share, by Region, 2020 & 2026 (USD Million)
      Fig.19	North America Hospital Mobile X-Ray Market, 2016 – 2026 (USD Million)
      Fig.20	U.S. Hospital Mobile X-Ray Market, 2016 – 2026 (USD Million)
      Fig.21	Canada Hospital Mobile X-Ray Market, 2016 – 2026 (USD Million)
      Fig.22	Mexico Hospital Mobile X-Ray Market, 2016 – 2026 (USD Million)
      Fig.23	Europe Hospital Mobile X-Ray Market, 2016 – 2026 (USD Million)
      Fig.24	Germany Hospital Mobile X-Ray Market, 2016 – 2026 (USD Million)
      Fig.25	France Hospital Mobile X-Ray Market, 2016 – 2026 (USD Million)
      Fig.26	U.K. Hospital Mobile X-Ray Market, 2016 – 2026 (USD Million)
      Fig.27	Italy Hospital Mobile X-Ray Market, 2016 – 2026 (USD Million)
      Fig.28	Spain Hospital Mobile X-Ray Market, 2016 – 2026 (USD Million)
      Fig.29	Rest of Europe Hospital Mobile X-Ray Market, 2016 – 2026 (USD Million)
      Fig.30	Asia Pacific Hospital Mobile X-Ray Market, 2016 – 2026 (USD Million)
      Fig.31	China Hospital Mobile X-Ray Market, 2016 – 2026 (USD Million)
      Fig.32	Japan Hospital Mobile X-Ray Market, 2016 – 2026 (USD Million)
      Fig.33	India Hospital Mobile X-Ray Market, 2016 – 2026 (USD Million)
      Fig.34	South  Korea Hospital Mobile X-Ray Market, 2016 – 2026 (USD Million)
      Fig.35	South-East Asia Hospital Mobile X-Ray Market, 2016 – 2026 (USD Million)
      Fig.36	Rest of Asia Pacific Hospital Mobile X-Ray Market, 2016 – 2026 (USD Million)
      Fig.37	Latin America Hospital Mobile X-Ray Market, 2016 – 2026 (USD Million)
      Fig.38	Brazil Hospital Mobile X-Ray Market, 2016 – 2026 (USD Million)
      Fig.39	Argentina Hospital Mobile X-Ray Market, 2016 – 2026 (USD Million)
      Fig.40	Rest of Latin America Hospital Mobile X-Ray Market, 2016 – 2026 (USD Million)
      Fig.41	The Middle-East and Africa Hospital Mobile X-Ray Market, 2016 – 2026 (USD Million)
      Fig.42	GCC Countries Hospital Mobile X-Ray Market, 2016 – 2026 (USD Million)
      Fig.43	South Africa Hospital Mobile X-Ray Market, 2016 – 2026 (USD Million)
      Fig.44	Rest of Middle-East Africa Hospital Mobile X-Ray Market, 2016 – 2026 (USD Million)
      Fig.45	Competitor Market Share – Revenue
      Fig.46	Agfa-Gevaert Group Revenue and Growth Rate
      Fig.47	Agfa-Gevaert Group Market Share
      Fig.48	SEDACAL Revenue and Growth Rate
      Fig.49	SEDACAL Market Share
      Fig.50	IDETEC MEDICAL IMAGING Revenue and Growth Rate
      Fig.51	IDETEC MEDICAL IMAGING Market Share
      Fig.52	Koniklijke Philips N.V. Revenue and Growth Rate
      Fig.53	Koniklijke Philips N.V. Market Share
      Fig.54	SternMed GmbH Revenue and Growth Rate
      Fig.55	SternMed GmbH Market Share
      Fig.56	DMS Imaging Revenue and Growth Rate
      Fig.57	DMS Imaging Market Share
      Fig.58	Carestream Health Inc. Revenue and Growth Rate
      Fig.59	Carestream Health Inc. Market Share
      Fig.60	INTERMEDICAL S.r.l. IMD Group Revenue and Growth Rate
      Fig.61	INTERMEDICAL S.r.l. IMD Group Market Share
      Fig.62	DELFT IMAGING Revenue and Growth Rate
      Fig.63	DELFT IMAGING Market Share
      Fig.64	OR Technology Revenue and Growth Rate
      Fig.65	OR Technology Market Share
      Fig.66	Market Dynamics
      Fig.67	Global Hospital Mobile X-Ray – Value Chain Analysis
      Fig.68	Key Mandates and Regulations
      Fig.69	Technology Roadmap and Timeline
      Fig.70	Market Attractiveness Analysis – By Technology
      Fig.71	Market Attractiveness Analysis – By Configuration
      Fig.72	Market Attractiveness Analysis – By End-Users
      Fig.73	Market Attractiveness Analysis – By Region
      Fig.74	Hospital Mobile X-Ray Industrial Chain Analysis
      Fig.75	Market Channels
      Fig.76	Marketing Channel Development Trend
      Fig.77	Growth in World Gross Product, 2008-2018


      List of Tables

      Table 1	Global Hospital Mobile X-Ray Market, 2020 & 2026 (USD Million)
      Table 2	Global Hospital Mobile X-Ray Market, by Technology, 2016 – 2026 (USD Million)
      Table 3	Global Hospital Mobile X-Ray Market, by Configuration, 2016 – 2026 (USD Million)
      Table 4	Global Hospital Mobile X-Ray Market, by End-Users, 2016 – 2026 (USD Million)
      Table 5	Global Hospital Mobile X-Ray Market, by Region, 2016 – 2026 (USD Million)
      Table 6	North America Hospital Mobile X-Ray Market, by Country, 2016 – 2026 (USD Million)
      Table 7	North America Hospital Mobile X-Ray Market, by Technology, 2016 – 2026 (USD Million)
      Table 8	North America Hospital Mobile X-Ray Market, by Configuration, 2016 – 2026 (USD Million)
      Table 9	North America Hospital Mobile X-Ray Market, by End-Users, 2016 – 2026 (USD Million)
      Table 10 Europe Hospital Mobile X-Ray Market, by Country, 2016 – 2026 (USD Million)
      Table 11 Europe Hospital Mobile X-Ray Market, by Technology, 2016 – 2026 (USD Million)
      Table 12 Europe Hospital Mobile X-Ray Market, by Configuration, 2016 – 2026 (USD Million)
      Table 13 Europe Hospital Mobile X-Ray Market, by End-Users, 2016 – 2026 (USD Million)
      Table 14 Asia Pacific Hospital Mobile X-Ray Market, by Country, 2016 – 2026 (USD Million)
      Table 15 Asia Pacific Hospital Mobile X-Ray Market, by Technology, 2016 – 2026 (USD Million)
      Table 16 Asia Pacific Hospital Mobile X-Ray Market, by Configuration, 2016 – 2026 (USD Million)
      Table 17 Asia Pacific Hospital Mobile X-Ray Market, by End-Users, 2016 – 2026 (USD Million)
      Table 18 Latin America Hospital Mobile X-Ray Market, by Country, 2016 – 2026 (USD Million)
      Table 19 Latin America Hospital Mobile X-Ray Market, by Technology, 2016 – 2026 (USD Million)
      Table 20 Latin America Hospital Mobile X-Ray Market, by Configuration, 2016 – 2026 (USD Million)
      Table 21 Latin America Hospital Mobile X-Ray Market, by End-Users, 2016 – 2026 (USD Million)
      Table 22 The Middle-East and Africa Hospital Mobile X-Ray Market, by Country, 2016 – 2026 (USD Million)
      Table 23 The Middle-East and Africa Hospital Mobile X-Ray Market, by Technology, 2016 – 2026 (USD Million)
      Table 24 The Middle-East and Africa Hospital Mobile X-Ray Market, by Configuration, 2016 – 2026 (USD Million)
      Table 25 The Middle-East and Africa Hospital Mobile X-Ray Market, by End-Users, 2016 – 2026 (USD Million)
      Table 26 Global Hospital Mobile X-Ray Market - Company Revenue Analysis, 2016 – 2020 (USD Million)
      Table 27 Global Hospital Mobile X-Ray Market - Company Revenue Share Analysis, 2016 – 2020 (%)
      Table 28 Acquisitions and Mergers
      Table 29 Market Drivers – Impact Analysis
      Table 30 Market Restraints
      Table 31 Market Opportunities
      Table 32 Major Buyers of Hospital Mobile X-Ray
      Table 33 Distributors/Traders of Hospital Mobile X-Ray by Region
      

Industry Major Market Players

  • Agfa-Gevaert Group
  • SEDACAL
  • IDETEC MEDICAL IMAGING
  • Koniklijke Philips N.V.
  • SternMed GmbH
  • DMS Imaging
  • Carestream Health Inc.
  • INTERMEDICAL S.r.l. IMD Group
  • DELFT IMAGING  
  • OR Technology