Search Market Research Report

Discover Our Latest Reports
Discover Our Featured Reports
Discover Top Selling Reports

High Throughput Process Development Market Size, Share Global Analysis Report, 2020–2026

report img

High Throughput Process Development Market By Product & Services (Consumables, Instruments, Software, and Services), By Molecule Type (Mammalian Cell Culture & Microbial Fermentation, Process Development & Optimization, and Others), By Process Type (Upstream Process, and Downstream Process), By End User (Biopharmaceuticals, Contract Research & Manufacturing Organizations, and Academic & Research Institutes): Global Industry Outlook, Market Size, Business Intelligence, Consumer Preferences, Statistical Surveys, Comprehensive Analysis, Historical Developments, Current Trends, and Forecast 2020–2026

Industry Insights

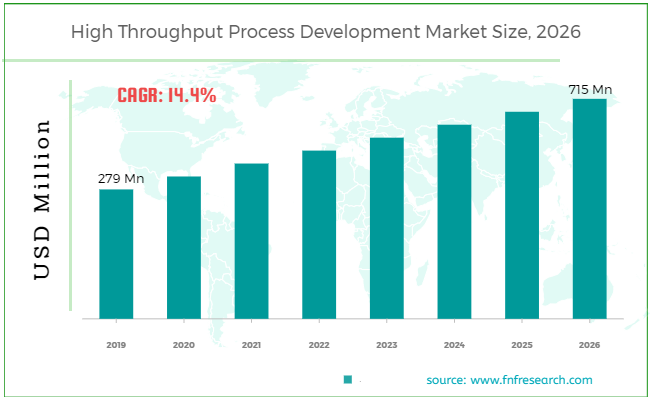
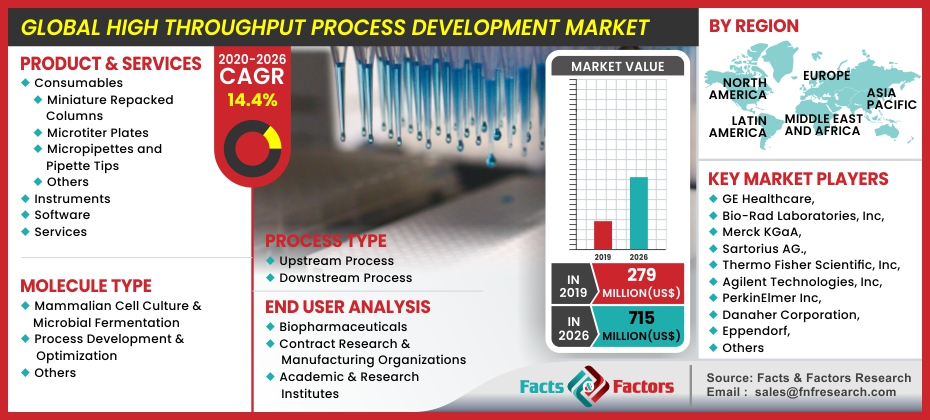
[195+ Pages Report] According to the report published by Facts Factors, the global high throughput process development market size was worth around USD 279 million in 2019 and is predicted to grow to around USD 715 million by 2026 with a compound annual growth rate (CAGR) of roughly 14.4% between 2020 and 2026. The report analyzes the global high throughput process development market drivers, restraints/challenges, and the effect they have on the demands during the projection period. In addition, the report explores emerging opportunities in the high throughput process development market.

High Throughput Process Development Market Size

To know more about this report | Request Free Sample Copy

This specialized and expertise oriented industry research report scrutinizesthe technical and commercial businessoutlook of the high throughput process developmentindustry. The report analyzes and declaresthe historical and current trends analysis of the high throughput process developmentindustry andsubsequently recommends the projected trends anticipated to be observed in the High Throughput Process Development market during the upcoming years.


logoKey Insights from Primary Research

  • The robust developments in emerging countries in the Asia Pacific are supposed to display the highest growth in the regional market over the forecast era.
  • The companies are supposed to invest in R&D to innovate the better product. Innovation will open new opportunities for the high throughput process development thus is expected to propel the industry demand in the upcoming years.
  • The consumables category of the product and service segment holds the highest global market share for the high throughput process development market in 2019
  • The biopharmaceutical companies have accounted for the highest market share in 2019. The contract research & manufacturing organizations segment is expected to grow at a fast pace owing to higher R&D investments by biopharmaceutical and pharmaceutical companies to accelerate drug manufacturing.

logoKey Recommendations from Analysts

  • There is a huge demand for High Throughput Process Development in developing regions such as the Asia Pacific, which is driving the air travel, hotel, and tourism industry in the regions.
  • Asia Pacific region is anticipated to a larger share of the high throughput process development market in the upcoming years.
  • China'shigh throughput process development market is anticipated to rise at the highest rate between 2020 and 2026.
  • Our analysts have identified “consumables”, and “biopharmaceuticals” categories as the leading investment pockets for the Asia Pacific high throughput process development market in terms of the product & services, and end-user segmentation respectively.

logo
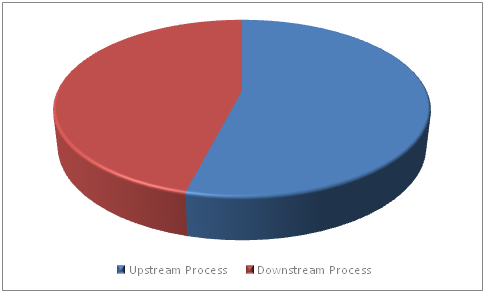
Global High Throughput Process Development Market Revenue Share – By Process Type

High Throughput Process Development Market

To know more about this report | Request Free Sample Copy


The high throughput process development marketreport analyzes and notifies the industry statistics at the global as well as regional and country levels in order to acquireathorough perspective of the entirehigh throughput process development market. The historical and past insights are provided for FY 2016 to FY 2019 whereas projected trends are delivered for FY 2020 to FY 2026. The quantitative and numerical data is represented in terms of value (USD Million) from FY 2016 – 2026.

The quantitative data is further underlined and reinforced by comprehensive qualitative data which comprises various across-the-board market dynamics. The rationales which directly or indirectly impact the high throughput process development industry are exemplifiedthrough parameters such as growth drivers, restraints, challenges, and opportunities among other impacting factors.

Throughout our research report, we have encompassed all the proven models and tools of industry analysis and extensively illustrated all the key business strategies and business models adopted in the high throughput process developmentindustry. The report provides an all-inclusive and detailed competitive landscape prevalent in the high throughput process development market.

The report utilizes established industry analysis tools and models such as Porter’s Five Forces framework to analyze and recognize critical business strategies adopted by various stakeholders involved in the entire value chain of the high throughput process development industry. The high throughput process development marketreport additionally employs SWOT analysis and PESTLE analysis models for further in-depth analysis.

Global High Throughput Process Development Market

To know more about this report | Request Free Sample Copy

The report study further includes an in-depth analysis of industry players' market shares and provides an overview of leading players' market position in the high throughput process development sector. Key strategic developments in the high throughput process development market competitive landscape such as acquisitions & mergers, inaugurations of different products and services, partnerships & joint ventures, MoU agreements, VC & funding activities, R&D activities, and geographic expansion among other noteworthy activities by key players of the high throughput process development market are appropriately highlighted in the report.

The increasing pressure to reduce production costs and the growth of the biopharmaceutical industry is having a major effect on the high performance process development market worldwide. Since the implementation of high throughput processes addresses the issues of reducing development time and developing strong and scalable processes through improving process awareness, its adoption rate has risen significantly worldwide. This demand is also significantly boosted by the utility of high instruments in parallel screening of chromatography problems and media while saving adequate time for system developers.

The high throughput process development marketresearch reportdeliversan acutevaluationand taxonomy of the high throughput process development industry by practicallysplitting the market on the basis of different product & services, molecule type, process type, end user, and regions. Through the analysis of the historical and projected trends, all the segments and sub-segments were evaluated through the bottom-up approach, and different market sizes have been projected for FY 2020 to FY 2026. The regional segmentation of the high throughput process development industry includes the completeclassification of all the major continents including North America, Latin America, Europe, Asia Pacific, and Middle East & Africa. Further, country-wise data for the high throughput process development industry is provided for the leading economies of the world.

The high throughput process development market is segmented based on product & services, molecule type, process type, end user, and region. On the basis of product & servicessegmentation, the market is classified into consumables, instruments, software, and services. In terms of molecule type, the market is categorized into mammalian cell culture & microbial fermentation, process development & optimization, and others. Based on process type, themarket is bifurcatedinto upstream process, and downstream process. In terms of end-user segmentation, the market is bifurcated into biopharmaceuticals, contract research & manufacturing organizations, and academic & research institutes.

logoReport Scope

Report Attribute

Details

Market Size in 2019

USD 279 Million

Projected Market Size in 2026

USD 715 Million

CAGR Growth Rate

14.4% CAGR

Base Year

2021

Forecast Years

2022-2028

Key Market Players

GE Healthcare, Bio-Rad Laboratories, Inc, Merck KGaA, Sartorius AG., Thermo Fisher Scientific, Inc, Agilent Technologies, Inc, PerkinElmer Inc, Danaher Corporation, Eppendorf, and Tecan Trading Ag among others.

Key Segment

By Region

Major Regions Covered

North America, Europe, Asia Pacific, Latin America, and the Middle East & Africa

Purchase Options

Request customized purchase options to meet your research needs. Explore purchase options

logoSome of the leading players in the global market include

  • GE Healthcare
  • Bio-Rad Laboratories Inc
  • Merck KGaA
  • Sartorius AG.
  • Thermo Fisher Scientific,Inc
  • Agilent Technologies, Inc
  • PerkinElmer Inc
  • Danaher Corporation
  • Eppendorf
  • Tecan Trading Ag

The taxonomy of the high throughput process development market by its scope and segmentation is as follows:

logoBy Product & Services Analysis

  • Consumables
    • Miniature Repacked Columns
    • Microtiter Plates
    • Micropipettes and Pipette Tips
    • Others
  • Instruments
  • Software
  • Services

logoBy Molecule Type Analysis

  • Mammalian Cell Culture & Microbial Fermentation
  • Process Development & Optimization
  • Others

logoBy Process Type Analysis

  • Upstream Process
  • Downstream Process

logoBy End User Analysis

  • Biopharmaceuticals
  • Contract Research & Manufacturing Organizations
  • Academic & Research Institutes

logoBy Regional Segmentation Analysis

  • North America
    • The U.S.
    • Canada
  • Europe
    • Germany
    • The UK
    • France
    • Spain
    • Italy
    • Rest of Europe
  • Asia Pacific
    • China
    • Japan
    • India
    • South Korea
    • Southeast Asia
    • Rest of Asia Pacific
  • Latin America
    • Brazil
    • Mexico
    • Rest of Latin America
  • Middle East & Africa
    • GCC
    • South Africa
    • Rest of Middle East & Africa

Table of Content

  1. Chapter 1 Executive Summary
    1. 1.1. Introduction of High Throughput Process Development
    2. 1.2. Global High Throughput Process Development Market, 2019 & 2026 (USD Million)
    3. 1.3. Global High Throughput Process Development Market, 2016 – 2026 (USD Million)
    4. 1.4. Global High Throughput Process Development Market Absolute Revenue Opportunity, 2016 – 2026 (USD Million)
    5. 1.5. Global High Throughput Process Development Market Incremental Revenue Opportunity, 2020 – 2026 (USD Million)
  2. Chapter 2 High Throughput Process Development Market – Product & Services Analysis
    1. 2.1. Global High Throughput Process Development Market – Product & Services Overview
    2. 2.2. Global High Throughput Process Development Market Share, by Product & Services, 2019 & 2026 (USD Million)
    3. 2.3. Consumables
      1. 2.3.1. Global Consumables High Throughput Process Development Market, 2016 – 2026 (USD Million)
    4. 2.4. Instruments
      1. 2.4.1. Global Instruments High Throughput Process Development Market, 2016 – 2026 (USD Million)
    5. 2.5. Software
      1. 2.5.1. Global Software High Throughput Process Development Market, 2016 – 2026 (USD Million)
    6. 2.6. Services
      1. 2.6.1. Global Services High Throughput Process Development Market, 2016 – 2026 (USD Million)
  3. Chapter 3 High Throughput Process Development Market – Molecule Type Analysis
    1. 3.1. Global High Throughput Process Development Market – Molecule Type Overview
    2. 3.2. Global High Throughput Process Development Market Share, by Molecule Type, 2019 & 2026 (USD Million)
    3. 3.3. Mammalian Cell Culture & Microbial Fermentation
      1. 3.3.1. Global Mammalian Cell Culture & Microbial Fermentation High Throughput Process Development Market, 2016 – 2026 (USD Million)
    4. 3.4. Process Development & Optimization
      1. 3.4.1. Global Process Development & Optimization High Throughput Process Development Market, 2016 – 2026 (USD Million)
    5. 3.5. Others
      1. 3.5.1. Global Others High Throughput Process Development Market, 2016 – 2026 (USD Million)
  4. Chapter 4 High Throughput Process Development Market – Process Type Analysis
    1. 4.1. Global High Throughput Process Development Market – Process Type Overview
    2. 4.2. Global High Throughput Process Development Market Share, by Process Type, 2019 & 2026 (USD Million)
    3. 4.3. Upstream Process
      1. 4.3.1. Global Upstream Process High Throughput Process Development Market, 2016 – 2026 (USD Million)
    4. 4.4. Downstream Process
      1. 4.4.1. Global Downstream Process High Throughput Process Development Market, 2016 – 2026 (USD Million)
  5. Chapter 5 High Throughput Process Development Market – End User Analysis
    1. 5.1. Global High Throughput Process Development Market – End User Overview
    2. 5.2. Global High Throughput Process Development Market Share, by End User, 2019 & 2026 (USD Million)
    3. 5.3. Biopharmaceuticals
      1. 5.3.1. Global Biopharmaceuticals High Throughput Process Development Market, 2016 – 2026 (USD Million)
    4. 5.4. Contract Research & Manufacturing Organizations
      1. 5.4.1. Global Contract Research & Manufacturing Organizations High Throughput Process Development Market, 2016 – 2026 (USD Million)
    5. 5.5. Academic & Research Institutes
      1. 5.5.1. Global Academic & Research Institutes High Throughput Process Development Market, 2016 – 2026 (USD Million)
  6. Chapter 6 High Throughput Process Development Market – Regional Analysis
    1. 6.1. Global High Throughput Process Development Market Regional Overview
    2. 6.2. Global High Throughput Process Development Market Share, by Region, 2019 & 2026 (USD Million)
    3. 6.3. North America
      1. 6.3.1. North America High Throughput Process Development Market, 2016 – 2026 (USD Million)
        1. 6.3.1.1. North America High Throughput Process Development Market, by Country, 2016 - 2026 (USD Million)
      2. 6.3.2. North America High Throughput Process Development Market, by Product & Services, 2016 – 2026
        1. 6.3.2.1. North America High Throughput Process Development Market, by Product & Services, 2016 – 2026 (USD Million)
      3. 6.3.3. North America High Throughput Process Development Market, by Molecule Type, 2016 – 2026
        1. 6.3.3.1. North America High Throughput Process Development Market, by Molecule Type, 2016 – 2026 (USD Million)
      4. 6.3.4. North America High Throughput Process Development Market, by Process Type, 2016 – 2026
        1. 6.3.4.1. North America High Throughput Process Development Market, by Process Type, 2016 – 2026 (USD Million)
      5. 6.3.5. North America High Throughput Process Development Market, by End User, 2016 – 2026
        1. 6.3.5.1. North America High Throughput Process Development Market, by End User, 2016 – 2026 (USD Million)
      6. 6.3.6. U.S.
        1. 6.3.6.1. U.S. High Throughput Process Development Market, 2016 – 2026 (USD Million)
      7. 6.3.7. Canada
        1. 6.3.7.1. Canada High Throughput Process Development Market, 2016 – 2026 (USD Million)
    4. 6.4. Europe
      1. 6.4.1. Europe High Throughput Process Development Market, 2016 – 2026 (USD Million)
        1. 6.4.1.1. Europe High Throughput Process Development Market, by Country, 2016 - 2026 (USD Million)
      2. 6.4.2. Europe High Throughput Process Development Market, by Product & Services, 2016 – 2026
        1. 6.4.2.1. Europe High Throughput Process Development Market, by Product & Services, 2016 – 2026 (USD Million)
      3. 6.4.3. Europe High Throughput Process Development Market, by Molecule Type, 2016 – 2026
        1. 6.4.3.1. Europe High Throughput Process Development Market, by Molecule Type, 2016 – 2026 (USD Million)
      4. 6.4.4. Europe High Throughput Process Development Market, by Process Type, 2016 – 2026
        1. 6.4.4.1. Europe High Throughput Process Development Market, by Process Type, 2016 – 2026 (USD Million)
      5. 6.4.5. Europe High Throughput Process Development Market, by End User, 2016 – 2026
        1. 6.4.5.1. Europe High Throughput Process Development Market, by End User, 2016 – 2026 (USD Million)
      6. 6.4.6. Germany
        1. 6.4.6.1. Germany High Throughput Process Development Market, 2016 – 2026 (USD Million)
      7. 6.4.7. France
        1. 6.4.7.1. France High Throughput Process Development Market, 2016 – 2026 (USD Million)
      8. 6.4.8. U.K.
        1. 6.4.8.1. U.K. High Throughput Process Development Market, 2016 – 2026 (USD Million)
      9. 6.4.9. Italy
        1. 6.4.9.1. Italy High Throughput Process Development Market, 2016 – 2026 (USD Million)
      10. 6.4.10. Spain
        1. 6.4.10.1. Spain High Throughput Process Development Market, 2016 – 2026 (USD Million)
      11. 6.4.11. Rest of Europe
        1. 6.4.11.1. Rest of Europe High Throughput Process Development Market, 2016 – 2026 (USD Million)
    5. 6.5. Asia Pacific
      1. 6.5.1. Asia Pacific High Throughput Process Development Market, 2016 – 2026 (USD Million)
        1. 6.5.1.1. Asia Pacific High Throughput Process Development Market, by Country, 2016 - 2026 (USD Million)
      2. 6.5.2. Asia Pacific High Throughput Process Development Market, by Product & Services, 2016 – 2026
        1. 6.5.2.1. Asia Pacific High Throughput Process Development Market, by Product & Services, 2016 – 2026 (USD Million)
      3. 6.5.3. Asia Pacific High Throughput Process Development Market, by Molecule Type, 2016 – 2026
        1. 6.5.3.1. Asia Pacific High Throughput Process Development Market, by Molecule Type, 2016 – 2026 (USD Million)
      4. 6.5.4. Asia Pacific High Throughput Process Development Market, by Process Type, 2016 – 2026
        1. 6.5.4.1. Asia Pacific High Throughput Process Development Market, by Process Type, 2016 – 2026 (USD Million)
      5. 6.5.5. Asia Pacific High Throughput Process Development Market, by End User, 2016 – 2026
        1. 6.5.5.1. Asia Pacific High Throughput Process Development Market, by End User, 2016 – 2026 (USD Million)
      6. 6.5.6. China
        1. 6.5.6.1. China High Throughput Process Development Market, 2016 – 2026 (USD Million)
      7. 6.5.7. Japan
        1. 6.5.7.1. Japan High Throughput Process Development Market, 2016 – 2026 (USD Million)
      8. 6.5.8. India
        1. 6.5.8.1. India High Throughput Process Development Market, 2016 – 2026 (USD Million)
      9. 6.5.9. South Korea
        1. 6.5.9.1. South Korea High Throughput Process Development Market, 2016 – 2026 (USD Million)
      10. 6.5.10. South-East Asia
        1. 6.5.10.1. South-East Asia High Throughput Process Development Market, 2016 – 2026 (USD Million)
      11. 6.5.11. Rest of Asia Pacific
        1. 6.5.11.1. Rest of Asia Pacific High Throughput Process Development Market, 2016 – 2026 (USD Million)
    6. 6.6. Latin America
      1. 6.6.1. Latin America High Throughput Process Development Market, 2016 – 2026 (USD Million)
        1. 6.6.1.1. Latin America High Throughput Process Development Market, by Country, 2016 - 2026 (USD Million)
      2. 6.6.2. Latin America High Throughput Process Development Market, by Product & Services, 2016 – 2026
        1. 6.6.2.1. Latin America High Throughput Process Development Market, by Product & Services, 2016 – 2026 (USD Million)
      3. 6.6.3. Latin America High Throughput Process Development Market, by Molecule Type, 2016 – 2026
        1. 6.6.3.1. Latin America High Throughput Process Development Market, by Molecule Type, 2016 – 2026 (USD Million)
      4. 6.6.4. Latin America High Throughput Process Development Market, by Process Type, 2016 – 2026
        1. 6.6.4.1. Latin America High Throughput Process Development Market, by Process Type, 2016 – 2026 (USD Million)
      5. 6.6.5. Latin America High Throughput Process Development Market, by End User, 2016 – 2026
        1. 6.6.5.1. Latin America High Throughput Process Development Market, by End User, 2016 – 2026 (USD Million)
      6. 6.6.6. Brazil
        1. 6.6.6.1. Brazil High Throughput Process Development Market, 2016 – 2026 (USD Million)
      7. 6.6.7. Mexico
        1. 6.6.7.1. Mexico High Throughput Process Development Market, 2016 – 2026 (USD Million)
      8. 6.6.8. Rest of Latin America
        1. 6.6.8.1. Rest of Latin America High Throughput Process Development Market, 2016 – 2026 (USD Million)
    7. 6.7. The Middle-East and Africa
      1. 6.7.1. The Middle-East and Africa High Throughput Process Development Market, 2016 – 2026 (USD Million)
        1. 6.7.1.1. The Middle-East and Africa High Throughput Process Development Market, by Country, 2016 - 2026 (USD Million)
      2. 6.7.2. The Middle-East and Africa High Throughput Process Development Market, by Product & Services, 2016 – 2026
        1. 6.7.2.1. The Middle-East and Africa High Throughput Process Development Market, by Product & Services, 2016 – 2026 (USD Million)
      3. 6.7.3. The Middle-East and Africa High Throughput Process Development Market, by Molecule Type, 2016 – 2026
        1. 6.7.3.1. The Middle-East and Africa High Throughput Process Development Market, by Molecule Type, 2016 – 2026 (USD Million)
      4. 6.7.4. The Middle-East and Africa High Throughput Process Development Market, by Process Type, 2016 – 2026
        1. 6.7.4.1. The Middle-East and Africa High Throughput Process Development Market, by Process Type, 2016 – 2026 (USD Million)
      5. 6.7.5. The Middle-East and Africa High Throughput Process Development Market, by End User, 2016 – 2026
        1. 6.7.5.1. The Middle-East and Africa High Throughput Process Development Market, by End User, 2016 – 2026 (USD Million)
      6. 6.7.6. GCC Countries
        1. 6.7.6.1. GCC Countries High Throughput Process Development Market, 2016 – 2026 (USD Million)
      7. 6.7.7. South Africa
        1. 6.7.7.1. South Africa High Throughput Process Development Market, 2016 – 2026 (USD Million)
      8. 6.7.8. Rest of Middle-East Africa
        1. 6.7.8.1. Rest of Middle-East Africa High Throughput Process Development Market, 2016 – 2026 (USD Million)
  7. Chapter 7 High Throughput Process Development Market – Competitive Landscape
    1. 7.1. Competitor Market Share – Revenue
    2. 7.2. Market Concentration Rate Analysis, Top 3 and Top 5 Players
    3. 7.3. Strategic Developments
      1. 7.3.1. Acquisitions and Mergers
      2. 7.3.2. New Products
      3. 7.3.3. Research & Development Activities
  8. Chapter 8 Company Profiles
    1. 8.1. GE Healthcare
      1. 8.1.1. Company Overview
      2. 8.1.2. Product/Service Portfolio
      3. 8.1.3. GE Healthcare Sales, Revenue, and Gross Margin
      4. 8.1.4. GE Healthcare Revenue and Growth Rate
      5. 8.1.5. GE Healthcare Market Share
      6. 8.1.6. Recent Initiatives, Funding/VC Activities, and Technological Innovations
    2. 8.2. Bio-Rad Laboratories, Inc
      1. 8.2.1. Company Overview
      2. 8.2.2. Product/Service Portfolio
      3. 8.2.3. Bio-Rad Laboratories, Inc Sales, Revenue, and Gross Margin
      4. 8.2.4. Bio-Rad Laboratories, Inc Revenue and Growth Rate
      5. 8.2.5. Bio-Rad Laboratories, Inc Market Share
      6. 8.2.6. Recent Initiatives, Funding/VC Activities, and Technological Innovations
    3. 8.3. Merck KGaA
      1. 8.3.1. Company Overview
      2. 8.3.2. Product/Service Portfolio
      3. 8.3.3. Merck KGaA Sales, Revenue, and Gross Margin
      4. 8.3.4. Merck KGaA Revenue and Growth Rate
      5. 8.3.5. Merck KGaA Market Share
      6. 8.3.6. Recent Initiatives, Funding/VC Activities, and Technological Innovations
    4. 8.4. Sartorius AG.
      1. 8.4.1. Company Overview
      2. 8.4.2. Product/Service Portfolio
      3. 8.4.3. Sartorius AG. Sales, Revenue, and Gross Margin
      4. 8.4.4. Sartorius AG. Revenue and Growth Rate
      5. 8.4.5. Sartorius AG. Market Share
      6. 8.4.6. Recent Initiatives, Funding/VC Activities, and Technological Innovations
    5. 8.5. Thermo Fisher Scientific, Inc
      1. 8.5.1. Company Overview
      2. 8.5.2. Product/Service Portfolio
      3. 8.5.3. Thermo Fisher Scientific, Inc Sales, Revenue, and Gross Margin
      4. 8.5.4. Thermo Fisher Scientific, Inc Revenue and Growth Rate
      5. 8.5.5. Thermo Fisher Scientific, Inc Market Share
      6. 8.5.6. Recent Initiatives, Funding/VC Activities, and Technological Innovations
    6. 8.6. Agilent Technologies, Inc
      1. 8.6.1. Company Overview
      2. 8.6.2. Product/Service Portfolio
      3. 8.6.3. Agilent Technologies, Inc Sales, Revenue, and Gross Margin
      4. 8.6.4. Agilent Technologies, Inc Revenue and Growth Rate
      5. 8.6.5. Agilent Technologies, Inc Market Share
      6. 8.6.6. Recent Initiatives, Funding/VC Activities, and Technological Innovations
    7. 8.7. PerkinElmer Inc
      1. 8.7.1. Company Overview
      2. 8.7.2. Product/Service Portfolio
      3. 8.7.3. PerkinElmer Inc Sales, Revenue, and Gross Margin
      4. 8.7.4. PerkinElmer Inc Revenue and Growth Rate
      5. 8.7.5. PerkinElmer Inc Market Share
      6. 8.7.6. Recent Initiatives, Funding/VC Activities, and Technological Innovations
    8. 8.8. Danaher Corporation
      1. 8.8.1. Company Overview
      2. 8.8.2. Product/Service Portfolio
      3. 8.8.3. Danaher Corporation Sales, Revenue, and Gross Margin
      4. 8.8.4. Danaher Corporation Revenue and Growth Rate
      5. 8.8.5. Danaher Corporation Market Share
      6. 8.8.6. Recent Initiatives, Funding/VC Activities, and Technological Innovations
    9. 8.9. Eppendorf
      1. 8.9.1. Company Overview
      2. 8.9.2. Product/Service Portfolio
      3. 8.9.3. Eppendorf Sales, Revenue, and Gross Margin
      4. 8.9.4. Eppendorf Revenue and Growth Rate
      5. 8.9.5. Eppendorf Market Share
      6. 8.9.6. Recent Initiatives, Funding/VC Activities, and Technological Innovations
    10. 8.10. Tecan Trading Ag
      1. 8.10.1. Company Overview
      2. 8.10.2. Product/Service Portfolio
      3. 8.10.3. Tecan Trading Ag Sales, Revenue, and Gross Margin
      4. 8.10.4. Tecan Trading Ag Revenue and Growth Rate
      5. 8.10.5. Tecan Trading Ag Market Share
      6. 8.10.6. Recent Initiatives, Funding/VC Activities, and Technological Innovations
  9. Chapter 9 High Throughput Process Development — Industry Analysis
    1. 9.1. Introduction and Taxonomy
    2. 9.2. High Throughput Process Development Market – Key Trends
      1. 9.2.1. Market Drivers
      2. 9.2.2. Market Restraints
      3. 9.2.3. Market Opportunities
    3. 9.3. Value Chain Analysis
    4. 9.4. Key Mandates and Regulations
    5. 9.5. Technology Roadmap and Timeline
    6. 9.6. High Throughput Process Development Market – Attractiveness Analysis
      1. 9.6.1. By Product & Services
      2. 9.6.2. By Molecule Type
      3. 9.6.3. By Process Type
      4. 9.6.4. By End User
      5. 9.6.5. By Region
  10. Chapter 10 Industrial Chain, Sourcing Strategy, and Downstream Buyers
    1. 10.1. High Throughput Process Development Industrial Chain Analysis
    2. 10.2. Downstream Buyers
    3. 10.3. Distributors/Traders List
  11. Chapter 11 Marketing Strategy Analysis
    1. 11.1. Marketing Channel
    2. 11.2. Direct Marketing
    3. 11.3. Indirect Marketing
    4. 11.4. Marketing Channel Development Trends
    5. 11.5. Economic/Political Environmental Change
  12. Chapter 12 Report Conclusion & Key Insights
    1. 12.1. Key Insights from Primary Interviews & Surveys Respondents
    2. 12.2. Key Takeaways from Analysts, Consultants, and Industry Leaders
  13. Chapter 13 Research Approach & Methodology
    1. 13.1. Report Description
    2. 13.2. Research Scope
    3. 13.3. Research Methodology
      1. 13.3.1. Secondary Research
      2. 13.3.2. Primary Research
      3. 13.3.3. Statistical Models
        1. 13.3.3.1. Company Share Analysis Model
        2. 13.3.3.2. Revenue Based Modeling
      4. 13.3.4. Research Limitations

      List of Figures

      Fig.1 Product Picture of High Throughput Process Development
      Fig.2 Global High Throughput Process Development Market, 2016 – 2026 (USD Million)
      Fig.3 Global High Throughput Process Development Market Absolute Revenue Opportunity, 2016 – 2026 (USD Million)
      Fig.4 Global High Throughput Process Development Market Incremental Revenue Opportunity, 2020 – 2026 (USD Million)
      Fig.5 Global High Throughput Process Development Market Share, by Product & Services, 2019 & 2026 (USD Million)
      Fig.6 Global Consumables High Throughput Process Development Market, 2016 – 2026 (USD Million)
      Fig.7 Global Instruments High Throughput Process Development Market, 2016 – 2026 (USD Million)
      Fig.8 Global Software High Throughput Process Development Market, 2016 – 2026 (USD Million)
      Fig.9 Global Services High Throughput Process Development Market, 2016 – 2026 (USD Million)
      Fig.10 Global High Throughput Process Development Market Share, by Molecule Type, 2019 & 2026 (USD Million)
      Fig.11 Global Mammalian Cell Culture & Microbial Fermentation High Throughput Process Development Market, 2016 – 2026 (USD Million)
      Fig.12 Global Process Development & Optimization High Throughput Process Development Market, 2016 – 2026 (USD Million)
      Fig.13 Global Others High Throughput Process Development Market, 2016 – 2026 (USD Million)
      Fig.14 Global High Throughput Process Development Market Share, by Process Type, 2019 & 2026 (USD Million)
      Fig.15 Global Upstream Process High Throughput Process Development Market, 2016 – 2026 (USD Million)
      Fig.16 Global Downstream Process High Throughput Process Development Market, 2016 – 2026 (USD Million)
      Fig.17 Global High Throughput Process Development Market Share, by End User, 2019 & 2026 (USD Million)
      Fig.18 Global Biopharmaceuticals High Throughput Process Development Market, 2016 – 2026 (USD Million)
      Fig.19 Global Contract Research & Manufacturing Organizations High Throughput Process Development Market, 2016 – 2026 (USD Million)
      Fig.20 Global Academic & Research Institutes High Throughput Process Development Market, 2016 – 2026 (USD Million)
      Fig.21 Global High Throughput Process Development Market Share, by Region, 2019 & 2026 (USD Million)
      Fig.22 North America High Throughput Process Development Market, 2016 – 2026 (USD Million)
      Fig.23 U.S. High Throughput Process Development Market, 2016 – 2026 (USD Million)
      Fig.24 Canada High Throughput Process Development Market, 2016 – 2026 (USD Million)
      Fig.25 Europe High Throughput Process Development Market, 2016 – 2026 (USD Million)
      Fig.26 Germany High Throughput Process Development Market, 2016 – 2026 (USD Million)
      Fig.27 France High Throughput Process Development Market, 2016 – 2026 (USD Million)
      Fig.28 U.K. High Throughput Process Development Market, 2016 – 2026 (USD Million)
      Fig.29 Italy High Throughput Process Development Market, 2016 – 2026 (USD Million)
      Fig.30 Spain High Throughput Process Development Market, 2016 – 2026 (USD Million)
      Fig.31 Rest of Europe High Throughput Process Development Market, 2016 – 2026 (USD Million)
      Fig.32 Asia Pacific High Throughput Process Development Market, 2016 – 2026 (USD Million)
      Fig.33 China High Throughput Process Development Market, 2016 – 2026 (USD Million)
      Fig.34 Japan High Throughput Process Development Market, 2016 – 2026 (USD Million)
      Fig.35 India High Throughput Process Development Market, 2016 – 2026 (USD Million)
      Fig.36 South  Korea High Throughput Process Development Market, 2016 – 2026 (USD Million)
      Fig.37 South-East Asia High Throughput Process Development Market, 2016 – 2026 (USD Million)
      Fig.38 Rest of Asia Pacific High Throughput Process Development Market, 2016 – 2026 (USD Million)
      Fig.39 Latin America High Throughput Process Development Market, 2016 – 2026 (USD Million)
      Fig.40 Brazil High Throughput Process Development Market, 2016 – 2026 (USD Million)
      Fig.41 Mexico High Throughput Process Development Market, 2016 – 2026 (USD Million)
      Fig.42 Rest of Latin America High Throughput Process Development Market, 2016 – 2026 (USD Million)
      Fig.43 The Middle-East and Africa High Throughput Process Development Market, 2016 – 2026 (USD Million)
      Fig.44 GCC Countries High Throughput Process Development Market, 2016 – 2026 (USD Million)
      Fig.45 South Africa High Throughput Process Development Market, 2016 – 2026 (USD Million)
      Fig.46 Rest of Middle-East Africa High Throughput Process Development Market, 2016 – 2026 (USD Million)
      Fig.47 Competitor Market Share – Revenue
      Fig.48 GE Healthcare Revenue and Growth Rate
      Fig.49 GE Healthcare Market Share
      Fig.50 Bio-Rad Laboratories, Inc Revenue and Growth Rate
      Fig.51 Bio-Rad Laboratories, Inc Market Share
      Fig.52 Merck KGaA Revenue and Growth Rate
      Fig.53 Merck KGaA Market Share
      Fig.54 Sartorius AG. Revenue and Growth Rate
      Fig.55 Sartorius AG. Market Share
      Fig.56 Thermo Fisher Scientific, Inc Revenue and Growth Rate
      Fig.57 Thermo Fisher Scientific, Inc Market Share
      Fig.58 Agilent Technologies, Inc Revenue and Growth Rate
      Fig.59 Agilent Technologies, Inc Market Share
      Fig.60 PerkinElmer Inc Revenue and Growth Rate
      Fig.61 PerkinElmer Inc Market Share
      Fig.62 Danaher Corporation Revenue and Growth Rate
      Fig.63 Danaher Corporation Market Share
      Fig.64 Eppendorf Revenue and Growth Rate
      Fig.65 Eppendorf Market Share
      Fig.66 Tecan Trading Ag Revenue and Growth Rate
      Fig.67 Tecan Trading Ag Market Share
      Fig.68 Market Dynamics
      Fig.69 Global High Throughput Process Development – Value Chain Analysis
      Fig.70 Key Mandates and Regulations
      Fig.71 Technology Roadmap and Timeline
      Fig.72 Market Attractiveness Analysis – By Product & Services
      Fig.73 Market Attractiveness Analysis – By Molecule Type
      Fig.74 Market Attractiveness Analysis – By Process Type
      Fig.75 Market Attractiveness Analysis – By End User
      Fig.76 Market Attractiveness Analysis – By Region
      Fig.77 High Throughput Process Development Industrial Chain Analysis
      Fig.78 Market Channels
      Fig.79 Marketing Channel Development Trend
      Fig.80 Growth in World Gross Product, 2008-2018
      

      List of Tables

      Table 1 Global High Throughput Process Development Market, 2019 & 2026 (USD Million)
      Table 2 Global High Throughput Process Development Market, by Product & Services, 2016 – 2026 (USD Million)
      Table 3 Global High Throughput Process Development Market, by Molecule Type, 2016 – 2026 (USD Million)
      Table 4 Global High Throughput Process Development Market, by Process Type, 2016 – 2026 (USD Million)
      Table 5 Global High Throughput Process Development Market, by End User, 2016 – 2026 (USD Million)
      Table 6 Global High Throughput Process Development Market, by Region, 2016 – 2026 (USD Million)
      Table 7 North America High Throughput Process Development Market, by Country, 2016 – 2026 (USD Million)
      Table 8 North America High Throughput Process Development Market, by Product & Services, 2016 – 2026 (USD Million)
      Table 9 North America High Throughput Process Development Market, by Molecule Type, 2016 – 2026 (USD Million)
      Table 10 North America High Throughput Process Development Market, by Process Type, 2016 – 2026 (USD Million)
      Table 11 North America High Throughput Process Development Market, by End User, 2016 – 2026 (USD Million)
      Table 12 Europe High Throughput Process Development Market, by Country, 2016 – 2026 (USD Million)
      Table 13 Europe High Throughput Process Development Market, by Product & Services, 2016 – 2026 (USD Million)
      Table 14 Europe High Throughput Process Development Market, by Molecule Type, 2016 – 2026 (USD Million)
      Table 15 Europe High Throughput Process Development Market, by Process Type, 2016 – 2026 (USD Million)
      Table 16 Europe High Throughput Process Development Market, by End User, 2016 – 2026 (USD Million)
      Table 17 Asia Pacific High Throughput Process Development Market, by Country, 2016 – 2026 (USD Million)
      Table 18 Asia Pacific High Throughput Process Development Market, by Product & Services, 2016 – 2026 (USD Million)
      Table 19 Asia Pacific High Throughput Process Development Market, by Molecule Type, 2016 – 2026 (USD Million)
      Table 20 Asia Pacific High Throughput Process Development Market, by Process Type, 2016 – 2026 (USD Million)
      Table 21 Asia Pacific High Throughput Process Development Market, by End User, 2016 – 2026 (USD Million)
      Table 22 Latin America High Throughput Process Development Market, by Country, 2016 – 2026 (USD Million)
      Table 23 Latin America High Throughput Process Development Market, by Product & Services, 2016 – 2026 (USD Million)
      Table 24 Latin America High Throughput Process Development Market, by Molecule Type, 2016 – 2026 (USD Million)
      Table 25 Latin America High Throughput Process Development Market, by Process Type, 2016 – 2026 (USD Million)
      Table 26 Latin America High Throughput Process Development Market, by End User, 2016 – 2026 (USD Million)
      Table 27 The Middle-East and Africa High Throughput Process Development Market, by Country, 2016 – 2026 (USD Million)
      Table 28 The Middle-East and Africa High Throughput Process Development Market, by Product & Services, 2016 – 2026 (USD Million)
      Table 29 The Middle-East and Africa High Throughput Process Development Market, by Molecule Type, 2016 – 2026 (USD Million)
      Table 30 The Middle-East and Africa High Throughput Process Development Market, by Process Type, 2016 – 2026 (USD Million)
      Table 31 The Middle-East and Africa High Throughput Process Development Market, by End User, 2016 – 2026 (USD Million)
      Table 32 Global High Throughput Process Development Market - Company Revenue Analysis, 2016 – 2019 (USD Million)
      Table 33 Global High Throughput Process Development Market - Company Revenue Share Analysis, 2016 – 2019 (%)
      Table 34 Acquisitions and Mergers
      Table 35 Market Drivers – Impact Analysis
      Table 36 Market Restraints
      Table 37 Market Opportunities
      Table 38 Major Buyers of High Throughput Process Development
      Table 39 Distributors/Traders of High Throughput Process Development by Region
      

Industry Major Market Players

  • GE Healthcare
  • Bio-Rad Laboratories Inc
  • Merck KGaA
  • Sartorius AG.
  • Thermo Fisher Scientific,Inc
  • Agilent Technologies, Inc
  • PerkinElmer Inc
  • Danaher Corporation
  • Eppendorf
  • Tecan Trading Ag