Search Market Research Report

Discover Our Latest Reports
Discover Our Featured Reports
Discover Top Selling Reports

High Purity Tin Market Size, Share Global Analysis Report, 2020–2026

report img

High Purity Tin Market By Type (5N Tin, 6N Tin, and 7N Tin) and By Application (Superconducting Material, Tin Alloy, Solder, Pyroelectric Materials, and Others): Global Industry Outlook, Market Size, Business Intelligence, Consumer Preferences, Statistical Surveys, Comprehensive Analysis, Historical Developments, Current Trends, and Forecast 2020–2026

Industry Insights

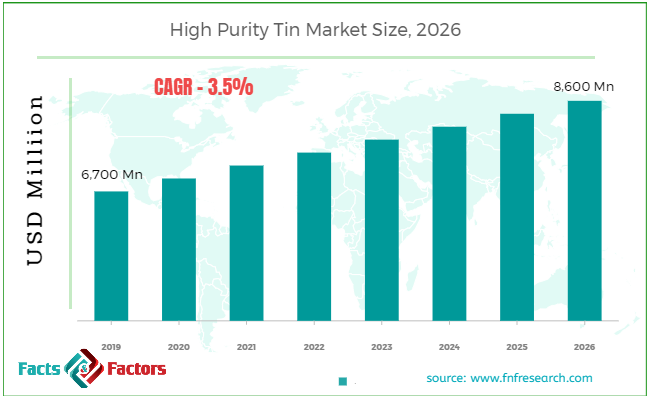
[191+ Pages Report] According to the report published by Facts Factors, the global high purity tin market size was worth around USD 6,700 million in 2019 and is predicted to grow to around USD 8,600 million  by 2026 with a compound annual growth rate (CAGR) of roughly 3.5% between 2020 and 2026. The report analyzes the global high purity tin market drivers, restraints/challenges, and the effect they have on the demands during the projection period. In addition, the report explores emerging opportunities in the high purity tin market.

High Purity Tin Market Size

To know more about this report | Request Free Sample Copy

The high purity tin market report analyzes and notifies the industry statistics at the global as well as regional and country levels in order to acquire a thorough perspective of the entire high purity tin market. The historical and past insights are provided for FY 2016 to FY 2019 whereas projected trends are delivered for FY 2020 to FY 2026. The quantitative and numerical data is represented in value (USD Billion) and volume (Kilo Tons) from FY 2016 – 2026.

This specialized and expertise-oriented industry research report scrutinizes the technical and commercial business outlook of the high purity tin industry. The report analyzes and declares the historical and current trends analysis of the high purity tin industry and subsequently recommends the projected trends anticipated to be observed in the high purity tin market during the upcoming years.


logoKey Insights from Primary Research

  • As per our primary respondents, the global high pure tin market is expected to reach a market value of nearly USD 8,600 million by 2026 while registering an average growth of approximately 3.5% between 2020 and 2026
  • Our primary respondents estimated that the global high pure tin market is expected to be led by the Asia Pacific region due to rising consumer electronics and the automotive market.
  • On the basis of type, the 5N tin segment held a major share in the global high pure tin market. The 5N tin segment accounted for a market share of approximately 65% in 2019.
  • In terms of volume, the Poland high pure tin market has reached a value of nearly 3.50 kilo Tons in 2019 and is estimated to reach a volume of 4 kilo tons in 2026. 
  • According to industry experts, Asia Pacific held a major share in the global market, accounting for a market share of nearly 66% in 2019. China has significantly contributed to the growth of the Asia Pacific high pure tin market.

logoKey Recommendations from Analysts

  • Accoring to our analysts, the high demand for consumer appliances, mobile, tablets, laptops, etc. in emerging markets has bolstered the demand for high pure tin in the semicondusctor sector.
  • The global high pure tin market was valued at approximately USD 6,700 million in 2019. The growing demand for tin for soldering applications has been a key growth driving factor for the high pure tin market.
  • On the basis of application, the solder segment held a major share in the global high pure tin market. The solder segment accounted for a market share of nearly 45% in 2019.
  • With the rise in the number of compact electronic devices, the demand for superconducting materials has also boosted. This trend in the global electronics market is expected to boost the demand for high pure tin for superconducting applications.
  • The demand for solar cells has augmented due to rising investment in solar energy. This has led to advancements in technological advancements in solar grid technology, which is expected to create new opportunities for the global high pure tin market. The

logoGlobal Limonin Sales Market Share (%) by Region in 2019


The quantitative data is further underlined and reinforced by comprehensive qualitative data which comprises various across-the-board market dynamics. The rationales which directly or indirectly impact the high purity tin industry are exemplified through parameters such as growth drivers, restraints, challenges, and opportunities among other impacting factors.

Throughout our research report, we have encompassed all the proven models and tools of industry analysis and extensively illustrated all the key business strategies and business models adopted in the high purity tin industry. The report provides an all-inclusive and detailed competitive landscape prevalent in the high purity tin market.

The report utilizes established industry analysis tools and models such as Porter’s Five Forces framework to analyze and recognize critical business strategies adopted by various stakeholders involved in the entire value chain of the high purity tin industry. The high purity tin market report additionally employs SWOT analysis and PESTLE analysis models for further in-depth analysis.

The report study further includes an in-depth analysis of industry players' market shares and provides an overview of leading players' market position in the high purity tin sector. Key strategic developments in the high purity tin market competitive landscape such as acquisitions & mergers, inaugurations of different products and services, partnerships & joint ventures, MoU agreements, VC & funding activities, R&D activities, and geographic expansion among other noteworthy activities by key players of the high purity tin market are appropriately highlighted in the report.

Tin is a shiny, lightweight, and easy to melt element. Tin is not used in its pure form. Tin is used to prepare alloys to benefit other elements with the beneficial properties of tin. Tin offers high corrosion resistance and has low toxicity levels. Tin is easy to shape i.e. Malleable and is a ductile material. For decades, tin has been used for producing bronze artifacts. Tin has also been used for manufacturing lead. Tin is also used in the electronics and semiconductor industry. As tin has a low boiling point, therefore tin is used as a binding material in semiconductor verticals.    

Major industrial applications of tin are the use of tin for plating and soldering in semiconductor applications. For soldering, rosin core solder is commonly used which is made from tin or copper alloy. In recent years, the electronics and semiconductor industry has shown a substantial increase due to the rising demand for consumer electronics devices globally. Moreover, technological advancements in electronics have led to the development of miniature electronics. Tin is primarily used for welding and soldering purposes in the semiconductor industry. The soaring semiconductor industry has augmented the demand for tin around the world.

logoReport Scope

Report Attribute

Details

Market Size in 2019

USD 6,700 Million

Projected Market Size in 2026

USD 8,600 Million

CAGR Growth Rate

3.5% CAGR

Base Year

2019

Forecast Years

2020-2026

Key Market Players

Thaisarco, JGI, ESPI, Malaysia Smelting Corporation, Yunnan Tin Company, American Elements, Nathan Trotter, Minsur, Stanford Advanced Materials, Xylem Inc. (Pure Technologies), PT TIMAH (Persero) Tbk, and Others

Key Segment

By Type, Application, and Region

Major Regions Covered

North America, Europe, Asia Pacific, Latin America, and the Middle East & Africa

Purchase Options

Request customized purchase options to meet your research needs. Explore purchase options

The high purity tin market research report delivers an acute valuation and taxonomy of the high purity tin industry by practically splitting the market on the basis of different types, applications, and regions. Through the analysis of the historical and projected trends, all the segments and sub-segments were evaluated through the bottom-up approach, and different market sizes have been projected for FY 2020 to FY 2026.

The regional segmentation of the high purity tin industry includes the complete classification of all the major continents including North America, Latin America, Europe, Asia Pacific, and Middle East & Africa. Further, country-wise data for the high purity tin industry is provided for the leading economies of the world.

The high purity tin market is segmented based on type and application.  On the basis of type segmentation, the market is classified into 5N Tin, 6N Tin, and 7N Tin. In terms of application segmentation, the market is bifurcated into superconducting material, tin alloy, solder, pyroelectric materials, and others.

logoSome of the essential players operating in the high purity tin market, but not restricted to include

  • Thaisarco
  •  JGI
  •  ESPI
  •  Malaysia Smelting Corporation
  •  Yunnan Tin Company
  •  American Elements
  •  Nathan Trotter
  •  Minsur
  •  Stanford Advanced Materials
  •  Xylem Inc. (Pure Technologies)
  •  PT TIMAH (Persero) Tbk

The taxonomy of the high purity tin industry by its scope and segmentation is as follows:

logo By Type Segmentation Analysis

  • 5N Tin
  • 6N Tin
  • 7N Tin

logo By Application Segmentation Analysis

  • Superconducting Material
  • Tin Alloy
  • Solder
  • Pyroelectric Materials
  • Others

logo Regional Segmentation Analysis

  • North America
    • The U.S.
    • Canada
  • Europe
    • France
    • The UK
    • Spain
    • Germany
    • Italy
    • Rest of Europe
  • Asia Pacific
    • China
    • Japan
    • India
    • South Korea
    • Southeast Asia
    • Rest of Asia Pacific
  • Latin America
    • Brazil
    • Mexico
    • Rest of Latin America
  • Middle East & Africa
    • GCC
    • South Africa
    • Rest of Middle East & Africa

logoKEY BUSINESS POINTERS ADDRESSED & FOREMOST REASONS TO PROCURE THE REPORT:

  • Statistical Analysis of the Past, Current, and Future Trends of the Industry with Validated Market Sizes Data
  • Direct and Indirect Rationales Impacting the Industry
  • In-depth and Micro Analysis of Viable Segments and Sub-segments
  • Companies and Vendors Market Share, Competitive Landscape, and Player Positioning Analysis
  • Demand Side (Consumption) and Supply Side (Production) Perspective and Analysis wherever applicable
  • Key Buyers and End-Users Analysis
  • Value Chain and Manufacturing Cost Structure Analysis wherever relevant
  • Key Marketing Strategies as well as Key Sales Channels adopted in the market
  • Investment Opportunity Analysis & Patents Analysis wherever feasible
  • Technological Road Map & Technical Analysis
  • Robust Research Methodology comprising dynamic mix (65%~35%) of Extensive Primary Research (primary interviews, ad-hoc surveys, questionnaires) and Protracted Secondary Research (proprietary in-house database, paid external databases, publically available validated sources)

Table of Content

  1. CHAPTER 1. Executive Summary
  2. CHAPTER 2. High Purity Tin market – Types Analysis
    1. 2.1. Global High Purity Tin Market – Types Overview
    2. 2.2. Global High Purity Tin Market Share, by Types, 2019& 2025 (USD Million)
    3. 2.3. Global High Purity Tin Market share, by Types, 2019& 2025 (Kilo Tons)
    4. 2.4. 5N Tin
      1. 2.4.1. Global 5N Tin High Purity Tin Market, 2016-2026 (USD Million)
      2. 2.4.2. Global 5N Tin High Purity Tin Market, 2016-2026 (Kilo Tons)
    5. 2.5. 6N Tin
      1. 2.5.1. Global 6N Tin High Purity Tin Market, 2016-2026 (USD Million)
      2. 2.5.2. Global 6N Tin High Purity Tin Market, 2016-2026 (Kilo Tons)
    6. 2.6. 7N Tin
      1. 2.6.1. Global 7N Tin High Purity Tin Market, 2016-2026 (USD Million)
      2. 2.6.2. Global 7N Tin High Purity Tin Market, 2016-2026 (Kilo Tons)
  3. CHAPTER 3. High Purity Tin market – Applications Analysis
    1. 3.1. Global High Purity Tin Market – Applications Overview
    2. 3.2. Global High Purity Tin Market Share, by Applications, 2019& 2025 (USD Million)
    3. 3.3. Global High Purity Tin Market share, by Applications, 2019& 2025 (Kilo Tons)
    4. 3.4. Superconducting Material
      1. 3.4.1. Global Superconducting Material High Purity Tin Market, 2016-2026 (USD Million)
      2. 3.4.2. Global Superconducting Material High Purity Tin Market, 2016-2026 (Kilo Tons)
    5. 3.5. Tin Alloy
      1. 3.5.1. Global Tin Alloy High Purity Tin Market, 2016-2026 (USD Million)
      2. 3.5.2. Global Tin Alloy High Purity Tin Market, 2016-2026 (Kilo Tons)
    6. 3.6. Solder
      1. 3.6.1. Global Solder High Purity Tin Market, 2016-2026 (USD Million)
      2. 3.6.2. Global Solder High Purity Tin Market, 2016-2026 (Kilo Tons)
    7. 3.7. Pyroelectric Materials
      1. 3.7.1. Global Pyroelectric Materials High Purity Tin Market, 2016-2026 (USD Million)
      2. 3.7.2. Global Pyroelectric Materials High Purity Tin Market, 2016-2026 (Kilo Tons)
    8. 3.8. Others
      1. 3.8.1. Global Others High Purity Tin Market, 2016-2026 (USD Million)
      2. 3.8.2. Global Others High Purity Tin Market, 2016-2026 (Kilo Tons)
  4. CHAPTER 4. High Purity Tin market – Regional Analysis
    1. 4.1. Global High Purity Tin Market Regional Overview
    2. 4.2. Global High Purity Tin Market Share, by Region, 2019& 2025 (Value)
    3. 4.3. Global High Purity Tin Market Share, by Region, 2019& 2025 (Volume)
    4. 4.4. North America
      1. 4.4.1. North America High Purity Tin Market size and forecast, 2016-2026
      2. 4.4.2. North America High Purity Tin Market, by Country, 2019 - 2025 (USD Million)
      3. 4.4.3. North America Market size and forecast, 2016-2026 (Kilo Tons)
      4. 4.4.4. North America High Purity Tin Market, by Country, 2019 - 2025 (Kilo Tons)
      5. 4.4.5. North America High Purity Tin Market, by Types, 2016-2026
        1. 4.4.5.1. North America High Purity Tin Market, by Types, 2016-2026 (USD Million)
        2. 4.4.5.2. North America High Purity Tin Market, by Types, 2016-2026 (Kilo Tons)
      6. 4.4.6. North America High Purity Tin Market, by Applications, 2016-2026
        1. 4.4.6.1. North America High Purity Tin Market, by Applications, 2016-2026 (USD Million)
        2. 4.4.6.2. North America High Purity Tin Market, by Applications, 2016-2026 (Kilo Tons)
      7. 4.4.7. U.S.
        1. 4.4.7.1. U.S. Market size and forecast, 2016-2026 (USD Million)
        2. 4.4.7.2. U.S. Market size and forecast, 2016-2026 (Kilo Tons)
      8. 4.4.8. Canada
        1. 4.4.8.1. Canada Market size and forecast, 2016-2026 (USD Million)
        2. 4.4.8.2. Canada Market size and forecast, 2016-2026 (Kilo Tons)
    5. 4.5. Europe
      1. 4.5.1. Europe High Purity Tin Market size and forecast, 2016-2026
      2. 4.5.2. Europe High Purity Tin Market, by Country, 2019 - 2025 (USD Million)
      3. 4.5.3. Europe Market size and forecast, 2016-2026 (Kilo Tons)
      4. 4.5.4. Europe High Purity Tin Market, by Country, 2019 - 2025 (Kilo Tons)
      5. 4.5.5. Europe High Purity Tin Market, by Types, 2016-2026
        1. 4.5.5.1. Europe High Purity Tin Market, by Types, 2016-2026 (USD Million)
        2. 4.5.5.2. Europe High Purity Tin Market, by Types, 2016-2026 (Kilo Tons)
      6. 4.5.6. Europe High Purity Tin Market, by Applications, 2016-2026
        1. 4.5.6.1. Europe High Purity Tin Market, by Applications, 2016-2026 (USD Million)
        2. 4.5.6.2. Europe High Purity Tin Market, by Applications, 2016-2026 (Kilo Tons)
      7. 4.5.7. Germany
        1. 4.5.7.1. Germany Market size and forecast, 2016-2026 (USD Million)
        2. 4.5.7.2. Germany Market size and forecast, 2016-2026 (Kilo Tons)
      8. 4.5.8. France
        1. 4.5.8.1. France Market size and forecast, 2016-2026 (USD Million)
        2. 4.5.8.2. France Market size and forecast, 2016-2026 (Kilo Tons)
      9. 4.5.9. U.K.
        1. 4.5.9.1. U.K. Market size and forecast, 2016-2026 (USD Million)
        2. 4.5.9.2. U.K. Market size and forecast, 2016-2026 (Kilo Tons)
      10. 4.5.10. Italy
        1. 4.5.10.1. Italy Market size and forecast, 2016-2026 (USD Million)
        2. 4.5.10.2. Italy Market size and forecast, 2016-2026 (Kilo Tons)
      11. 4.5.11. Spain
        1. 4.5.11.1. Spain Market size and forecast, 2016-2026 (USD Million)
        2. 4.5.11.2. Spain Market size and forecast, 2016-2026 (Kilo Tons)
      12. 4.5.12. Rest of Europe
        1. 4.5.12.1. Rest of Europe Market size and forecast, 2016-2026 (USD Million)
        2. 4.5.12.2. Rest of Europe Market size and forecast, 2016-2026 (Kilo Tons)
    6. 4.6. Asia Pacific
      1. 4.6.1. Asia Pacific High Purity Tin Market size and forecast, 2016-2026
      2. 4.6.2. Asia Pacific High Purity Tin Market, by Country, 2019 - 2025 (USD Million)
      3. 4.6.3. Asia Pacific Market size and forecast, 2016-2026 (Kilo Tons)
      4. 4.6.4. Asia Pacific High Purity Tin Market, by Country, 2019 - 2025 (Kilo Tons)
      5. 4.6.5. Asia Pacific High Purity Tin Market, by Types, 2016-2026
        1. 4.6.5.1. Asia Pacific High Purity Tin Market, by Types, 2016-2026 (USD Million)
        2. 4.6.5.2. Asia Pacific High Purity Tin Market, by Types, 2016-2026 (Kilo Tons)
      6. 4.6.6. Asia Pacific High Purity Tin Market, by Applications, 2016-2026
        1. 4.6.6.1. Asia Pacific High Purity Tin Market, by Applications, 2016-2026 (USD Million)
        2. 4.6.6.2. Asia Pacific High Purity Tin Market, by Applications, 2016-2026 (Kilo Tons)
      7. 4.6.7. China
        1. 4.6.7.1. China Market size and forecast, 2016-2026 (USD Million)
        2. 4.6.7.2. China Market size and forecast, 2016-2026 (Kilo Tons)
      8. 4.6.8. Japan
        1. 4.6.8.1. Japan Market size and forecast, 2016-2026 (USD Million)
        2. 4.6.8.2. Japan Market size and forecast, 2016-2026 (Kilo Tons)
      9. 4.6.9. India
        1. 4.6.9.1. India Market size and forecast, 2016-2026 (USD Million)
        2. 4.6.9.2. India Market size and forecast, 2016-2026 (Kilo Tons)
      10. 4.6.10. South Korea
        1. 4.6.10.1. South Korea Market size and forecast, 2016-2026 (USD Million)
        2. 4.6.10.2. South Korea Market size and forecast, 2016-2026 (Kilo Tons)
      11. 4.6.11. South-East Asia
        1. 4.6.11.1. South-East Asia Market size and forecast, 2016-2026 (USD Million)
        2. 4.6.11.2. South-East Asia Market size and forecast, 2016-2026 (Kilo Tons)
      12. 4.6.12. Rest of Asia Pacific
        1. 4.6.12.1. Rest of Asia Pacific Market size and forecast, 2016-2026 (USD Million)
        2. 4.6.12.2. Rest of Asia Pacific Market size and forecast, 2016-2026 (Kilo Tons)
    7. 4.7. Latin America
      1. 4.7.1. Latin America High Purity Tin Market size and forecast, 2016-2026
      2. 4.7.2. Latin America High Purity Tin Market, by Country, 2019 - 2025 (USD Million)
      3. 4.7.3. Latin America Market size and forecast, 2016-2026 (Kilo Tons)
      4. 4.7.4. Latin America High Purity Tin Market, by Country, 2019 - 2025 (Kilo Tons)
      5. 4.7.5. Latin America High Purity Tin Market, by Types, 2016-2026
        1. 4.7.5.1. Latin America High Purity Tin Market, by Types, 2016-2026 (USD Million)
        2. 4.7.5.2. Latin America High Purity Tin Market, by Types, 2016-2026 (Kilo Tons)
      6. 4.7.6. Latin America High Purity Tin Market, by Applications, 2016-2026
        1. 4.7.6.1. Latin America High Purity Tin Market, by Applications, 2016-2026 (USD Million)
        2. 4.7.6.2. Latin America High Purity Tin Market, by Applications, 2016-2026 (Kilo Tons)
      7. 4.7.7. Brazil
        1. 4.7.7.1. Brazil Market size and forecast, 2016-2026 (USD Million)
        2. 4.7.7.2. Brazil Market size and forecast, 2016-2026 (Kilo Tons)
      8. 4.7.8. Mexico
        1. 4.7.8.1. Mexico Market size and forecast, 2016-2026 (USD Million)
        2. 4.7.8.2. Mexico Market size and forecast, 2016-2026 (Kilo Tons)
      9. 4.7.9. Rest of Latin America
        1. 4.7.9.1. Rest of Latin America Market size and forecast, 2016-2026 (USD Million)
        2. 4.7.9.2. Rest of Latin America Market size and forecast, 2016-2026 (Kilo Tons)
    8. 4.8. The Middle-East and Africa
      1. 4.8.1. The Middle-East and Africa High Purity Tin Market size and forecast, 2016-2026
      2. 4.8.2. The Middle-East and Africa High Purity Tin Market, by Country, 2019 - 2025 (USD Million)
      3. 4.8.3. The Middle-East and Africa Market size and forecast, 2016-2026 (Kilo Tons)
      4. 4.8.4. The Middle-East and Africa High Purity Tin Market, by Country, 2019 - 2025 (Kilo Tons)
      5. 4.8.5. The Middle-East and Africa High Purity Tin Market, by Types, 2016-2026
        1. 4.8.5.1. The Middle-East and Africa High Purity Tin Market, by Types, 2016-2026 (USD Million)
        2. 4.8.5.2. The Middle-East and Africa High Purity Tin Market, by Types, 2016-2026 (Kilo Tons)
      6. 4.8.6. The Middle-East and Africa High Purity Tin Market, by Applications, 2016-2026
        1. 4.8.6.1. The Middle-East and Africa High Purity Tin Market, by Applications, 2016-2026 (USD Million)
        2. 4.8.6.2. The Middle-East and Africa High Purity Tin Market, by Applications, 2016-2026 (Kilo Tons)
      7. 4.8.7. GCC Countries
        1. 4.8.7.1. GCC Countries Market size and forecast, 2016-2026 (USD Million)
        2. 4.8.7.2. GCC Countries Market size and forecast, 2016-2026 (Kilo Tons)
      8. 4.8.8. South Africa
        1. 4.8.8.1. South Africa Market size and forecast, 2016-2026 (USD Million)
        2. 4.8.8.2. South Africa Market size and forecast, 2016-2026 (Kilo Tons)
      9. 4.8.9. Rest of Middle-East Africa
        1. 4.8.9.1. Rest of Middle-East Africa Market size and forecast, 2016-2026 (USD Million)
        2. 4.8.9.2. Rest of Middle-East Africa Market size and forecast, 2016-2026 (Kilo Tons)
  5. CHAPTER 5. High Purity Tin Production, Consumption, Export, Import by Regions
    1. 5.1. Global High Purity Tin production and revenue, 2016-2026 (USD Million) (Kilo Tons)
    2. 5.2. Global Import and Export Analysis, by Region
  6. CHAPTER 6. High Purity Tin market – Competitive Landscape
    1. 6.1. Competitor Market Share – Revenue
    2. 6.2. Market Concentration Rate Analysis, Top 3 and Top 5 Players
    3. 6.3. Competitor Market Share – Volume
    4. 6.4. Strategic Development
      1. 6.4.1. Acquisitions and Mergers
      2. 6.4.2. New Products
      3. 6.4.3. Research & Development Activities
  7. CHAPTER 7. Company Profiles
    1. 7.1. Thaisarco
      1. 7.1.1. Company Overview
      2. 7.1.2. Thaisarco Sales, Revenue, Price, and Gross Margin
      3. 7.1.3. Product portfolio
      4. 7.1.4. Recent initiatives
    2. 7.2. JGI
      1. 7.2.1. Company Overview
      2. 7.2.2. JGI Sales, Revenue, Price, and Gross Margin
      3. 7.2.3. Product portfolio
      4. 7.2.4. Recent initiatives
    3. 7.3. ESPI
      1. 7.3.1. Company Overview
      2. 7.3.2. ESPI Sales, Revenue, Price, and Gross Margin
      3. 7.3.3. Product portfolio
      4. 7.3.4. Recent initiatives
    4. 7.4. Malaysia Smelting Corporation
      1. 7.4.1. Company Overview
      2. 7.4.2. Malaysia Smelting Corporation Sales, Revenue, Price, and Gross Margin
      3. 7.4.3. Product portfolio
      4. 7.4.4. Recent initiatives
    5. 7.5. Yunnan Tin Company
      1. 7.5.1. Company Overview
      2. 7.5.2. Yunnan Tin Company Sales, Revenue, Price, and Gross Margin
      3. 7.5.3. Product portfolio
      4. 7.5.4. Recent initiatives
    6. 7.6. American Elements
      1. 7.6.1. Company Overview
      2. 7.6.2. American Elements Sales, Revenue, Price, and Gross Margin
      3. 7.6.3. Product portfolio
      4. 7.6.4. Recent initiatives
    7. 7.7. Nathan Trotter
      1. 7.7.1. Company Overview
      2. 7.7.2. Nathan Trotter Sales, Revenue, Price, and Gross Margin
      3. 7.7.3. Product portfolio
      4. 7.7.4. Recent initiatives
    8. 7.8. Minsur
      1. 7.8.1. Company Overview
      2. 7.8.2. Minsur Sales, Revenue, Price, and Gross Margin
      3. 7.8.3. Product portfolio
      4. 7.8.4. Recent initiatives
    9. 7.9. Stanford Advanced Materials
      1. 7.9.1. Company Overview
      2. 7.9.2. Stanford Advanced Materials Sales, Revenue, Price, and Gross Margin
      3. 7.9.3. Product portfolio
      4. 7.9.4. Recent initiatives
    10. 7.10. Xylem Inc. (Pure Technologies)
      1. 7.10.1. Company Overview
      2. 7.10.2. Xylem Inc. (Pure Technologies) Sales, Revenue, Price, and Gross Margin
      3. 7.10.3. Product portfolio
      4. 7.10.4. Recent initiatives
    11. 7.11. PT TIMAH (Persero) Tbk.
      1. 7.11.1. Company Overview
      2. 7.11.2. PT TIMAH (Persero) Tbk. Sales, Revenue, Price, and Gross Margin
      3. 7.11.3. Product portfolio
      4. 7.11.4. Recent initiatives
  8. CHAPTER 8. High Purity Tin — Industry Analysis
    1. 8.1. Introduction and Taxonomy
    2. 8.2. High Purity Tin Market – Key Trends
      1. 8.2.1. Market Drivers
      2. 8.2.2. Market Restraints
      3. 8.2.3. Market Opportunities
    3. 8.3. Value Chain Analysis
    4. 8.4. Key Mandates and Regulations
    5. 8.5. Technology Roadmap and Timeline
    6. 8.6. High Purity Tin market – Attractiveness Analysis
      1. 8.6.1. By Types
      2. 8.6.2. By Applications
      3. 8.6.3. By Region
  9. CHAPTER 9. Raw Material analysis
    1. 9.1. High Purity Tin Key Raw Material Analysis
      1. 9.1.1. Key Raw Materials
      2. 9.1.2. Price Trend of Key Raw Materials
    2. 9.2. Key Suppliers of Raw Materials
    3. 9.3. Proportion of Manufacturing Cost Structure
      1. 9.3.1. Raw Materials
      2. 9.3.2. Labor Cost
    4. 9.4. Manufacturing Expenses Analysis of High Purity Tin
  10. CHAPTER 10. Industrial Chain, Sourcing Strategy and Downstream Buyers
    1. 10.1. High Purity Tin Industrial Chain Analysis
    2. 10.2. Upstream Raw Materials Sourcing
      1. 10.2.1. Risk Mitigation:
      2. 10.2.2. Supplier Relationships:
      3. 10.2.3. Business Processes:
      4. 10.2.4. Securing the Product:
    3. 10.3. Raw Materials Sources of High Purity Tin Major Manufacturers in 2016
    4. 10.4. Downstream Buyers
    5. 10.5. Distributors/Traders List
  11. CHAPTER 11. Marketing Strategy Analysis, Distributors
    1. 11.1. Marketing Channel
    2. 11.2. Direct Marketing
    3. 11.3. Indirect Marketing
    4. 11.4. Marketing Channel Development Trend
    5. 11.5. Economic/Political Environmental Change
  12. CHAPTER 12. Report Conclusion
  13. CHAPTER 13. Research Approach & Methodology
    1. 13.1. Report Description
    2. 13.2. Research Scope
    3. 13.3. Research Methodology
      1. 13.3.1. Secondary Research
      2. 13.3.2. Primary Research
      3. 13.3.3. Models
        1. 13.3.3.1. Company Share Analysis Model
        2. 13.3.3.2. Revenue Based Modeling
        3. 13.3.3.3. Research Limitations

  • List of Figures

    FIG. 1 Global High Purity Tin Market, 2016-2026 (USD Million)
    FIG. 2 Global High Purity Tin Market Share, by Types, 2019& 2025 (USD Million)
    FIG. 3 Global High Purity Tin Market share, by Types, 2019& 2025 (Kilo Tons)
    FIG. 4 Global 5N Tin High Purity Tin Market, 2016-2026 (USD Million)
    FIG. 5 Global 5N Tin High Purity Tin  Market, 2016-2026 (Kilo Tons)
    FIG. 6 Global 6N Tin High Purity Tin Market, 2016-2026 (USD Million)
    FIG. 7 Global 6N Tin High Purity Tin  Market, 2016-2026 (Kilo Tons)
    FIG. 8 Global 7N Tin High Purity Tin Market, 2016-2026 (USD Million)
    FIG. 9 Global 7N Tin High Purity Tin  Market, 2016-2026 (Kilo Tons)
    FIG. 10 Global High Purity Tin Market Share, by Applications, 2019& 2025 (USD Million)
    FIG. 11 Global High Purity Tin Market share, by Applications, 2019& 2025 (Kilo Tons)
    FIG. 12 Global Superconducting Material High Purity Tin Market, 2016-2026 (USD Million)
    FIG. 13 Global Superconducting Material High Purity Tin  Market, 2016-2026 (Kilo Tons)
    FIG. 14 Global Tin Alloy High Purity Tin Market, 2016-2026 (USD Million)
    FIG. 15 Global Tin Alloy High Purity Tin  Market, 2016-2026 (Kilo Tons)
    FIG. 16 Global Solder High Purity Tin Market, 2016-2026 (USD Million)
    FIG. 17 Global Solder High Purity Tin  Market, 2016-2026 (Kilo Tons)
    FIG. 18 Global Pyroelectric Materials High Purity Tin Market, 2016-2026 (USD Million)
    FIG. 19 Global Pyroelectric Materials High Purity Tin  Market, 2016-2026 (Kilo Tons)
    FIG. 20 Global Others High Purity Tin Market, 2016-2026 (USD Million)
    FIG. 21 Global Others High Purity Tin  Market, 2016-2026 (Kilo Tons)
    FIG. 22 Global High Purity Tin Market Share, by Region, 2019& 2025
    FIG. 23 Global High Purity Tin Market Share, by Region, 2019& 2025
    FIG. 24 North America High Purity Tin Market, 2016-2026
    FIG. 25 North America High Purity Tin  Market, 2016-2026 (Kilo Tons)
    FIG. 26 U.S. High Purity Tin Market, 2016-2026
    FIG. 27 U.S. High Purity Tin  Market, 2016-2026 (Kilo Tons)
    FIG. 28 Canada High Purity Tin Market, 2016-2026
    FIG. 29 Canada High Purity Tin  Market, 2016-2026 (Kilo Tons)
    FIG. 30 Europe High Purity Tin Market, 2016-2026
    FIG. 31 Europe High Purity Tin  Market, 2016-2026 (Kilo Tons)
    FIG. 32 Germany High Purity Tin Market, 2016-2026
    FIG. 33 Germany High Purity Tin  Market, 2016-2026 (Kilo Tons)
    FIG. 34 France High Purity Tin Market, 2016-2026
    FIG. 35 France High Purity Tin  Market, 2016-2026 (Kilo Tons)
    FIG. 36 U.K. High Purity Tin Market, 2016-2026
    FIG. 37 U.K. High Purity Tin  Market, 2016-2026 (Kilo Tons)
    FIG. 38 Italy High Purity Tin Market, 2016-2026
    FIG. 39 Italy High Purity Tin  Market, 2016-2026 (Kilo Tons)
    FIG. 40 Spain High Purity Tin Market, 2016-2026
    FIG. 41 Spain High Purity Tin  Market, 2016-2026 (Kilo Tons)
    FIG. 42 Rest of Europe High Purity Tin Market, 2016-2026
    FIG. 43 Rest of Europe High Purity Tin  Market, 2016-2026 (Kilo Tons)
    FIG. 44 Asia Pacific High Purity Tin Market, 2016-2026
    FIG. 45 Asia Pacific High Purity Tin  Market, 2016-2026 (Kilo Tons)
    FIG. 46 China High Purity Tin Market, 2016-2026
    FIG. 47 China High Purity Tin  Market, 2016-2026 (Kilo Tons)
    FIG. 48 Japan High Purity Tin Market, 2016-2026
    FIG. 49 Japan High Purity Tin  Market, 2016-2026 (Kilo Tons)
    FIG. 50 India High Purity Tin Market, 2016-2026
    FIG. 51 India High Purity Tin  Market, 2016-2026 (Kilo Tons)
    FIG. 52 South  Korea High Purity Tin Market, 2016-2026
    FIG. 53 South  Korea High Purity Tin  Market, 2016-2026 (Kilo Tons)
    FIG. 54 South-East Asia High Purity Tin Market, 2016-2026
    FIG. 55 South-East Asia High Purity Tin  Market, 2016-2026 (Kilo Tons)
    FIG. 56 Rest of Asia Pacific High Purity Tin Market, 2016-2026
    FIG. 57 Rest of Asia Pacific High Purity Tin  Market, 2016-2026 (Kilo Tons)
    FIG. 58 Latin America High Purity Tin Market, 2016-2026
    FIG. 59 Latin America High Purity Tin  Market, 2016-2026 (Kilo Tons)
    FIG. 60 Brazil High Purity Tin Market, 2016-2026
    FIG. 61 Brazil High Purity Tin  Market, 2016-2026 (Kilo Tons)
    FIG. 62 Mexico High Purity Tin Market, 2016-2026
    FIG. 63 Mexico High Purity Tin  Market, 2016-2026 (Kilo Tons)
    FIG. 64 Rest of Latin America High Purity Tin Market, 2016-2026
    FIG. 65 Rest of Latin America High Purity Tin  Market, 2016-2026 (Kilo Tons)
    FIG. 66 The Middle-East and Africa High Purity Tin Market, 2016-2026
    FIG. 67 The Middle-East and Africa High Purity Tin  Market, 2016-2026 (Kilo Tons)
    FIG. 68 GCC Countries High Purity Tin Market, 2016-2026
    FIG. 69 GCC Countries High Purity Tin  Market, 2016-2026 (Kilo Tons)
    FIG. 70 South Africa High Purity Tin Market, 2016-2026
    FIG. 71 South Africa High Purity Tin  Market, 2016-2026 (Kilo Tons)
    FIG. 72 Rest of Middle-East Africa High Purity Tin Market, 2016-2026
    FIG. 73 Rest of Middle-East Africa High Purity Tin  Market, 2016-2026 (Kilo Tons)
    FIG. 74 Global High Purity Tin production and revenue, 2016-2026 (USD Million) (Kilo Tons)
    FIG. 75 North America High Purity Tin production and revenue, 2016-2026 (USD Million) (Kilo Tons)
    FIG. 76 Europe High Purity Tin production and revenue, 2016-2026 (USD Million) (Kilo Tons)
    FIG. 77 Asia Pacific High Purity Tin production and revenue, 2016-2026 (USD Million) (Kilo Tons)
    FIG. 78 Latin America High Purity Tin production and revenue, 2016-2026 (USD Million) (Kilo Tons)
    FIG. 79 Middle East and Africa High Purity Tin production and revenue, 2016-2026 (USD Million) (Kilo Tons)
    FIG. 80 Competitor Market Share – Revenue
    FIG. 81 Competitor Market Share – Volume
    FIG. 82 Thaisarco Revenue and Growth Rate
    FIG. 83 Thaisarco Market Share
    FIG. 84 JGI Revenue and Growth Rate
    FIG. 85 JGI Market Share
    FIG. 86 ESPI Revenue and Growth Rate
    FIG. 87 ESPI Market Share
    FIG. 88 Malaysia Smelting Corporation Revenue and Growth Rate
    FIG. 89 Malaysia Smelting Corporation Market Share
    FIG. 90 Yunnan Tin Company Revenue and Growth Rate
    FIG. 91 Yunnan Tin Company Market Share
    FIG. 92 American Elements Revenue and Growth Rate
    FIG. 93 American Elements Market Share
    FIG. 94 Nathan Trotter Revenue and Growth Rate
    FIG. 95 Nathan Trotter Market Share
    FIG. 96 Minsur Revenue and Growth Rate
    FIG. 97 Minsur Market Share
    FIG. 98 Stanford Advanced Materials Revenue and Growth Rate
    FIG. 99 Stanford Advanced Materials Market Share
    FIG. 100 Xylem Inc. (Pure Technologies) Revenue and Growth Rate
    FIG. 101 Xylem Inc. (Pure Technologies) Market Share
    FIG. 102 PT TIMAH (Persero) Tbk. Revenue and Growth Rate
    FIG. 103 PT TIMAH (Persero) Tbk. Market Share
    FIG. 104 Market Dynamics
    FIG. 105 Global High Purity Tin – Value Chain Analysis
    FIG. 106 Key Mandates and Regulations
    FIG. 107 Technology Roadmap and Timeline
    FIG. 108 Market Attractiveness Analysis – By Types
    FIG. 109 Market Attractiveness Analysis – By Applications
    FIG. 110 Market Attractiveness Analysis – By Region
    FIG. 111 Manufacturing Cost Structure of High Purity Tin
    FIG. 112 High Purity Tin Industrial Chain Analysis
    FIG. 113 Market Channel
    FIG. 114 Marketing Channel Development Trend
    FIG. 115 Growth in World Gross Product, 2008-2019

    List of Tables

    TABLE 1 Global High Purity Tin market, 2019& 2025 (USD Million)
    TABLE 2 Global High Purity Tin market, by Types, 2016-2026 (USD Million)
    TABLE 3 Global High Purity Tin market, by Types, 2016-2026 (Kilo Tons)
    TABLE 4 Global High Purity Tin market, by Applications, 2016-2026 (USD Million)
    TABLE 5 Global High Purity Tin market, by Applications, 2016-2026 (Kilo Tons)
    TABLE 6 Global High Purity Tin market, by region, 2016-2026 (USD Million)
    TABLE 7 Global High Purity Tin market, by region, 2016-2026 (Kilo Tons)
    TABLE 8 North America High Purity Tin Market, by Types, 2016-2026 (USD Million)
    TABLE 9 North America High Purity Tin Market, by Types, 2016-2026 (Kilo Tons)
    TABLE 10 North America High Purity Tin Market, by Applications, 2016-2026 (USD Million)
    TABLE 11 North America High Purity Tin Market, by Applications, 2016-2026 (Kilo Tons)
    TABLE 12 Europe High Purity Tin Market, by Types, 2016-2026 (USD Million)
    TABLE 13 Europe High Purity Tin Market, by Types, 2016-2026 (Kilo Tons)
    TABLE 14 Europe High Purity Tin Market, by Applications, 2016-2026 (USD Million)
    TABLE 15 Europe High Purity Tin Market, by Applications, 2016-2026 (Kilo Tons)
    TABLE 16 Asia Pacific High Purity Tin Market, by Types, 2016-2026 (USD Million)
    TABLE 17 Asia Pacific High Purity Tin Market, by Types, 2016-2026 (Kilo Tons)
    TABLE 18 Asia Pacific High Purity Tin Market, by Applications, 2016-2026 (USD Million)
    TABLE 19 Asia Pacific High Purity Tin Market, by Applications, 2016-2026 (Kilo Tons)
    TABLE 20 Latin America High Purity Tin Market, by Types, 2016-2026 (USD Million)
    TABLE 21 Latin America High Purity Tin Market, by Types, 2016-2026 (Kilo Tons)
    TABLE 22 Latin America High Purity Tin Market, by Applications, 2016-2026 (USD Million)
    TABLE 23 Latin America High Purity Tin Market, by Applications, 2016-2026 (Kilo Tons)
    TABLE 24 The Middle-East and Africa High Purity Tin Market, by Types, 2016-2026 (USD Million)
    TABLE 25 The Middle-East and Africa High Purity Tin Market, by Types, 2016-2026 (Kilo Tons)
    TABLE 26 The Middle-East and Africa High Purity Tin Market, by Applications, 2016-2026 (USD Million)
    TABLE 27 The Middle-East and Africa High Purity Tin Market, by Applications, 2016-2026 (Kilo Tons)
    TABLE 28 North America High Purity Tin Production, Consumption, Export, Import, 2016-2019
    TABLE 29 Europe High Purity Tin Production, Consumption, Export, Import, 2016-2019
    TABLE 30 Asia Pacific High Purity Tin Production, Consumption, Export, Import, 2016-2019
    TABLE 31 Latin America High Purity Tin Production, Consumption, Export, Import, 2016-2019
    TABLE 32 Middle East & Africa High Purity Tin Production, Consumption, Export, Import, 2016-2019
    TABLE 33 Global High Purity Tin Market - Company Revenue Analysis 2016-2019 (USD Million)
    TABLE 34 Global High Purity Tin Market - Company Revenue Share Analysis 2016-2019(%)
    TABLE 35 Global High Purity Tin Market - Company Volume Analysis 2016-2019 (Kilo Tons)
    TABLE 36 Global High Purity Tin Market - Company Volume Share Analysis 2016-2019(%)
    TABLE 37 Acquisitions and Mergers
    TABLE 38 New Product/Service Launch
    TABLE 39 Research & Development Activities
    TABLE 40 Market Drivers
    TABLE 41 Market Restraints
    TABLE 42 Market Opportunities
    TABLE 43 Production Base and Market Concentration Rate of Raw Material
    TABLE 44 Key Suppliers of Raw Materials
    TABLE 45 Raw Materials Sources of High Purity Tin Major Manufacturers in 2016
    TABLE 46 Major Buyers of High Purity Tin
    TABLE 47 Distributors/Traders of High Purity Tin by Region
  •  

    Industry Major Market Players

    • Thaisarco
    •  JGI
    •  ESPI
    •  Malaysia Smelting Corporation
    •  Yunnan Tin Company
    •  American Elements
    •  Nathan Trotter
    •  Minsur
    •  Stanford Advanced Materials
    •  Xylem Inc. (Pure Technologies)
    •  PT TIMAH (Persero) Tbk