Search Market Research Report

Discover Our Latest Reports
Discover Our Featured Reports
Discover Top Selling Reports

High Purity Aluminum Market Size, Share Global Analysis Report, 2020–2026

report img

High Purity Aluminum Market By Type (4N, 5N, and 6N) and By Application (Electronic Industry, Chemical Industry, High Purity Alloy, and Others): Global Industry Outlook, Market Size, Business Intelligence, Consumer Preferences, Statistical Surveys, Comprehensive Analysis, Historical Developments, Current Trends, and Forecast 2020–2026

Industry Insights

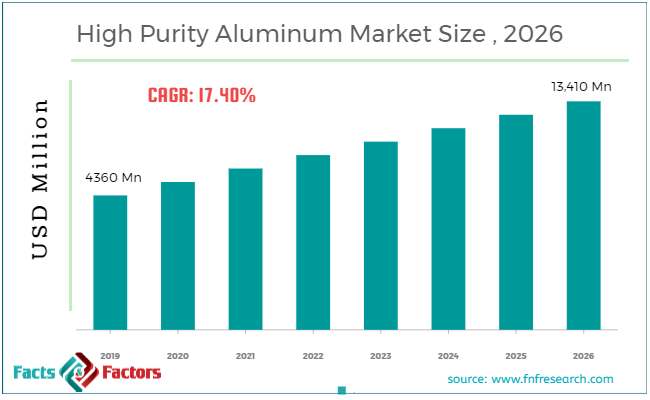
 According to the report published by Facts & Factors, the global High Purity Aluminum Market size was worth around USD 4360 billion in 2019 and is predicted to grow around USD 13,410 million by 2026 with a compound annual growth rate (CAGR) of roughly 17.4% between 2020 and 2026. The report analyzes the global High Purity Aluminum Market drivers, restraints/challenges, and the effect they have on the demands during the projection period. In addition, the report explores emerging opportunities in the High Purity Aluminum Market.

High Purity Aluminum Market

To know more about this report | Request Free Sample Copy

This specialized and expertise oriented industry research report scrutinizes the technical and commercial business outlook of the high purity alumina industry. The report analyzes and declares the historical and current trends analysis of the high purity alumina industry and subsequently recommends the projected trends anticipated to be observed in the high purity alumina market during the upcoming years.

The high purity alumina market report analyzes and notifies the industry statistics at the global as well as regional and country levels in order to acquire a thorough perspective of the entire high purity alumina market. The historical and past insights are provided for FY 2016 to FY 2019 whereas projected trends are delivered for FY 2020 to FY 2026. The quantitative and numerical data is represented in terms of both volume (Units) and value (USD Million) from FY 2016 – 2026.

logoKey Insights from Primary Research

  • In terms of consumption, China market accounted the largest market share in global high purity aluminum market in 2019.
  • The global high purity aluminum market is expected to reach around USD 13,500 Million by 2026.
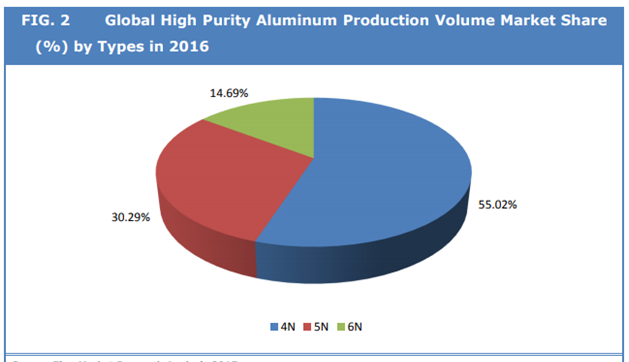
  • On basis of type segment, 4N dominated the global high purity aluminum market in 2019.
  • Based on various applications, the global high purity aluminum market was led by electronic industry in 2019.
  • Among region, Asia Pacific is expected to be the fastest growing market for high purity aluminum during the years to come.

logoKey Recommendations from Analysts

  • As per our analysts, the global high purity aluminamarket is expected to grow significantly over the forecast period.
  • The strategic and competitive advantage provided by the 4N alumina typeis anticipated to be the key factor driving this market globally.
  • Our team of analysts has identified, growing automotive sectors especially in China, India, Thailand and Indonesia are fueling the growth of the market.
  • In future years ahead, the electronic industry will offer lucrative opportunities for the market players operating in the market.
  • Overall, global market has the potential to grow owing to its overall initiative towards energy-efficient sources.

logoHigh Purity Alumina Production Volume Market Share – By Type

High Purity Alumina Market

To know more about this report | Request Free Sample Copy

The quantitative data is further underlined and reinforced by comprehensive qualitative data which comprises various across-the-board market dynamics. The rationales which directly or indirectly impact the high purity alumina industry are exemplified through parameters such as growth drivers, restraints, challenges, and opportunities among other impacting factors.

Throughout our research report, we have encompassed all the proven models and tools of industry analysis and extensively illustrated all the key business strategies and business models adopted in the high purity alumina industry. The report provides an all-inclusive and detailed competitive landscape prevalent in the high purity alumina market.

The report utilizes established industry analysis tools and models such as Porter’s Five Forces framework to analyze and recognize critical business strategies adopted by various stakeholders involved in the entire value chain of the high purity alumina industry. The high purity alumina market report additionally employs SWOT analysis and PESTLE analysis models for further in-depth analysis.

The report study further includes an in-depth analysis of industry players' market shares and provides an overview of leading players' market position in the high purity alumina sector. Key strategic developments in the high purity alumina market competitive landscape such as acquisitions & mergers, inaugurations of different products and services, partnerships & joint ventures, MoU agreements, VC & funding activities, R&D activities, and geographic expansion among other noteworthy activities by key players of the high purity alumina market are appropriately highlighted in the report.

logoReport Scope

Report Attribute

Details

Market Size in 2019

USD 4360 Million

Projected Market Size in 2026

USD 13,410 Million

CAGR Growth Rate

CAGR 17.40%

Base Year

2019

Forecast Years

2020-2026

Key Market Players

Joinworld, Hydro, Showa Denko, Zibo Xinfumeng Chemicals Co., Ltd, Kyushu Mitsui Aluminum, BAIKOWSKI, Sasol, Rusal, Sumitomo, XUancheng jingrui New Material Co. Ltd, C-KOE Metals, Nippon Light Metal, and Columbia Specialty Metals among others.

Key Segment

By Type, Application, and Region

Major Regions Covered

North America, Europe, Asia Pacific, Latin America, and the Middle East &, Africa

Purchase Options

Request customized purchase options to meet your research needs. Explore purchase options

Growing consumer preferences towards eco-friendly aspects are driving this high purity alumina market. For instance, in houses, usage of LED bulbs has increased due to its low cost, longer life and more energy efficient over the conventional bulbs and for manufacturing LEDs, HPA is required. Hence, a significant increase in the growth of the LED market is influencing the growth of high purity alumina market. Moreover, rising concerns regarding safety among the public, the demand for autonomous cars is increasing. To design such cars, semiconductors are needed to electrify the car. Thereby, the demand for HPA is high as for manufacturing such components HPA is needed. Hence, certain factors are boosting the sales of the high purity alumina market.

The high purity alumina market research report delivers an acute valuation and taxonomy of the high purity alumina industry by practically splitting the market on the basis of different types, applications, and regions. Through the analysis of the historical and projected trends, all the segments and sub-segments were evaluated through the bottom-up approach, and different market sizes have been projected for FY 2020 to FY 2026. The regional segmentation of the high purity alumina industry includes the complete classification of all the major continents including North America, Latin America, Europe, Asia Pacific, and Middle East & Africa. Further, country-wise data for the high purity alumina industry is provided for the leading economies of the world.

The high purity alumina market is segmented based on type and application.  On the basis of type segmentation, the market is classified into 4N, 5N, and 6N. In terms of application segmentation, the market is bifurcated into the electronic industry, chemical industry, and high purity alloy among others.

logoCompetitive Players

Some of the essential players operating in the high purity alumina market, but not restricted to include :

  • Joinworld
  •  Hydro
  •  Showa Denko
  •  Zibo Xinfumeng Chemicals Co.  Ltd
  •  Kyushu Mitsui Aluminum
  •  BAIKOWSKI
  •  Sasol
  •  Rusal
  •  Sumitomo
  •  XUancheng jingrui New Material Co. Ltd
  •  C-KOE Metals
  •  Nippon Light Metal
  •  Columbia Specialty Metals

The taxonomy of the high purity alumina industry by its scope and segmentation is as follows:

logo By Type Segmentation Analysis

  • 4N
  • 5N
  • 6N

logo By Application Segmentation Analysis

  • Electronic Industry
  • Chemical Industry
  • High Purity Alloy
  • Others

logoGlobal High Purity Aluminum Market: Regional Segmentation Analysis

  • North America
    • The U.S.
    • Canada
  • Europe
    • Germany
    • The UK
    • France
    • Spain
    • Italy
    • Rest of Europe
  • Asia Pacific
    • China
    • Japan
    • India
    • South Korea
    • Southeast Asia
    • Rest of Asia Pacific
  • Latin America
    • Brazil
    • Mexico
    • Rest of Latin America
  • Middle East & Africa
    • GCC
    • South Africa
    • Rest of Middle East & Africa

Table of Content

  1. CHAPTER 1. Executive Summary
  2. CHAPTER 2. High Purity Aluminum market – Type Analysis
    1. 2.1. Global High Purity Aluminum Market – Type Overview
    2. 2.2. Global High Purity Aluminum Market Share, by Type, 2018 & 2025 (USD Million)
    3. 2.3. Global High Purity Aluminum Market share, by Type, 2018 & 2025 (Kilo Tons)
    4. 2.4. 4N
      1. 2.4.1. Global 4N High Purity Aluminum Market, 2016-2026 (USD Million)
      2. 2.4.2. Global 4N High Purity Aluminum Market, 2016-2026 (Kilo Tons)
    5. 2.5. 5N
      1. 2.5.1. Global 5N High Purity Aluminum Market, 2016-2026 (USD Million)
      2. 2.5.2. Global 5N High Purity Aluminum Market, 2016-2026 (Kilo Tons)
    6. 2.6. 6N
      1. 2.6.1. Global 6N High Purity Aluminum Market, 2016-2026 (USD Million)
      2. 2.6.2. Global 6N High Purity Aluminum Market, 2016-2026 (Kilo Tons)
  3. CHAPTER 3. High Purity Aluminum market – Application Analysis
    1. 3.1. Global High Purity Aluminum Market – Application Overview
    2. 3.2. Global High Purity Aluminum Market Share, by Application, 2018 & 2025 (USD Million)
    3. 3.3. Global High Purity Aluminum Market share, by Application, 2018 & 2025 (Kilo Tons)
    4. 3.4. Electronic Industry
      1. 3.4.1. Global Electronic Industry High Purity Aluminum Market, 2016-2026 (USD Million)
      2. 3.4.2. Global Electronic Industry High Purity Aluminum Market, 2016-2026 (Kilo Tons)
    5. 3.5. Chemical Industry
      1. 3.5.1. Global Chemical Industry High Purity Aluminum Market, 2016-2026 (USD Million)
      2. 3.5.2. Global Chemical Industry High Purity Aluminum Market, 2016-2026 (Kilo Tons)
    6. 3.6. High Purity Alloy
      1. 3.6.1. Global High Purity Alloy High Purity Aluminum Market, 2016-2026 (USD Million)
      2. 3.6.2. Global High Purity Alloy High Purity Aluminum Market, 2016-2026 (Kilo Tons)
    7. 3.7. Others
      1. 3.7.1. Global Others High Purity Aluminum Market, 2016-2026 (USD Million)
      2. 3.7.2. Global Others High Purity Aluminum Market, 2016-2026 (Kilo Tons)
  4. CHAPTER 4. High Purity Aluminum market – Regional Analysis
    1. 4.1. Global High Purity Aluminum Market Regional Overview
    2. 4.2. Global High Purity Aluminum Market Share, by Region, 2018 & 2025 (Value)
    3. 4.3. Global High Purity Aluminum Market Share, by Region, 2018 & 2025 (Volume)
    4. 4.4. North America
      1. 4.4.1. North America High Purity Aluminum Market size and forecast, 2016-2026
      2. 4.4.2. North America High Purity Aluminum Market, by Country, 2018 - 2025 (USD Million)
      3. 4.4.3. North America Market size and forecast, 2016-2026 (Kilo Tons)
      4. 4.4.4. North America High Purity Aluminum Market, by Country, 2018 - 2025 (Kilo Tons)
      5. 4.4.5. North America High Purity Aluminum Market, by Type, 2016-2026
        1. 4.4.5.1. North America High Purity Aluminum Market, by Type, 2016-2026 (USD Million)
        2. 4.4.5.2. North America High Purity Aluminum Market, by Type, 2016-2026 (Kilo Tons)
      6. 4.4.6. North America High Purity Aluminum Market, by Application, 2016-2026
        1. 4.4.6.1. North America High Purity Aluminum Market, by Application, 2016-2026 (USD Million)
        2. 4.4.6.2. North America High Purity Aluminum Market, by Application, 2016-2026 (Kilo Tons)
      7. 4.4.7. U.S.
        1. 4.4.7.1. U.S. Market size and forecast, 2016-2026 (USD Million)
        2. 4.4.7.2. U.S. Market size and forecast, 2016-2026 (Kilo Tons)
      8. 4.4.8. Canada
        1. 4.4.8.1. Canada Market size and forecast, 2016-2026 (USD Million)
        2. 4.4.8.2. Canada Market size and forecast, 2016-2026 (Kilo Tons)
    5. 4.5. Europe
      1. 4.5.1. Europe High Purity Aluminum Market size and forecast, 2016-2026
      2. 4.5.2. Europe High Purity Aluminum Market, by Country, 2018 - 2025 (USD Million)
      3. 4.5.3. Europe Market size and forecast, 2016-2026 (Kilo Tons)
      4. 4.5.4. Europe High Purity Aluminum Market, by Country, 2018 - 2025 (Kilo Tons)
      5. 4.5.5. Europe High Purity Aluminum Market, by Type, 2016-2026
        1. 4.5.5.1. Europe High Purity Aluminum Market, by Type, 2016-2026 (USD Million)
        2. 4.5.5.2. Europe High Purity Aluminum Market, by Type, 2016-2026 (Kilo Tons)
      6. 4.5.6. Europe High Purity Aluminum Market, by Application, 2016-2026
        1. 4.5.6.1. Europe High Purity Aluminum Market, by Application, 2016-2026 (USD Million)
        2. 4.5.6.2. Europe High Purity Aluminum Market, by Application, 2016-2026 (Kilo Tons)
      7. 4.5.7. Germany
        1. 4.5.7.1. Germany Market size and forecast, 2016-2026 (USD Million)
        2. 4.5.7.2. Germany Market size and forecast, 2016-2026 (Kilo Tons)
      8. 4.5.8. France
        1. 4.5.8.1. France Market size and forecast, 2016-2026 (USD Million)
        2. 4.5.8.2. France Market size and forecast, 2016-2026 (Kilo Tons)
      9. 4.5.9. U.K.
        1. 4.5.9.1. U.K. Market size and forecast, 2016-2026 (USD Million)
        2. 4.5.9.2. U.K. Market size and forecast, 2016-2026 (Kilo Tons)
      10. 4.5.10. Italy
        1. 4.5.10.1. Italy Market size and forecast, 2016-2026 (USD Million)
        2. 4.5.10.2. Italy Market size and forecast, 2016-2026 (Kilo Tons)
      11. 4.5.11. Spain
        1. 4.5.11.1. Spain Market size and forecast, 2016-2026 (USD Million)
        2. 4.5.11.2. Spain Market size and forecast, 2016-2026 (Kilo Tons)
      12. 4.5.12. Rest of Europe
        1. 4.5.12.1. Rest of Europe Market size and forecast, 2016-2026 (USD Million)
        2. 4.5.12.2. Rest of Europe Market size and forecast, 2016-2026 (Kilo Tons)
    6. 4.6. Asia Pacific
      1. 4.6.1. Asia Pacific High Purity Aluminum Market size and forecast, 2016-2026
      2. 4.6.2. Asia Pacific High Purity Aluminum Market, by Country, 2018 - 2025 (USD Million)
      3. 4.6.3. Asia Pacific Market size and forecast, 2016-2026 (Kilo Tons)
      4. 4.6.4. Asia Pacific High Purity Aluminum Market, by Country, 2018 - 2025 (Kilo Tons)
      5. 4.6.5. Asia Pacific High Purity Aluminum Market, by Type, 2016-2026
        1. 4.6.5.1. Asia Pacific High Purity Aluminum Market, by Type, 2016-2026 (USD Million)
        2. 4.6.5.2. Asia Pacific High Purity Aluminum Market, by Type, 2016-2026 (Kilo Tons)
      6. 4.6.6. Asia Pacific High Purity Aluminum Market, by Application, 2016-2026
        1. 4.6.6.1. Asia Pacific High Purity Aluminum Market, by Application, 2016-2026 (USD Million)
        2. 4.6.6.2. Asia Pacific High Purity Aluminum Market, by Application, 2016-2026 (Kilo Tons)
      7. 4.6.7. China
        1. 4.6.7.1. China Market size and forecast, 2016-2026 (USD Million)
        2. 4.6.7.2. China Market size and forecast, 2016-2026 (Kilo Tons)
      8. 4.6.8. Japan
        1. 4.6.8.1. Japan Market size and forecast, 2016-2026 (USD Million)
        2. 4.6.8.2. Japan Market size and forecast, 2016-2026 (Kilo Tons)
      9. 4.6.9. India
        1. 4.6.9.1. India Market size and forecast, 2016-2026 (USD Million)
        2. 4.6.9.2. India Market size and forecast, 2016-2026 (Kilo Tons)
      10. 4.6.10. South Korea
        1. 4.6.10.1. South Korea Market size and forecast, 2016-2026 (USD Million)
        2. 4.6.10.2. South Korea Market size and forecast, 2016-2026 (Kilo Tons)
      11. 4.6.11. South-East Asia
        1. 4.6.11.1. South-East Asia Market size and forecast, 2016-2026 (USD Million)
        2. 4.6.11.2. South-East Asia Market size and forecast, 2016-2026 (Kilo Tons)
      12. 4.6.12. Rest of Asia Pacific
        1. 4.6.12.1. Rest of Asia Pacific Market size and forecast, 2016-2026 (USD Million)
        2. 4.6.12.2. Rest of Asia Pacific Market size and forecast, 2016-2026 (Kilo Tons)
    7. 4.7. Latin America
      1. 4.7.1. Latin America High Purity Aluminum Market size and forecast, 2016-2026
      2. 4.7.2. Latin America High Purity Aluminum Market, by Country, 2018 - 2025 (USD Million)
      3. 4.7.3. Latin America Market size and forecast, 2016-2026 (Kilo Tons)
      4. 4.7.4. Latin America High Purity Aluminum Market, by Country, 2018 - 2025 (Kilo Tons)
      5. 4.7.5. Latin America High Purity Aluminum Market, by Type, 2016-2026
        1. 4.7.5.1. Latin America High Purity Aluminum Market, by Type, 2016-2026 (USD Million)
        2. 4.7.5.2. Latin America High Purity Aluminum Market, by Type, 2016-2026 (Kilo Tons)
      6. 4.7.6. Latin America High Purity Aluminum Market, by Application, 2016-2026
        1. 4.7.6.1. Latin America High Purity Aluminum Market, by Application, 2016-2026 (USD Million)
        2. 4.7.6.2. Latin America High Purity Aluminum Market, by Application, 2016-2026 (Kilo Tons)
      7. 4.7.7. Brazil
        1. 4.7.7.1. Brazil Market size and forecast, 2016-2026 (USD Million)
        2. 4.7.7.2. Brazil Market size and forecast, 2016-2026 (Kilo Tons)
      8. 4.7.8. Mexico
        1. 4.7.8.1. Mexico Market size and forecast, 2016-2026 (USD Million)
        2. 4.7.8.2. Mexico Market size and forecast, 2016-2026 (Kilo Tons)
      9. 4.7.9. Rest of Latin America
        1. 4.7.9.1. Rest of Latin America Market size and forecast, 2016-2026 (USD Million)
        2. 4.7.9.2. Rest of Latin America Market size and forecast, 2016-2026 (Kilo Tons)
    8. 4.8. The Middle-East and Africa
      1. 4.8.1. The Middle-East and Africa High Purity Aluminum Market size and forecast, 2016-2026
      2. 4.8.2. The Middle-East and Africa High Purity Aluminum Market, by Country, 2018 - 2025 (USD Million)
      3. 4.8.3. The Middle-East and Africa Market size and forecast, 2016-2026 (Kilo Tons)
      4. 4.8.4. The Middle-East and Africa High Purity Aluminum Market, by Country, 2018 - 2025 (Kilo Tons)
      5. 4.8.5. The Middle-East and Africa High Purity Aluminum Market, by Type, 2016-2026
        1. 4.8.5.1. The Middle-East and Africa High Purity Aluminum Market, by Type, 2016-2026 (USD Million)
        2. 4.8.5.2. The Middle-East and Africa High Purity Aluminum Market, by Type, 2016-2026 (Kilo Tons)
      6. 4.8.6. The Middle-East and Africa High Purity Aluminum Market, by Application, 2016-2026
        1. 4.8.6.1. The Middle-East and Africa High Purity Aluminum Market, by Application, 2016-2026 (USD Million)
        2. 4.8.6.2. The Middle-East and Africa High Purity Aluminum Market, by Application, 2016-2026 (Kilo Tons)
      7. 4.8.7. GCC Countries
        1. 4.8.7.1. GCC Countries Market size and forecast, 2016-2026 (USD Million)
        2. 4.8.7.2. GCC Countries Market size and forecast, 2016-2026 (Kilo Tons)
      8. 4.8.8. South Africa
        1. 4.8.8.1. South Africa Market size and forecast, 2016-2026 (USD Million)
        2. 4.8.8.2. South Africa Market size and forecast, 2016-2026 (Kilo Tons)
      9. 4.8.9. Rest of Middle-East Africa
        1. 4.8.9.1. Rest of Middle-East Africa Market size and forecast, 2016-2026 (USD Million)
        2. 4.8.9.2. Rest of Middle-East Africa Market size and forecast, 2016-2026 (Kilo Tons)
  5. CHAPTER 5. High Purity Aluminum Production, Consumption, Export, Import by Regions
    1. 5.1. Global High Purity Aluminum production and revenue, 2015-2025 (USD Million) (Kilo Tons)
    2. 5.2. Global Import and Export Analysis, by Region
  6. CHAPTER 6. High Purity Aluminum market – Competitive Landscape
    1. 6.1. Competitor Market Share – Revenue
    2. 6.2. Market Concentration Rate Analysis, Top 3 and Top 5 Players
    3. 6.3. Competitor Market Share – Volume
    4. 6.4. Strategic Development
      1. 6.4.1. Acquisitions and Mergers
      2. 6.4.2. New Products
      3. 6.4.3. Research & Development Activities
  7. CHAPTER 7. Company Profiles
    1. 7.1. Joinworld
      1. 7.1.1. Company Overview
      2. 7.1.2. Joinworld Sales, Revenue, Price, and Gross Margin
      3. 7.1.3. Product portfolio
      4. 7.1.4. Recent initiatives
    2. 7.2. Hydro
      1. 7.2.1. Company Overview
      2. 7.2.2. Hydro Sales, Revenue, Price, and Gross Margin
      3. 7.2.3. Product portfolio
      4. 7.2.4. Recent initiatives
    3. 7.3. Showa Denko
      1. 7.3.1. Company Overview
      2. 7.3.2. Showa Denko Sales, Revenue, Price, and Gross Margin
      3. 7.3.3. Product portfolio
      4. 7.3.4. Recent initiatives
    4. 7.4. Zibo Xinfumeng Chemicals Co., Ltd
      1. 7.4.1. Company Overview
      2. 7.4.2. Zibo Xinfumeng Chemicals Co., Ltd Sales, Revenue, Price, and Gross Margin
      3. 7.4.3. Product portfolio
      4. 7.4.4. Recent initiatives
    5. 7.5. Kyushu Mitsui Aluminum
      1. 7.5.1. Company Overview
      2. 7.5.2. Kyushu Mitsui Aluminum Sales, Revenue, Price, and Gross Margin
      3. 7.5.3. Product portfolio
      4. 7.5.4. Recent initiatives
    6. 7.6. BAIKOWSKI
      1. 7.6.1. Company Overview
      2. 7.6.2. BAIKOWSKI Sales, Revenue, Price, and Gross Margin
      3. 7.6.3. Product portfolio
      4. 7.6.4. Recent initiatives
    7. 7.7. Sasol
      1. 7.7.1. Company Overview
      2. 7.7.2. Sasol Sales, Revenue, Price, and Gross Margin
      3. 7.7.3. Product portfolio
      4. 7.7.4. Recent initiatives
    8. 7.8. Rusal
      1. 7.8.1. Company Overview
      2. 7.8.2. Rusal Sales, Revenue, Price, and Gross Margin
      3. 7.8.3. Product portfolio
      4. 7.8.4. Recent initiatives
    9. 7.9. Sumitomo
      1. 7.9.1. Company Overview
      2. 7.9.2. Sumitomo Sales, Revenue, Price, and Gross Margin
      3. 7.9.3. Product portfolio
      4. 7.9.4. Recent initiatives
    10. 7.10. XUancheng jingrui New MAterial Co. Ltd
      1. 7.10.1. Company Overview
      2. 7.10.2. XUancheng jingrui New MAterial Co. Ltd Sales, Revenue, Price, and Gross Margin
      3. 7.10.3. Product portfolio
      4. 7.10.4. Recent initiatives
  8. CHAPTER 8. High Purity Aluminum — Industry Analysis
    1. 8.1. Introduction and Taxonomy
    2. 8.2. High Purity Aluminum Market – Key Trends
      1. 8.2.1. Market Drivers
      2. 8.2.2. Market Restraints
      3. 8.2.3. Market Opportunities
    3. 8.3. Value Chain Analysis
    4. 8.4. Key Mandates and Regulations
    5. 8.5. Technology Roadmap and Timeline
    6. 8.6. High Purity Aluminum market – Attractiveness Analysis
      1. 8.6.1. By Type
      2. 8.6.2. By Application
      3. 8.6.3. By Region
  9. CHAPTER 9. Raw Material analysis
    1. 9.1. High Purity Aluminum Key Raw Material Analysis
      1. 9.1.1. Key Raw Materials
      2. 9.1.2. Price Trend of Key Raw Materials
    2. 9.2. Key Suppliers of Raw Materials
    3. 9.3. Proportion of Manufacturing Cost Structure
      1. 9.3.1. Raw Materials
      2. 9.3.2. Labor Cost
    4. 9.4. Manufacturing Expenses Analysis of High Purity Aluminum
  10. CHAPTER 10. Industrial Chain, Sourcing Strategy and Downstream Buyers
    1. 10.1. High Purity Aluminum Industrial Chain Analysis
    2. 10.2. Upstream Raw Materials Sourcing
      1. 10.2.1. Risk Mitigation:
      2. 10.2.2. Supplier Relationships:
      3. 10.2.3. Business Processes:
      4. 10.2.4. Securing the Product:
    3. 10.3. Raw Materials Sources of High Purity Aluminum Major Manufacturers in 2016
    4. 10.4. Downstream Buyers
    5. 10.5. Distributors/Traders List
  11. CHAPTER 11. Marketing Strategy Analysis, Distributors
    1. 11.1. Marketing Channel
    2. 11.2. Direct Marketing
    3. 11.3. Indirect Marketing
    4. 11.4. Marketing Channel Development Trend
    5. 11.5. Economic/Political Environmental Change
  12. CHAPTER 12. Report Conclusion
  13. CHAPTER 13. Research Approach & Methodology
    1. 13.1. Report Description
    2. 13.2. Research Scope
    3. 13.3. Research Methodology
      1. 13.3.1. Secondary Research
      2. 13.3.2. Primary Research
      3. 13.3.3. Models
        1. 13.3.3.1. Company Share Analysis Model
        2. 13.3.3.2. Revenue Based Modeling
        3. 13.3.3.3. Research Limitations

        List of Figures

        FIG. 1 Global High Purity Aluminum Market, 2016-2026 (USD Million)
        FIG. 2 Global High Purity Aluminum Market Share, by Type, 2018 & 2025 (USD Million)
        FIG. 3 Global High Purity Aluminum Market share, by Type, 2018 & 2025 (Kilo Tons)
        FIG. 4 Global 4N High Purity Aluminum Market, 2016-2026 (USD Million)
        FIG. 5 Global 4N High Purity Aluminum  Market, 2016-2026 (Kilo Tons)
        FIG. 6 Global 5N High Purity Aluminum Market, 2016-2026 (USD Million)
        FIG. 7 Global 5N High Purity Aluminum  Market, 2016-2026 (Kilo Tons)
        FIG. 8 Global 6N High Purity Aluminum Market, 2016-2026 (USD Million)
        FIG. 9 Global 6N High Purity Aluminum  Market, 2016-2026 (Kilo Tons)
        FIG. 10 Global High Purity Aluminum Market Share, by Application, 2018 & 2025 (USD Million)
        FIG. 11 Global High Purity Aluminum Market share, by Application, 2018 & 2025 (Kilo Tons)
        FIG. 12 Global Electronic Industry High Purity Aluminum Market, 2016-2026 (USD Million)
        FIG. 13 Global Electronic Industry High Purity Aluminum  Market, 2016-2026 (Kilo Tons)
        FIG. 14 Global Chemical Industry High Purity Aluminum Market, 2016-2026 (USD Million)
        FIG. 15 Global Chemical Industry High Purity Aluminum  Market, 2016-2026 (Kilo Tons)
        FIG. 16 Global High Purity Alloy High Purity Aluminum Market, 2016-2026 (USD Million)
        FIG. 17 Global High Purity Alloy High Purity Aluminum  Market, 2016-2026 (Kilo Tons)
        FIG. 18 Global Others High Purity Aluminum Market, 2016-2026 (USD Million)
        FIG. 19 Global Others High Purity Aluminum  Market, 2016-2026 (Kilo Tons)
        FIG. 20 Global High Purity Aluminum Market Share, by Region, 2018 & 2025
        FIG. 21 Global High Purity Aluminum Market Share, by Region, 2018 & 2025
        FIG. 22 North America High Purity Aluminum Market, 2016-2026
        FIG. 23 North America High Purity Aluminum  Market, 2016-2026 (Kilo Tons)
        FIG. 24 U.S. High Purity Aluminum Market, 2016-2026
        FIG. 25 U.S. High Purity Aluminum  Market, 2016-2026 (Kilo Tons)
        FIG. 26 Canada High Purity Aluminum Market, 2016-2026
        FIG. 27 Canada High Purity Aluminum  Market, 2016-2026 (Kilo Tons)
        FIG. 28 Europe High Purity Aluminum Market, 2016-2026
        FIG. 29 Europe High Purity Aluminum  Market, 2016-2026 (Kilo Tons)
        FIG. 30 Germany High Purity Aluminum Market, 2016-2026
        FIG. 31 Germany High Purity Aluminum  Market, 2016-2026 (Kilo Tons)
        FIG. 32 France High Purity Aluminum Market, 2016-2026
        FIG. 33 France High Purity Aluminum  Market, 2016-2026 (Kilo Tons)
        FIG. 34 U.K. High Purity Aluminum Market, 2016-2026
        FIG. 35 U.K. High Purity Aluminum  Market, 2016-2026 (Kilo Tons)
        FIG. 36 Italy High Purity Aluminum Market, 2016-2026
        FIG. 37 Italy High Purity Aluminum  Market, 2016-2026 (Kilo Tons)
        FIG. 38 Spain High Purity Aluminum Market, 2016-2026
        FIG. 39 Spain High Purity Aluminum  Market, 2016-2026 (Kilo Tons)
        FIG. 40 Rest of Europe High Purity Aluminum Market, 2016-2026
        FIG. 41 Rest of Europe High Purity Aluminum  Market, 2016-2026 (Kilo Tons)
        FIG. 42 Asia Pacific High Purity Aluminum Market, 2016-2026
        FIG. 43 Asia Pacific High Purity Aluminum  Market, 2016-2026 (Kilo Tons)
        FIG. 44 China High Purity Aluminum Market, 2016-2026
        FIG. 45 China High Purity Aluminum  Market, 2016-2026 (Kilo Tons)
        FIG. 46 Japan High Purity Aluminum Market, 2016-2026
        FIG. 47 Japan High Purity Aluminum  Market, 2016-2026 (Kilo Tons)
        FIG. 48 India High Purity Aluminum Market, 2016-2026
        FIG. 49 India High Purity Aluminum  Market, 2016-2026 (Kilo Tons)
        FIG. 50 South  Korea High Purity Aluminum Market, 2016-2026
        FIG. 51 South  Korea High Purity Aluminum  Market, 2016-2026 (Kilo Tons)
        FIG. 52 South-East Asia High Purity Aluminum Market, 2016-2026
        FIG. 53 South-East Asia High Purity Aluminum  Market, 2016-2026 (Kilo Tons)
        FIG. 54 Rest of Asia Pacific High Purity Aluminum Market, 2016-2026
        FIG. 55 Rest of Asia Pacific High Purity Aluminum  Market, 2016-2026 (Kilo Tons)
        FIG. 56 Latin America High Purity Aluminum Market, 2016-2026
        FIG. 57 Latin America High Purity Aluminum  Market, 2016-2026 (Kilo Tons)
        FIG. 58 Brazil High Purity Aluminum Market, 2016-2026
        FIG. 59 Brazil High Purity Aluminum  Market, 2016-2026 (Kilo Tons)
        FIG. 60 Mexico High Purity Aluminum Market, 2016-2026
        FIG. 61 Mexico High Purity Aluminum  Market, 2016-2026 (Kilo Tons)
        FIG. 62 Rest of Latin America High Purity Aluminum Market, 2016-2026
        FIG. 63 Rest of Latin America High Purity Aluminum  Market, 2016-2026 (Kilo Tons)
        FIG. 64 The Middle-East and Africa High Purity Aluminum Market, 2016-2026
        FIG. 65 The Middle-East and Africa High Purity Aluminum  Market, 2016-2026 (Kilo Tons)
        FIG. 66 GCC Countries High Purity Aluminum Market, 2016-2026
        FIG. 67 GCC Countries High Purity Aluminum  Market, 2016-2026 (Kilo Tons)
        FIG. 68 South Africa High Purity Aluminum Market, 2016-2026
        FIG. 69 South Africa High Purity Aluminum  Market, 2016-2026 (Kilo Tons)
        FIG. 70 Rest of Middle-East Africa High Purity Aluminum Market, 2016-2026
        FIG. 71 Rest of Middle-East Africa High Purity Aluminum  Market, 2016-2026 (Kilo Tons)
        FIG. 72 Global High Purity Aluminum production and revenue, 2015-2025 (USD Million) (Kilo Tons)
        FIG. 73 North America High Purity Aluminum production and revenue, 2015-2025 (USD Million) (Kilo Tons)
        FIG. 74 Europe High Purity Aluminum production and revenue, 2015-2025 (USD Million) (Kilo Tons)
        FIG. 75 Asia Pacific High Purity Aluminum production and revenue, 2015-2025 (USD Million) (Kilo Tons)
        FIG. 76 Latin America High Purity Aluminum production and revenue, 2015-2025 (USD Million) (Kilo Tons)
        FIG. 77 Middle East and Africa High Purity Aluminum production and revenue, 2015-2025 (USD Million) (Kilo Tons)
        FIG. 78 Competitor Market Share – Revenue
        FIG. 79 Competitor Market Share – Volume
        FIG. 80 Joinworld Revenue and Growth Rate
        FIG. 81 Joinworld Market Share
        FIG. 82 Hydro Revenue and Growth Rate
        FIG. 83 Hydro Market Share
        FIG. 84 Showa Denko Revenue and Growth Rate
        FIG. 85 Showa Denko Market Share
        FIG. 86 Zibo Xinfumeng Chemicals Co., Ltd Revenue and Growth Rate
        FIG. 87 Zibo Xinfumeng Chemicals Co., Ltd Market Share
        FIG. 88 Kyushu Mitsui Aluminum Revenue and Growth Rate
        FIG. 89 Kyushu Mitsui Aluminum Market Share
        FIG. 90 BAIKOWSKI Revenue and Growth Rate
        FIG. 91 BAIKOWSKI Market Share
        FIG. 92 Sasol Revenue and Growth Rate
        FIG. 93 Sasol Market Share
        FIG. 94 Rusal Revenue and Growth Rate
        FIG. 95 Rusal Market Share
        FIG. 96 Sumitomo Revenue and Growth Rate
        FIG. 97 Sumitomo Market Share
        FIG. 98 XUancheng jingrui New MAterial Co. Ltd Revenue and Growth Rate
        FIG. 99 XUancheng jingrui New MAterial Co. Ltd Market Share
        FIG. 100 Market Dynamics
        FIG. 101 Global High Purity Aluminum – Value Chain Analysis
        FIG. 102 Key Mandates and Regulations
        FIG. 103 Technology Roadmap and Timeline
        FIG. 104 Market Attractiveness Analysis – By Type
        FIG. 105 Market Attractiveness Analysis – By Application
        FIG. 106 Market Attractiveness Analysis – By Region
        FIG. 107 Manufacturing Cost Structure of High Purity Aluminum
        FIG. 108 High Purity Aluminum Industrial Chain Analysis
        FIG. 109 Market Channel
        FIG. 110 Marketing Channel Development Trend
        FIG. 111 Growth in World Gross Product, 2008-2018

        List of Tables

        TABLE 1 Global High Purity Aluminum market, 2018 & 2025 (USD Million)
        TABLE 2 Global High Purity Aluminum market, by Type, 2016-2026 (USD Million)
        TABLE 3 Global High Purity Aluminum market, by Type, 2016-2026 (Kilo Tons)
        TABLE 4 Global High Purity Aluminum market, by Application, 2016-2026 (USD Million)
        TABLE 5 Global High Purity Aluminum market, by Application, 2016-2026 (Kilo Tons)
        TABLE 6 Global High Purity Aluminum market, by region, 2016-2026 (USD Million)
        TABLE 7 Global High Purity Aluminum market, by region, 2016-2026 (Kilo Tons)
        TABLE 8 North America High Purity Aluminum Market, by Type, 2016-2026 (USD Million)
        TABLE 9 North America High Purity Aluminum Market, by Type, 2016-2026 (Kilo Tons)
        TABLE 10 North America High Purity Aluminum Market, by Application, 2016-2026 (USD Million)
        TABLE 11 North America High Purity Aluminum Market, by Application, 2016-2026 (Kilo Tons)
        TABLE 12 Europe High Purity Aluminum Market, by Type, 2016-2026 (USD Million)
        TABLE 13 Europe High Purity Aluminum Market, by Type, 2016-2026 (Kilo Tons)
        TABLE 14 Europe High Purity Aluminum Market, by Application, 2016-2026 (USD Million)
        TABLE 15 Europe High Purity Aluminum Market, by Application, 2016-2026 (Kilo Tons)
        TABLE 16 Asia Pacific High Purity Aluminum Market, by Type, 2016-2026 (USD Million)
        TABLE 17 Asia Pacific High Purity Aluminum Market, by Type, 2016-2026 (Kilo Tons)
        TABLE 18 Asia Pacific High Purity Aluminum Market, by Application, 2016-2026 (USD Million)
        TABLE 19 Asia Pacific High Purity Aluminum Market, by Application, 2016-2026 (Kilo Tons)
        TABLE 20 Latin America High Purity Aluminum Market, by Type, 2016-2026 (USD Million)
        TABLE 21 Latin America High Purity Aluminum Market, by Type, 2016-2026 (Kilo Tons)
        TABLE 22 Latin America High Purity Aluminum Market, by Application, 2016-2026 (USD Million)
        TABLE 23 Latin America High Purity Aluminum Market, by Application, 2016-2026 (Kilo Tons)
        TABLE 24 The Middle-East and Africa High Purity Aluminum Market, by Type, 2016-2026 (USD Million)
        TABLE 25 The Middle-East and Africa High Purity Aluminum Market, by Type, 2016-2026 (Kilo Tons)
        TABLE 26 The Middle-East and Africa High Purity Aluminum Market, by Application, 2016-2026 (USD Million)
        TABLE 27 The Middle-East and Africa High Purity Aluminum Market, by Application, 2016-2026 (Kilo Tons)
        TABLE 28 North America High Purity Aluminum Production, Consumption, Export, Import, 2016-2019
        TABLE 29 Europe High Purity Aluminum Production, Consumption, Export, Import, 2016-2019
        TABLE 30 Asia Pacific High Purity Aluminum Production, Consumption, Export, Import, 2016-2019
        TABLE 31 Latin America High Purity Aluminum Production, Consumption, Export, Import, 2016-2019
        TABLE 32 Middle East & Africa High Purity Aluminum Production, Consumption, Export, Import, 2016-2019
        TABLE 33 Global High Purity Aluminum Market - Company Revenue Analysis 2016-2019 (USD Million)
        TABLE 34 Global High Purity Aluminum Market - Company Revenue Share Analysis 2016-2019(%)
        TABLE 35 Global High Purity Aluminum Market - Company Volume Analysis 2016-2019 (Kilo Tons)
        TABLE 36 Global High Purity Aluminum Market - Company Volume Share Analysis 2016-2019(%)
        TABLE 37 Acquisitions and Mergers
        TABLE 38 New Product/Service Launch
        TABLE 39 Research & Development Activities
        TABLE 40 Market Drivers
        TABLE 41 Market Restraints
        TABLE 42 Market Opportunities
        TABLE 43 Production Base and Market Concentration Rate of Raw Material
        TABLE 44 Key Suppliers of Raw Materials
        TABLE 45 Raw Materials Sources of High Purity Aluminum Major Manufacturers in 2016
        TABLE 46 Major Buyers of High Purity Aluminum
        TABLE 47 Distributors/Traders of High Purity Aluminum by Region

Industry Major Market Players

  • Joinworld
  •  Hydro
  •  Showa Denko
  •  Zibo Xinfumeng Chemicals Co.  Ltd
  •  Kyushu Mitsui Aluminum
  •  BAIKOWSKI
  •  Sasol
  •  Rusal
  •  Sumitomo
  •  XUancheng jingrui New Material Co. Ltd
  •  C-KOE Metals
  •  Nippon Light Metal
  •  Columbia Specialty Metals