Search Market Research Report

Discover Our Latest Reports
Discover Our Featured Reports
Discover Top Selling Reports

Handheld X-Ray Fluorescence Spectrometer Market Size, Share Global Analysis Report, , 2021 – 2026

report img

Handheld X-Ray Fluorescence Spectrometer Market By Product Types (Wavelength Dispersion, and Energy Dispersion), By End-User (Mining Industry, Cement Industry, Petroleum Industry, Metallurgical Industry, and Others): Global & Regional Industry Perspective, Comprehensive Analysis, and Forecast, 2021 – 2026

Industry Insights

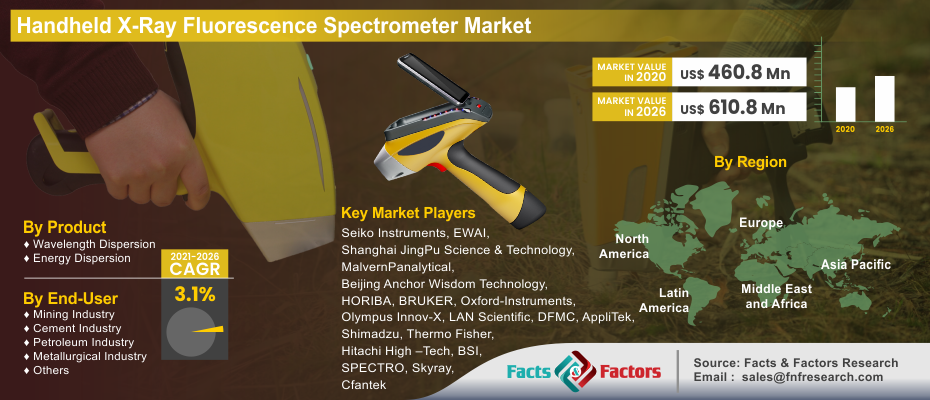
[178+ Pages Report] According to the report published by the Facts & Factors, the global handheld X-ray fluorescence spectrometer market was estimated at approximately USD 460.8 Million in 2020 and is expected to generate revenue of around USD 610.8 Million by the end of 2026, growing at a CAGR of around 3.1% between 2021 and 2026.

logoMarket Overview

X-ray fluorescence (XRF) is an analytical technique that is used to determine the chemical composition of a broad range of sample types that includes solids, liquids, slurries, and loose powders. These spectrometers are divided into two types that are fixed X-ray spectrometer and portable X-ray spectrometer. X-ray fluorescence is also used to determine the thickness and composition of layers and coatings. It can analyze the elements from beryllium (Be) to uranium (U) in concentration ranges from 100 wt% to sub-ppm levels.

 By Product Types (Wavelength Dispersion,

To know more about this report | Request Free Sample Copy

logoIndustry Growth Factor

Rising demand for precision diagnostics, rapid expansion in the global disease burden and increase in the demand for better quality control options, and advancements in diagnostic technologies are some major factors driving the global handheld X-ray fluorescence spectrometer market. Moreover, the increasing utilization of X-ray fluorescence spectrometers in tablet grouping processes to check out the contaminants externally and internally is likely to enhance the demand for X-ray fluorescence spectrometers worldwide during the forecast period. In addition, the ease of use, compacted size of these spectrometers, and continuous monitoring offered by them are some other factors propelling the global handheld X-ray fluorescence spectrometers market. The growing benefits of safe rapid multi-element analysis and easy sample preparations are also boosting the growth of the handheld X-ray fluorescence spectrometer market.

logoThe industry payers from the X-ray spectrometer market are likely to generate growth opportunities in the upcoming years with the rising demand for customized procedure trays in the global market across the globe.

The rising high initial cost of equipment and calibration is likely to hamper the X-ray fluorescence spectrometer market growth. Also, the engagement of healthcare professionals in the management of COVID-19 hindered the requirement for an X-ray spectrometer. Besides, the government worldwide ban on elective surgical and diagnostic procedure disruption in the supply chain coupled with shutting down of manufacturing facilities also impeded the market growth of handhelds X-ray fluorescence spectrometer.

logoSegmentation Analysis

The global handheld X-ray fluorescence spectrometer market has been classified into the type of product and end-user. Based on the product types, the global handheld X-ray fluorescence spectrometer market has been segmented into wavelength dispersion and energy dispersion. The global handheld X-ray fluorescence spectrometer market based on the end-user industry has been divided into the mining industry, cement industry, petroleum industry, metallurgical industry, and others.

logo Regional Analysis

The geographical split of the handheld X-ray fluorescence spectrometer market comprises North America, Europe, Asia-Pacific, the Middle East, and Africa, and Latin America. In terms of revenue, North America is leading the handheld X-ray fluorescence spectrometer market due to the existence of better health care infrastructure, high adoption of X-ray fluorescence spectrometers, and favorable reimbursement development in the region.

Furthermore, the European region is expected to observe quick growth in the future because of the growing affordability of health care services, high awareness regarding technological advancements, and increasing expenditure on these services. Also, the Asia-Pacific is projected for the largest market growth in the future due to the increasing number of health care research, growing awareness about innovative quality control techniques, and development programs, and growing interest of the foreign investor in the region.

logoReport Scope

Report Attribute

Details

Market Size in 2020

USD 460.8 Million

Projected Market Size in 2026

USD 610.8 Million

CAGR Growth Rate

3.1% CAGR

Base Year

2020

Forecast Years

2021-2026

Key Market Players

Seiko Instruments, EWAI, Shanghai JingPu Science & Technology, MalvernPanalytical, Beijing Anchor Wisdom Technology, HORIBA, BRUKER, Oxford-Instruments, Olympus Innov-X, LAN Scientific, DFMC, AppliTek, Shimadzu, Thermo Fisher, Hitachi High –Tech, BSI, SPECTRO, Skyray, and Cfantek.

Key Segment

By Product Type, By End-User, and By Region

Major Regions Covered

North America, Europe, Asia Pacific, Latin America, and the Middle East & Africa

Purchase Options

Request customized purchase options to meet your research needs. Explore purchase options

logo Competitive Players

The key players in the global handheld X-ray fluorescence spectrometer market are :

  • Seiko Instruments
  • EWAI
  • Shanghai JingPu Science & Technology
  • MalvernPanalytical
  • Beijing Anchor Wisdom Technology
  • HORIBA
  • BRUKER
  • Oxford-Instruments
  • Olympus Innov-X
  • LAN Scientific
  • DFMC
  • AppliTek
  • Shimadzu
  • Thermo Fisher
  • Hitachi High –Tech
  • BSI
  • SPECTRO
  • Skyray
  • Cfantek

For example, Malvern Panalytical is a Spectris plc company. The company is a manufacturer and supplier of laboratory analytical instruments. It has been influential in the development of the Malvern Correlator, and it remains notable for its work in the advancement of particle sizing technology.In 2020, Malvern Panalytical received the Physikalisch-TechnischeBundesanstalt (PTB) type approval, as a “full-protection” X-ray instrument, for its Aeris range of benchtop XRD diffractometers.

logoGlobal Handheld X-Ray Fluorescence Spectrometer Market: By Product Type

  • Wavelength Dispersion
  • Energy Dispersion

logoGlobal Handheld X-Ray Fluorescence Spectrometer Market: By End-User

  • Mining Industry
  • Cement Industry
  • Petroleum Industry
  • Metallurgical Industry
  • Others

logoGlobal Handheld X-Ray Fluorescence Spectrometer Market: Regional Segmentation Analysis

  • North America
    • The U.S.
    • Canada
  • Europe
    • France
    • The UK
    • Spain
    • Germany
    • Italy
    • Rest of Europe
  • Asia Pacific
    • China
    • Japan
    • India
    • South Korea
    • Southeast Asia
    • Rest of Asia Pacific
  • Latin America
    • Brazil
    • Mexico
    • Rest of Latin America
  • Middle East & Africa
    • GCC
    • South Africa
    • Rest of the Middle East & Africa

Table of Content

  1. Chapter 1 Executive Summary
    1. 1.1. Introduction of Handheld X-Ray Fluorescence Spectrometer
    2. 1.2. Global Handheld X-Ray Fluorescence Spectrometer Market, 2020 & 2026 (USD Million)
    3. 1.3. Global Handheld X-Ray Fluorescence Spectrometer Market, 2016 – 2026(USD Million)
    4. 1.4. Global Handheld X-Ray Fluorescence Spectrometer MarketAbsolute Revenue Opportunity, 2016 – 2026(USD Million)
    5. 1.5. Global Handheld X-Ray Fluorescence Spectrometer MarketIncremental Revenue Opportunity, 2020 – 2026(USD Million)
  2. Chapter 2 Handheld X-Ray Fluorescence Spectrometer Market – Type Analysis
    1. 2.1. Global Handheld X-Ray Fluorescence Spectrometer Market – Type Overview
    2. 2.2. Global Handheld X-Ray Fluorescence Spectrometer Market Share, by Type, 2020 & 2026(USD Million)
    3. 2.3. Wavelength Dispersion
      1. 2.3.1. Global Wavelength Dispersion Handheld X-Ray Fluorescence Spectrometer Market, 2016 – 2026(USD Million)
    4. 2.4. Energy Dispersion
      1. 2.4.1. Global Energy Dispersion Handheld X-Ray Fluorescence Spectrometer Market, 2016 – 2026(USD Million)
  3. Chapter 3 Handheld X-Ray Fluorescence Spectrometer Market – End-User Analysis
    1. 3.1. Global Handheld X-Ray Fluorescence Spectrometer Market – End-User Overview
    2. 3.2. Global Handheld X-Ray Fluorescence Spectrometer Market Share, by End-User, 2020 & 2026(USD Million)
    3. 3.3. Mining Industry
      1. 3.3.1. Global Mining Industry Handheld X-Ray Fluorescence Spectrometer Market, 2016 – 2026(USD Million)
    4. 3.4. Cement Industry
      1. 3.4.1. Global Cement Industry Handheld X-Ray Fluorescence Spectrometer Market, 2016 – 2026(USD Million)
    5. 3.5. Petroleum Industry
      1. 3.5.1. Global Petroleum Industry Handheld X-Ray Fluorescence Spectrometer Market, 2016 – 2026(USD Million)
    6. 3.6. Metallurgical Industry
      1. 3.6.1. Global Metallurgical Industry Handheld X-Ray Fluorescence Spectrometer Market, 2016 – 2026(USD Million)
  4. Chapter 4 Handheld X-Ray Fluorescence Spectrometer Market – Regional Analysis
    1. 4.1. Global Handheld X-Ray Fluorescence Spectrometer Market Regional Overview
    2. 4.2. Global Handheld X-Ray Fluorescence Spectrometer Market Share, by Region, 2020 & 2026(USD Million)
    3. 4.3. North America
      1. 4.3.1. North America Handheld X-Ray Fluorescence Spectrometer Market, 2016 – 2026(USD Million)
        1. 4.3.1.1. North America Handheld X-Ray Fluorescence Spectrometer Market, by Country, 2016 - 2026(USD Million)
      2. 4.3.2. North America Handheld X-Ray Fluorescence Spectrometer Market, by Type, 2016 – 2026
        1. 4.3.2.1. North America Handheld X-Ray Fluorescence Spectrometer Market, by Type, 2016 – 2026(USD Million)
      3. 4.3.3. North America Handheld X-Ray Fluorescence Spectrometer Market, by End-User, 2016 – 2026
        1. 4.3.3.1. North America Handheld X-Ray Fluorescence Spectrometer Market, by End-User, 2016 – 2026(USD Million)
      4. 4.3.4. U.S.
        1. 4.3.4.1. U.S. Handheld X-Ray Fluorescence Spectrometer Market, 2016 – 2026(USD Million)
      5. 4.3.5. Canada
        1. 4.3.5.1. Canada Handheld X-Ray Fluorescence Spectrometer Market, 2016 – 2026(USD Million)
    4. 4.4. Europe
      1. 4.4.1. Europe Handheld X-Ray Fluorescence Spectrometer Market, 2016 – 2026(USD Million)
        1. 4.4.1.1. Europe Handheld X-Ray Fluorescence Spectrometer Market, by Country, 2016 - 2026(USD Million)
      2. 4.4.2. Europe Handheld X-Ray Fluorescence Spectrometer Market, by Type, 2016 – 2026
        1. 4.4.2.1. Europe Handheld X-Ray Fluorescence Spectrometer Market, by Type, 2016 – 2026(USD Million)
      3. 4.4.3. Europe Handheld X-Ray Fluorescence Spectrometer Market, by End-User, 2016 – 2026
        1. 4.4.3.1. Europe Handheld X-Ray Fluorescence Spectrometer Market, by End-User, 2016 – 2026(USD Million)
      4. 4.4.4. Germany
        1. 4.4.4.1. Germany Handheld X-Ray Fluorescence Spectrometer Market, 2016 – 2026(USD Million)
      5. 4.4.5. France
        1. 4.4.5.1. France Handheld X-Ray Fluorescence Spectrometer Market, 2016 – 2026(USD Million)
      6. 4.4.6. U.K.
        1. 4.4.6.1. U.K. Handheld X-Ray Fluorescence Spectrometer Market, 2016 – 2026(USD Million)
      7. 4.4.7. Italy
        1. 4.4.7.1. Italy Handheld X-Ray Fluorescence Spectrometer Market, 2016 – 2026(USD Million)
      8. 4.4.8. Spain
        1. 4.4.8.1. Spain Handheld X-Ray Fluorescence Spectrometer Market, 2016 – 2026(USD Million)
      9. 4.4.9. Rest of Europe
        1. 4.4.9.1. Rest of Europe Handheld X-Ray Fluorescence Spectrometer Market, 2016 – 2026(USD Million)
    5. 4.5. Asia Pacific
      1. 4.5.1. Asia Pacific Handheld X-Ray Fluorescence Spectrometer Market, 2016 – 2026(USD Million)
        1. 4.5.1.1. Asia Pacific Handheld X-Ray Fluorescence Spectrometer Market, by Country, 2016 - 2026(USD Million)
      2. 4.5.2. Asia Pacific Handheld X-Ray Fluorescence Spectrometer Market, by Type, 2016 – 2026
        1. 4.5.2.1. Asia Pacific Handheld X-Ray Fluorescence Spectrometer Market, by Type, 2016 – 2026(USD Million)
      3. 4.5.3. Asia Pacific Handheld X-Ray Fluorescence Spectrometer Market, by End-User, 2016 – 2026
        1. 4.5.3.1. Asia Pacific Handheld X-Ray Fluorescence Spectrometer Market, by End-User, 2016 – 2026(USD Million)
      4. 4.5.4. China
        1. 4.5.4.1. China Handheld X-Ray Fluorescence Spectrometer Market, 2016 – 2026(USD Million)
      5. 4.5.5. Japan
        1. 4.5.5.1. Japan Handheld X-Ray Fluorescence Spectrometer Market, 2016 – 2026(USD Million)
      6. 4.5.6. India
        1. 4.5.6.1. India Handheld X-Ray Fluorescence Spectrometer Market, 2016 – 2026(USD Million)
      7. 4.5.7. South Korea
        1. 4.5.7.1. South Korea Handheld X-Ray Fluorescence Spectrometer Market, 2016 – 2026(USD Million)
      8. 4.5.8. South-East Asia
        1. 4.5.8.1. South-East Asia Handheld X-Ray Fluorescence Spectrometer Market, 2016 – 2026(USD Million)
      9. 4.5.9. Rest of Asia Pacific
        1. 4.5.9.1. Rest of Asia Pacific Handheld X-Ray Fluorescence Spectrometer Market, 2016 – 2026(USD Million)
    6. 4.6. Latin America
      1. 4.6.1. Latin America Handheld X-Ray Fluorescence Spectrometer Market, 2016 – 2026(USD Million)
        1. 4.6.1.1. Latin America Handheld X-Ray Fluorescence Spectrometer Market, by Country, 2016 - 2026(USD Million)
      2. 4.6.2. Latin America Handheld X-Ray Fluorescence Spectrometer Market, by Type, 2016 – 2026
        1. 4.6.2.1. Latin America Handheld X-Ray Fluorescence Spectrometer Market, by Type, 2016 – 2026(USD Million)
      3. 4.6.3. Latin America Handheld X-Ray Fluorescence Spectrometer Market, by End-User, 2016 – 2026
        1. 4.6.3.1. Latin America Handheld X-Ray Fluorescence Spectrometer Market, by End-User, 2016 – 2026(USD Million)
      4. 4.6.4. Brazil
        1. 4.6.4.1. Brazil Handheld X-Ray Fluorescence Spectrometer Market, 2016 – 2026(USD Million)
      5. 4.6.5. Mexico
        1. 4.6.5.1. Mexico Handheld X-Ray Fluorescence Spectrometer Market, 2016 – 2026(USD Million)
      6. 4.6.6. Rest of Latin America
        1. 4.6.6.1. Rest of Latin America Handheld X-Ray Fluorescence Spectrometer Market, 2016 – 2026(USD Million)
    7. 4.7. The Middle-East and Africa
      1. 4.7.1. The Middle-East and Africa Handheld X-Ray Fluorescence Spectrometer Market, 2016 – 2026(USD Million)
        1. 4.7.1.1. The Middle-East and Africa Handheld X-Ray Fluorescence Spectrometer Market, by Country, 2016 - 2026(USD Million)
      2. 4.7.2. The Middle-East and Africa Handheld X-Ray Fluorescence Spectrometer Market, by Type, 2016 – 2026
        1. 4.7.2.1. The Middle-East and Africa Handheld X-Ray Fluorescence Spectrometer Market, by Type, 2016 – 2026(USD Million)
      3. 4.7.3. The Middle-East and Africa Handheld X-Ray Fluorescence Spectrometer Market, by End-User, 2016 – 2026
        1. 4.7.3.1. The Middle-East and Africa Handheld X-Ray Fluorescence Spectrometer Market, by End-User, 2016 – 2026(USD Million)
      4. 4.7.4. GCC Countries
        1. 4.7.4.1. GCC Countries Handheld X-Ray Fluorescence Spectrometer Market, 2016 – 2026(USD Million)
      5. 4.7.5. South Africa
        1. 4.7.5.1. South Africa Handheld X-Ray Fluorescence Spectrometer Market, 2016 – 2026(USD Million)
      6. 4.7.6. Rest of Middle-East Africa
        1. 4.7.6.1. Rest of Middle-East Africa Handheld X-Ray Fluorescence Spectrometer Market, 2016 – 2026(USD Million)
  5. Chapter 5 Handheld X-Ray Fluorescence Spectrometer Market – Competitive Landscape
    1. 5.1. Competitor Market Share – Revenue
    2. 5.2. Market Concentration Rate Analysis, Top 3 and Top 5 Players
    3. 5.3. Strategic Developments
      1. 5.3.1. Acquisitions and Mergers
      2. 5.3.2. New Products
      3. 5.3.3. Research & Development Activities
  6. Chapter 6 Company Profiles
    1. 6.1. Seiko Instruments
      1. 6.1.1. Company Overview
      2. 6.1.2. Product/ServicePortfolio
      3. 6.1.3. Seiko Instruments Sales, Revenue, and Gross Margin
      4. 6.1.4. Seiko Instruments Revenue and Growth Rate
      5. 6.1.5. Seiko Instruments Market Share
      6. 6.1.6. Recent Initiatives, Funding/VC Activities, and Technological Innovations
    2. 6.2. EWAI
      1. 6.2.1. Company Overview
      2. 6.2.2. Product/ServicePortfolio
      3. 6.2.3. EWAI Sales, Revenue, and Gross Margin
      4. 6.2.4. EWAI Revenue and Growth Rate
      5. 6.2.5. EWAI Market Share
      6. 6.2.6. Recent Initiatives, Funding/VC Activities, and Technological Innovations
    3. 6.3. Shanghai JingPu Science & Technology
      1. 6.3.1. Company Overview
      2. 6.3.2. Product/ServicePortfolio
      3. 6.3.3. Shanghai JingPu Science & Technology Sales, Revenue, and Gross Margin
      4. 6.3.4. Shanghai JingPu Science & Technology Revenue and Growth Rate
      5. 6.3.5. Shanghai JingPu Science & Technology Market Share
      6. 6.3.6. Recent Initiatives, Funding/VC Activities, and Technological Innovations
    4. 6.4. Malvern Panalytical
      1. 6.4.1. Company Overview
      2. 6.4.2. Product/ServicePortfolio
      3. 6.4.3. Malvern Panalytical Sales, Revenue, and Gross Margin
      4. 6.4.4. Malvern Panalytical Revenue and Growth Rate
      5. 6.4.5. Malvern Panalytical Market Share
      6. 6.4.6. Recent Initiatives, Funding/VC Activities, and Technological Innovations
    5. 6.5. Beijing Anchor Wisdom Technology
      1. 6.5.1. Company Overview
      2. 6.5.2. Product/ServicePortfolio
      3. 6.5.3. Beijing Anchor Wisdom Technology Sales, Revenue, and Gross Margin
      4. 6.5.4. Beijing Anchor Wisdom Technology Revenue and Growth Rate
      5. 6.5.5. Beijing Anchor Wisdom Technology Market Share
      6. 6.5.6. Recent Initiatives, Funding/VC Activities, and Technological Innovations
    6. 6.6. HORIBA
      1. 6.6.1. Company Overview
      2. 6.6.2. Product/ServicePortfolio
      3. 6.6.3. HORIBA Sales, Revenue, and Gross Margin
      4. 6.6.4. HORIBA Revenue and Growth Rate
      5. 6.6.5. HORIBA Market Share
      6. 6.6.6. Recent Initiatives, Funding/VC Activities, and Technological Innovations
    7. 6.7. BRUKER
      1. 6.7.1. Company Overview
      2. 6.7.2. Product/ServicePortfolio
      3. 6.7.3. BRUKER Sales, Revenue, and Gross Margin
      4. 6.7.4. BRUKER Revenue and Growth Rate
      5. 6.7.5. BRUKER Market Share
      6. 6.7.6. Recent Initiatives, Funding/VC Activities, and Technological Innovations
    8. 6.8. Oxford-Instruments
      1. 6.8.1. Company Overview
      2. 6.8.2. Product/ServicePortfolio
      3. 6.8.3. Oxford-Instruments Sales, Revenue, and Gross Margin
      4. 6.8.4. Oxford-Instruments Revenue and Growth Rate
      5. 6.8.5. Oxford-Instruments Market Share
      6. 6.8.6. Recent Initiatives, Funding/VC Activities, and Technological Innovations
    9. 6.9. Olympus Innov-X
      1. 6.9.1. Company Overview
      2. 6.9.2. Product/ServicePortfolio
      3. 6.9.3. Olympus Innov-X Sales, Revenue, and Gross Margin
      4. 6.9.4. Olympus Innov-X Revenue and Growth Rate
      5. 6.9.5. Olympus Innov-X Market Share
      6. 6.9.6. Recent Initiatives, Funding/VC Activities, and Technological Innovations
    10. 6.10. LAN Scientific
      1. 6.10.1. Company Overview
      2. 6.10.2. Product/ServicePortfolio
      3. 6.10.3. LAN Scientific Sales, Revenue, and Gross Margin
      4. 6.10.4. LAN Scientific Revenue and Growth Rate
      5. 6.10.5. LAN Scientific Market Share
      6. 6.10.6. Recent Initiatives, Funding/VC Activities, and Technological Innovations
    11. 6.11. DFMC
      1. 6.11.1. Company Overview
      2. 6.11.2. Product/ServicePortfolio
      3. 6.11.3. DFMC Sales, Revenue, and Gross Margin
      4. 6.11.4. DFMC Revenue and Growth Rate
      5. 6.11.5. DFMC Market Share
      6. 6.11.6. Recent Initiatives, Funding/VC Activities, and Technological Innovations
    12. 6.12. AppliTek
      1. 6.12.1. Company Overview
      2. 6.12.2. Product/ServicePortfolio
      3. 6.12.3. AppliTek Sales, Revenue, and Gross Margin
      4. 6.12.4. AppliTek Revenue and Growth Rate
      5. 6.12.5. AppliTek Market Share
      6. 6.12.6. Recent Initiatives, Funding/VC Activities, and Technological Innovations
    13. 6.13. Shimadzu
      1. 6.13.1. Company Overview
      2. 6.13.2. Product/ServicePortfolio
      3. 6.13.3. Shimadzu Sales, Revenue, and Gross Margin
      4. 6.13.4. Shimadzu Revenue and Growth Rate
      5. 6.13.5. Shimadzu Market Share
      6. 6.13.6. Recent Initiatives, Funding/VC Activities, and Technological Innovations
    14. 6.14. Thermo Fisher
      1. 6.14.1. Company Overview
      2. 6.14.2. Product/ServicePortfolio
      3. 6.14.3. Thermo Fisher Sales, Revenue, and Gross Margin
      4. 6.14.4. Thermo Fisher Revenue and Growth Rate
      5. 6.14.5. Thermo Fisher Market Share
      6. 6.14.6. Recent Initiatives, Funding/VC Activities, and Technological Innovations
    15. 6.15. Hitachi High –Tech
      1. 6.15.1. Company Overview
      2. 6.15.2. Product/ServicePortfolio
      3. 6.15.3. Hitachi High –Tech Sales, Revenue, and Gross Margin
      4. 6.15.4. Hitachi High –Tech Revenue and Growth Rate
      5. 6.15.5. Hitachi High –Tech Market Share
      6. 6.15.6. Recent Initiatives, Funding/VC Activities, and Technological Innovations
    16. 6.16. BSI
      1. 6.16.1. Company Overview
      2. 6.16.2. Product/ServicePortfolio
      3. 6.16.3. BSI Sales, Revenue, and Gross Margin
      4. 6.16.4. BSI Revenue and Growth Rate
      5. 6.16.5. BSI Market Share
      6. 6.16.6. Recent Initiatives, Funding/VC Activities, and Technological Innovations
    17. 6.17. SPECTRO
      1. 6.17.1. Company Overview
      2. 6.17.2. Product/ServicePortfolio
      3. 6.17.3. SPECTRO Sales, Revenue, and Gross Margin
      4. 6.17.4. SPECTRO Revenue and Growth Rate
      5. 6.17.5. SPECTRO Market Share
      6. 6.17.6. Recent Initiatives, Funding/VC Activities, and Technological Innovations
    18. 6.18. Skyray
      1. 6.18.1. Company Overview
      2. 6.18.2. Product/ServicePortfolio
      3. 6.18.3. Skyray Sales, Revenue, and Gross Margin
      4. 6.18.4. Skyray Revenue and Growth Rate
      5. 6.18.5. Skyray Market Share
      6. 6.18.6. Recent Initiatives, Funding/VC Activities, and Technological Innovations
    19. 6.19. Cfantek
      1. 6.19.1. Company Overview
      2. 6.19.2. Product/ServicePortfolio
      3. 6.19.3. Cfantek Sales, Revenue, and Gross Margin
      4. 6.19.4. Cfantek Revenue and Growth Rate
      5. 6.19.5. Cfantek Market Share
      6. 6.19.6. Recent Initiatives, Funding/VC Activities, and Technological Innovations
  7. Chapter 7 Handheld X-Ray Fluorescence Spectrometer — Industry Analysis
    1. 7.1. Introduction and Taxonomy
    2. 7.2. Handheld X-Ray Fluorescence Spectrometer Market – Key Trends
      1. 7.2.1. Market Drivers
      2. 7.2.2. Market Restraints
      3. 7.2.3. Market Opportunities
    3. 7.3. Value Chain Analysis
    4. 7.4. Key Mandates and Regulations
    5. 7.5. Technology Roadmap and Timeline
    6. 7.6. Handheld X-Ray Fluorescence Spectrometer Market – Attractiveness Analysis
      1. 7.6.1. By Type
      2. 7.6.2. By End-User
      3. 7.6.3. By Region
  8. Chapter 8 Industrial Chain, Sourcing Strategy, and Downstream Buyers
    1. 8.1. Handheld X-Ray Fluorescence Spectrometer Industrial Chain Analysis
    2. 8.2. Downstream Buyers
    3. 8.3. Distributors/Traders List
  9. Chapter 9 Marketing Strategy Analysis
    1. 9.1. Marketing Channel
    2. 9.2. Direct Marketing
    3. 9.3. Indirect Marketing
    4. 9.4. Marketing Channel Development Trends
    5. 9.5. Economic/Political Environmental Change
  10. Chapter 10 Report Conclusion& Key Insights
    1. 10.1. Key Insights from Primary Interviews & Surveys Respondents
    2. 10.2. Key Takeaways from Analysts, Consultants, and Industry Leaders
  11. Chapter 11 Research Approach & Methodology
    1. 11.1. Report Description
    2. 11.2. Research Scope
    3. 11.3. Research Methodology
      1. 11.3.1. Secondary Research
      2. 11.3.2. Primary Research
      3. 11.3.3. Statistical Models
        1. 11.3.3.1. Company Share Analysis Model
        2. 11.3.3.2. Revenue Based Modeling
      4. 11.3.4. Research Limitations

      List of Figures

      Fig.1	Product Picture of  Handheld X-Ray Fluorescence Spectrometer 
      Fig.2	Global  Handheld X-Ray Fluorescence Spectrometer  Market, 2016 – 2026(USD Million)
      Fig.3	Global  Handheld X-Ray Fluorescence Spectrometer  MarketAbsolute Revenue Opportunity, 2016 – 2026(USD Million)
      Fig.4	Global  Handheld X-Ray Fluorescence Spectrometer  MarketIncremental Revenue Opportunity, 2020 – 2026(USD Million)
      Fig.5	Global  Handheld X-Ray Fluorescence Spectrometer  Market Share, by Type, 2020 & 2026(USD Million)
      Fig.6	Global Wavelength Dispersion Handheld X-Ray Fluorescence Spectrometer  Market, 2016 – 2026(USD Million)
      Fig.7	Global Energy Dispersion Handheld X-Ray Fluorescence Spectrometer  Market, 2016 – 2026(USD Million)
      Fig.8	Global  Handheld X-Ray Fluorescence Spectrometer  Market Share, by End-User, 2020 & 2026(USD Million)
      Fig.9	Global Mining Industry Handheld X-Ray Fluorescence Spectrometer  Market, 2016 – 2026(USD Million)
      Fig.10	Global Cement Industry Handheld X-Ray Fluorescence Spectrometer  Market, 2016 – 2026(USD Million)
      Fig.11	Global Petroleum Industry Handheld X-Ray Fluorescence Spectrometer  Market, 2016 – 2026(USD Million)
      Fig.12	Global Metallurgical Industry Handheld X-Ray Fluorescence Spectrometer  Market, 2016 – 2026(USD Million)
      Fig.13	Global  Handheld X-Ray Fluorescence Spectrometer  MarketShare, by Region, 2020 & 2026(USD Million)
      Fig.14	North America Handheld X-Ray Fluorescence Spectrometer  Market, 2016 – 2026(USD Million)
      Fig.15	U.S. Handheld X-Ray Fluorescence Spectrometer  Market, 2016 – 2026(USD Million)
      Fig.16	Canada Handheld X-Ray Fluorescence Spectrometer  Market, 2016 – 2026(USD Million)
      Fig.17	Europe Handheld X-Ray Fluorescence Spectrometer  Market, 2016 – 2026(USD Million)
      Fig.18	Germany Handheld X-Ray Fluorescence Spectrometer  Market, 2016 – 2026(USD Million)
      Fig.19	France Handheld X-Ray Fluorescence Spectrometer  Market, 2016 – 2026(USD Million)
      Fig.20	U.K. Handheld X-Ray Fluorescence Spectrometer  Market, 2016 – 2026(USD Million)
      Fig.21	Italy Handheld X-Ray Fluorescence Spectrometer  Market, 2016 – 2026(USD Million)
      Fig.22	Spain Handheld X-Ray Fluorescence Spectrometer  Market, 2016 – 2026(USD Million)
      Fig.23	Rest of Europe Handheld X-Ray Fluorescence Spectrometer  Market, 2016 – 2026(USD Million)
      Fig.24	Asia Pacific Handheld X-Ray Fluorescence Spectrometer  Market, 2016 – 2026(USD Million)
      Fig.25	China Handheld X-Ray Fluorescence Spectrometer  Market, 2016 – 2026(USD Million)
      Fig.26	Japan Handheld X-Ray Fluorescence Spectrometer  Market, 2016 – 2026(USD Million)
      Fig.27	India Handheld X-Ray Fluorescence Spectrometer  Market, 2016 – 2026(USD Million)
      Fig.28	South  Korea Handheld X-Ray Fluorescence Spectrometer  Market, 2016 – 2026(USD Million)
      Fig.29	South-East Asia Handheld X-Ray Fluorescence Spectrometer  Market, 2016 – 2026(USD Million)
      Fig.30	Rest of Asia Pacific Handheld X-Ray Fluorescence Spectrometer  Market, 2016 – 2026(USD Million)
      Fig.31	Latin America Handheld X-Ray Fluorescence Spectrometer  Market, 2016 – 2026(USD Million)
      Fig.32	Brazil Handheld X-Ray Fluorescence Spectrometer  Market, 2016 – 2026(USD Million)
      Fig.33	Mexico Handheld X-Ray Fluorescence Spectrometer  Market, 2016 – 2026(USD Million)
      Fig.34	Rest of Latin America Handheld X-Ray Fluorescence Spectrometer  Market, 2016 – 2026(USD Million)
      Fig.35	The Middle-East and Africa Handheld X-Ray Fluorescence Spectrometer  Market, 2016 – 2026(USD Million)
      Fig.36	GCC Countries Handheld X-Ray Fluorescence Spectrometer  Market, 2016 – 2026(USD Million)
      Fig.37	South Africa Handheld X-Ray Fluorescence Spectrometer  Market, 2016 – 2026(USD Million)
      Fig.38	Rest of Middle-East Africa Handheld X-Ray Fluorescence Spectrometer  Market, 2016 – 2026(USD Million)
      Fig.39	Competitor Market Share – Revenue
      Fig.40	Seiko Instruments Revenue and Growth Rate
      Fig.41	Seiko Instruments Market Share
      Fig.42	EWAI Revenue and Growth Rate
      Fig.43	EWAI Market Share
      Fig.44	Shanghai JingPu Science & Technology Revenue and Growth Rate
      Fig.45	Shanghai JingPu Science & Technology Market Share
      Fig.46	Malvern Panalytical Revenue and Growth Rate
      Fig.47	Malvern Panalytical Market Share
      Fig.48	Beijing Anchor Wisdom Technology Revenue and Growth Rate
      Fig.49	Beijing Anchor Wisdom Technology Market Share
      Fig.50	HORIBA Revenue and Growth Rate
      Fig.51	HORIBA Market Share
      Fig.52	BRUKER Revenue and Growth Rate
      Fig.53	BRUKER Market Share
      Fig.54	Oxford-Instruments Revenue and Growth Rate
      Fig.55	Oxford-Instruments Market Share
      Fig.56	Olympus Innov-X Revenue and Growth Rate
      Fig.57	Olympus Innov-X Market Share
      Fig.58	LAN Scientific Revenue and Growth Rate
      Fig.59	LAN Scientific Market Share
      Fig.60	DFMC Revenue and Growth Rate
      Fig.61	DFMC Market Share
      Fig.62	AppliTek Revenue and Growth Rate
      Fig.63	AppliTek Market Share
      Fig.64	Shimadzu Revenue and Growth Rate
      Fig.65	Shimadzu Market Share
      Fig.66	Thermo Fisher Revenue and Growth Rate
      Fig.67	Thermo Fisher Market Share
      Fig.68	Hitachi High –Tech Revenue and Growth Rate
      Fig.69	Hitachi High –Tech Market Share
      Fig.70	BSI Revenue and Growth Rate
      Fig.71	BSI Market Share
      Fig.72	SPECTRO Revenue and Growth Rate
      Fig.73	SPECTRO Market Share
      Fig.74	Skyray Revenue and Growth Rate
      Fig.75	Skyray Market Share
      Fig.76	Cfantek Revenue and Growth Rate
      Fig.77	Cfantek Market Share
      Fig.78	Market Dynamics
      Fig.79	Global  Handheld X-Ray Fluorescence Spectrometer  – Value Chain Analysis
      Fig.80	Key Mandates and Regulations
      Fig.81	Technology Roadmap and Timeline
      Fig.82	Market Attractiveness Analysis – By Type
      Fig.83	Market Attractiveness Analysis – By End-User
      Fig.84	Market Attractiveness Analysis – By Region
      Fig.85	 Handheld X-Ray Fluorescence Spectrometer  Industrial Chain Analysis
      Fig.86	Market Channels
      Fig.87	Marketing Channel Development Trend
      Fig.88	Growth in World Gross Product, 2008-2018
      

      List of Tables

      Table 1	Global Handheld X-Ray Fluorescence Spectrometer Market, 2020 & 2026(USD Million)
      Table 2	Global Handheld X-Ray Fluorescence Spectrometer Market, by Type, 2016 – 2026(USD Million)
      Table 3	Global Handheld X-Ray Fluorescence Spectrometer Market, by End-User, 2016 – 2026(USD Million)
      Table 4	Global Handheld X-Ray Fluorescence Spectrometer Market, by Region, 2016 – 2026(USD Million)
      Table 5	North America Handheld X-Ray Fluorescence Spectrometer  Market, by Country, 2016 – 2026(USD Million)
      Table 6	North America Handheld X-Ray Fluorescence Spectrometer  Market, by Type, 2016 – 2026(USD Million)
      Table 7	North America Handheld X-Ray Fluorescence Spectrometer  Market, by End-User, 2016 – 2026(USD Million)
      Table 8	Europe Handheld X-Ray Fluorescence Spectrometer  Market, by Country, 2016 – 2026(USD Million)
      Table 9 Europe Handheld X-Ray Fluorescence Spectrometer  Market, by Type, 2016 – 2026(USD Million)
      Table 10 Europe Handheld X-Ray Fluorescence Spectrometer  Market, by End-User, 2016 – 2026(USD Million)
      Table 11 Asia Pacific Handheld X-Ray Fluorescence Spectrometer  Market, by Country, 2016 – 2026(USD Million)
      Table 12 Asia Pacific Handheld X-Ray Fluorescence Spectrometer  Market, by Type, 2016 – 2026(USD Million)
      Table 13 Asia Pacific Handheld X-Ray Fluorescence Spectrometer  Market, by End-User, 2016 – 2026(USD Million)
      Table 14 Latin America Handheld X-Ray Fluorescence Spectrometer  Market, by Country, 2016 – 2026(USD Million)
      Table 15 Latin America Handheld X-Ray Fluorescence Spectrometer  Market, by Type, 2016 – 2026(USD Million)
      Table 16 Latin America Handheld X-Ray Fluorescence Spectrometer  Market, by End-User, 2016 – 2026(USD Million)
      Table 17 The Middle-East and Africa Handheld X-Ray Fluorescence Spectrometer  Market, by Country, 2016 – 2026(USD Million)
      Table 18 The Middle-East and Africa Handheld X-Ray Fluorescence Spectrometer  Market, by Type, 2016 – 2026(USD Million)
      Table 19 The Middle-East and Africa Handheld X-Ray Fluorescence Spectrometer  Market, by End-User, 2016 – 2026(USD Million)
      Table 20 Global  Handheld X-Ray Fluorescence Spectrometer  Market - Company Revenue Analysis, 2016 – 2019(USD Million)
      Table 21 Global  Handheld X-Ray Fluorescence Spectrometer  Market - Company Revenue Share Analysis, 2016 – 2019(%)
      Table 22 Acquisitions and Mergers
      Table 23 Market Drivers – Impact Analysis
      Table 24 Market Restraints
      Table 25 Market Opportunities
      Table 26 Major Buyers of  Handheld X-Ray Fluorescence Spectrometer 
      Table 27 Distributors/Traders of  Handheld X-Ray Fluorescence Spectrometer  by Region
      

Industry Major Market Players

  • Seiko Instruments
  • EWAI
  • Shanghai JingPu Science & Technology
  • MalvernPanalytical
  • Beijing Anchor Wisdom Technology
  • HORIBA
  • BRUKER
  • Oxford-Instruments
  • Olympus Innov-X
  • LAN Scientific
  • DFMC
  • AppliTek
  • Shimadzu
  • Thermo Fisher
  • Hitachi High –Tech
  • BSI
  • SPECTRO
  • Skyray
  • Cfantek.