Search Market Research Report

Discover Our Latest Reports
Discover Our Featured Reports
Discover Top Selling Reports

Graph Database Market Size, Share Global Analysis Report, 2021 - 2026

report img

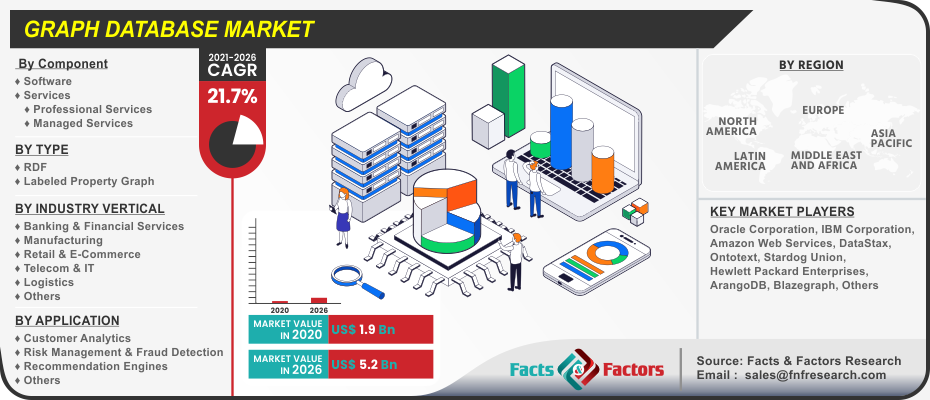
Graph Database Market By Component (Software & Services), By Type (RDF & Labeled Property Graph), By Industry Vertical (Banking & Financial Services, Manufacturing, Retail & E-Commerce, Telecom & IT, Logistics, & Others), By Application (Customer Analytics, Risk Management & Fraud Detection, Recommendation Engines, & Others), And By Regions - Global & Regional Industry Perspective, Comprehensive Analysis, and Forecast 2021 - 2026

Industry Insights

[198+ Pages Report] We at Facts & Factors have recently published a report titled “Global Graph Database Market” that encompasses the spectacle of the market in an analytical and comprehensive manner. In this research report, the global graph database market is valued to reach USD 5.2 Billion in the year 2026 from an initial value of USD 1.9 Billion in the year 2020 growing at a CAGR value of 21.7%.

logoMarket Overview

Graph databases possess the unique ability to store, process, and query connections in an effective manner while other databases have the computational ability to query requests through an extensive JOIN operation. Furthermore, graph databases, store connections alongside the data in the model by accessing nodes and relationships by trans versing millions of connections per second per core. No matter the size of your database, these databases excel at querying highly-connected data and complex queries with a pattern of starting points by aggregating nodes without going outside the search parameters.

logoIndustry Growth Factors

The global graph database market is expected to gain a wider market share during the advent of the forecast period owing to contributing factors such as rising demand for incorporating real-time big data mining results with visualization of results coupled with rising adoption of AI-based graph database tools and services to name a few. Additionally, the rising demand for solutions with low-latency query time coupled with the integration of blockchain and cloud computing methods will increase the footprint of the global graph database market during the advent of the forecast period. Moreover, increasing cases of multiple database querying and increased adoption of big data measures will further boost the growth of the global graph database market during the advent of the forecast period.

The global graph database market is driven by rising demand for scaling and handling naturally large data sets coupled with a rapid growth spurt arising from the digital banking sector to name a few. Flexible and suitable performance tools according to the ever-changing needs and requirements of users will further fuel the growth of the global graph database market during the advent of the forecast period. Additionally, a solid lack of standardization and programming ease measures are expected to decrease the growth of the global graph database market to some extent during the forecast period.

Graph Database Market

To know more about this report | Request Free Sample Copy

logoSegmentation Analysis

The global graph database market is segmented into component, type, industry vertical, application, and region.

On the basis of components, the global graph database market is divided into software and services. The segment pertaining to software is expected to witness the largest market share during the advent of the forecast period owing to analyzing sources from IoT devices, sensors, clickstreams, and social media platforms coupled with interactive dashboards as visualization measures to name a few. Based on type, the global graph database market is classified into RDF and labeled property graph. The RDF segment is expected to occupy the largest market share during the advent of the forecast period owing to rising instances and detection needs of frauds and cyberattacks to name a few. On the basis of industry vertical, the global graph database market is fragmented into banking & financial services, manufacturing, retail & e-commerce, telecom & IT, logistics, and others. The segment pertaining to banking and financial services is expected to witness the largest market share during the advent of the forecast period owing to the integration of these tools for reducing the occurrence of baking frauds coupled with identifying unsecured baking credit cards to name a few. On the basis of application, the global graph database market is branched into customer analytics, risk management & fraud detection, recommendation engines, and others. The segment pertaining to risk management & fraud detection is expected to witness the largest market share during the advent of the forecast period owing to a higher standard of adoption aimed at increasing security measures coupled with rising demand for scaling solutions to name a few.

logo Report Scope

Report Attribute

Details

Market Size in 2020

USD 1.9 Billion

Projected Market Size in 2026

USD 5.2 Billion

CAGR Growth Rate

21.7% CAGR

Base Year

2020

Forecast Years

2021-2026

Key Market Players

Oracle Corporation, IBM Corporation, Amazon Web Services, DataStax, Ontotext, Stardog Union, Hewlett Packard Enterprises, ArangoDB, Blazegraph, Microsoft Corporation, TIBCO Software, Inc., Neo4j, Inc., GraphBase, Cambridge Semantic, TigerGraph, Inc., Dgraph Labs, and Eccenca, among others.

Key Segments

Types, Industry Verticals, Applications, and Region

Major Regions Covered

North America, Europe, Asia Pacific, Latin America, and Middle East & Africa

Purchase Options

Request customized purchase options to meet your research needs. Explore purchase options

logo Regional Analysis

North America is expected to witness the largest market share during the advent of the forecast period owing to the early adoption of the technology in the region coupled with increasing technological advancements to name a few. The presence of key market players in the region coupled with the region’s higher reliance on the data-centric applications will increase the footprint of the graph database market during the advent of the forecast period. Asia-Pacific is expected to witness the fastest growing CAGR during the advent of the forecast period owing to the rising number of firms leveraging information-intensive technology for gaining an edge over its competitors coupled with an increasing number of mergers & acquisitions to name a few.

logo Competitive Players

The key market participants for the global graph database market are :

  • Oracle Corporation
  • IBM Corporation
  • Amazon Web Services
  • DataStax
  • Ontotext
  • Stardog Union
  • Hewlett Packard Enterprises
  • ArangoDB
  • Blazegraph
  • Microsoft Corporation
  • TIBCO Software Inc.
  • Neo4j Inc.
  • GraphBase
  • Cambridge Semantic
  • TigerGraph Inc.
  • Dgraph Labs
  • Eccenca

logo By Component Segment Analysis

  • Software
  • Services
    • Professional Services
    • Managed Services

logo By Type Segment Analysis

  • RDF
  • Labeled Property Graph

logo By Industry Vertical Segment Analysis

  • Banking & Financial Services
  • Manufacturing
  • Retail & E-Commerce
  • Telecom & IT
  • Logistics
  • Others

logo By Application Segment Analysis

  • Customer Analytics
  • Risk Management & Fraud Detection
  • Recommendation Engines
  • Others

logo By Regional Segment Analysis

  • North America
    • U.S.
    • Canada
  • Europe
    • UK
    • France
    • Germany
    • Italy
    • Spain
    • Rest of Europe
  • Asia Pacific
    • China
    • Japan
    • India
    • South Korea
    • Southeast Asia
    • Rest of Asia Pacific
  • Latin America
    • Brazil
    • Mexico
    • Rest of Latin America
  • Middle East and Africa
    • GCC Countries
    • South Africa
    • Rest of MEA

Table of Content

  1. Chapter 1 Executive Summary
    1. 1.1. Introduction of Graph Database
    2. 1.2. Global Graph Database Market, 2019 & 2026 (USD Billion)
    3. 1.3. Global Graph Database Market, 2016 – 2026 (USD Billion)
    4. 1.4. Global Graph Database Market Absolute Revenue Opportunity, 2016 – 2026 (USD Billion)
    5. 1.5. Global Graph Database Market Incremental Revenue Opportunity, 2020 – 2026 (USD Billion)
  2. Chapter 2 Graph Database Market – Component Analysis
    1. 2.1. Global Graph Database Market – Component Overview
    2. 2.2. Global Graph Database Market Share, by Component, 2019 & 2026 (USD Billion)
    3. 2.3. Software
      1. 2.3.1. Global Software Graph Database Market, 2016 – 2026 (USD Billion)
    4. 2.4. Services
      1. 2.4.1. Global Services Graph Database Market, 2016 – 2026 (USD Billion)
  3. Chapter 3 Graph Database Market – Type Analysis
    1. 3.1. Global Graph Database Market – Type Overview
    2. 3.2. Global Graph Database Market Share, by Type, 2019 & 2026 (USD Billion)
    3. 3.3. RDF
      1. 3.3.1. Global RDF Graph Database Market, 2016 – 2026 (USD Billion)
    4. 3.4. Labeled Property Graph
      1. 3.4.1. Global Labeled Property Graph Graph Database Market, 2016 – 2026 (USD Billion)
  4. Chapter 4 Graph Database Market – Industry Vertical Analysis
    1. 4.1. Global Graph Database Market – Industry Vertical Overview
    2. 4.2. Global Graph Database Market Share, by Industry Vertical, 2019 & 2026 (USD Billion)
    3. 4.3. Banking & Financial Services
      1. 4.3.1. Global Banking & Financial Services Graph Database Market, 2016 – 2026 (USD Billion)
    4. 4.4. Manufacturing
      1. 4.4.1. Global Manufacturing Graph Database Market, 2016 – 2026 (USD Billion)
    5. 4.5. Retail & E-Commerce
      1. 4.5.1. Global Retail & E-Commerce Graph Database Market, 2016 – 2026 (USD Billion)
    6. 4.6. Telecom & IT
      1. 4.6.1. Global Telecom & IT Graph Database Market, 2016 – 2026 (USD Billion)
    7. 4.7. Logistics
      1. 4.7.1. Global Logistics Graph Database Market, 2016 – 2026 (USD Billion)
    8. 4.8. Others
      1. 4.8.1. Global Others Graph Database Market, 2016 – 2026 (USD Billion)
  5. Chapter 5 Graph Database Market – Application Analysis
    1. 5.1. Global Graph Database Market – Application Overview
    2. 5.2. Global Graph Database Market Share, by Application, 2019 & 2026 (USD Billion)
    3. 5.3. Customer Analytics
      1. 5.3.1. Global Customer Analytics Graph Database Market, 2016 – 2026 (USD Billion)
    4. 5.4. Risk Management & Fraud Detection
      1. 5.4.1. Global Risk Management & Fraud Detection Graph Database Market, 2016 – 2026 (USD Billion)
    5. 5.5. Recommendation Engines
      1. 5.5.1. Global Recommendation Engines Graph Database Market, 2016 – 2026 (USD Billion)
    6. 5.6. Others
      1. 5.6.1. Global Others Graph Database Market, 2016 – 2026 (USD Billion)
  6. Chapter 6 Graph Database Market – Regional Analysis
    1. 6.1. Global Graph Database Market Regional Overview
    2. 6.2. Global Graph Database Market Share, by Region, 2019 & 2026 (USD Billion)
    3. 6.3. North America
      1. 6.3.1. North America Graph Database Market, 2016 – 2026 (USD Billion)
        1. 6.3.1.1. North America Graph Database Market, by Country, 2016 - 2026 (USD Billion)
      2. 6.3.2. North America Graph Database Market, by Component, 2016 – 2026
        1. 6.3.2.1. North America Graph Database Market, by Component, 2016 – 2026 (USD Billion)
      3. 6.3.3. North America Graph Database Market, by Type, 2016 – 2026
        1. 6.3.3.1. North America Graph Database Market, by Type, 2016 – 2026 (USD Billion)
      4. 6.3.4. North America Graph Database Market, by Industry Vertical, 2016 – 2026
        1. 6.3.4.1. North America Graph Database Market, by Industry Vertical, 2016 – 2026 (USD Billion)
      5. 6.3.5. North America Graph Database Market, by Application, 2016 – 2026
        1. 6.3.5.1. North America Graph Database Market, by Application, 2016 – 2026 (USD Billion)
      6. 6.3.6. U.S.
        1. 6.3.6.1. U.S. Graph Database Market, 2016 – 2026 (USD Billion)
      7. 6.3.7. Canada
        1. 6.3.7.1. Canada Graph Database Market, 2016 – 2026 (USD Billion)
    4. 6.4. Europe
      1. 6.4.1. Europe Graph Database Market, 2016 – 2026 (USD Billion)
        1. 6.4.1.1. Europe Graph Database Market, by Country, 2016 - 2026 (USD Billion)
      2. 6.4.2. Europe Graph Database Market, by Component, 2016 – 2026
        1. 6.4.2.1. Europe Graph Database Market, by Component, 2016 – 2026 (USD Billion)
      3. 6.4.3. Europe Graph Database Market, by Type, 2016 – 2026
        1. 6.4.3.1. Europe Graph Database Market, by Type, 2016 – 2026 (USD Billion)
      4. 6.4.4. Europe Graph Database Market, by Industry Vertical, 2016 – 2026
        1. 6.4.4.1. Europe Graph Database Market, by Industry Vertical, 2016 – 2026 (USD Billion)
      5. 6.4.5. Europe Graph Database Market, by Application, 2016 – 2026
        1. 6.4.5.1. Europe Graph Database Market, by Application, 2016 – 2026 (USD Billion)
      6. 6.4.6. Germany
        1. 6.4.6.1. Germany Graph Database Market, 2016 – 2026 (USD Billion)
      7. 6.4.7. France
        1. 6.4.7.1. France Graph Database Market, 2016 – 2026 (USD Billion)
      8. 6.4.8. U.K.
        1. 6.4.8.1. U.K. Graph Database Market, 2016 – 2026 (USD Billion)
      9. 6.4.9. Italy
        1. 6.4.9.1. Italy Graph Database Market, 2016 – 2026 (USD Billion)
      10. 6.4.10. Spain
        1. 6.4.10.1. Spain Graph Database Market, 2016 – 2026 (USD Billion)
      11. 6.4.11. Rest of Europe
        1. 6.4.11.1. Rest of Europe Graph Database Market, 2016 – 2026 (USD Billion)
    5. 6.5. Asia Pacific
      1. 6.5.1. Asia Pacific Graph Database Market, 2016 – 2026 (USD Billion)
        1. 6.5.1.1. Asia Pacific Graph Database Market, by Country, 2016 - 2026 (USD Billion)
      2. 6.5.2. Asia Pacific Graph Database Market, by Component, 2016 – 2026
        1. 6.5.2.1. Asia Pacific Graph Database Market, by Component, 2016 – 2026 (USD Billion)
      3. 6.5.3. Asia Pacific Graph Database Market, by Type, 2016 – 2026
        1. 6.5.3.1. Asia Pacific Graph Database Market, by Type, 2016 – 2026 (USD Billion)
      4. 6.5.4. Asia Pacific Graph Database Market, by Industry Vertical, 2016 – 2026
        1. 6.5.4.1. Asia Pacific Graph Database Market, by Industry Vertical, 2016 – 2026 (USD Billion)
      5. 6.5.5. Asia Pacific Graph Database Market, by Application, 2016 – 2026
        1. 6.5.5.1. Asia Pacific Graph Database Market, by Application, 2016 – 2026 (USD Billion)
      6. 6.5.6. China
        1. 6.5.6.1. China Graph Database Market, 2016 – 2026 (USD Billion)
      7. 6.5.7. Japan
        1. 6.5.7.1. Japan Graph Database Market, 2016 – 2026 (USD Billion)
      8. 6.5.8. India
        1. 6.5.8.1. India Graph Database Market, 2016 – 2026 (USD Billion)
      9. 6.5.9. South Korea
        1. 6.5.9.1. South Korea Graph Database Market, 2016 – 2026 (USD Billion)
      10. 6.5.10. South-East Asia
        1. 6.5.10.1. South-East Asia Graph Database Market, 2016 – 2026 (USD Billion)
      11. 6.5.11. Rest of Asia Pacific
        1. 6.5.11.1. Rest of Asia Pacific Graph Database Market, 2016 – 2026 (USD Billion)
    6. 6.6. Latin America
      1. 6.6.1. Latin America Graph Database Market, 2016 – 2026 (USD Billion)
        1. 6.6.1.1. Latin America Graph Database Market, by Country, 2016 - 2026 (USD Billion)
      2. 6.6.2. Latin America Graph Database Market, by Component, 2016 – 2026
        1. 6.6.2.1. Latin America Graph Database Market, by Component, 2016 – 2026 (USD Billion)
      3. 6.6.3. Latin America Graph Database Market, by Type, 2016 – 2026
        1. 6.6.3.1. Latin America Graph Database Market, by Type, 2016 – 2026 (USD Billion)
      4. 6.6.4. Latin America Graph Database Market, by Industry Vertical, 2016 – 2026
        1. 6.6.4.1. Latin America Graph Database Market, by Industry Vertical, 2016 – 2026 (USD Billion)
      5. 6.6.5. Latin America Graph Database Market, by Application, 2016 – 2026
        1. 6.6.5.1. Latin America Graph Database Market, by Application, 2016 – 2026 (USD Billion)
      6. 6.6.6. Brazil
        1. 6.6.6.1. Brazil Graph Database Market, 2016 – 2026 (USD Billion)
      7. 6.6.7. Mexico
        1. 6.6.7.1. Mexico Graph Database Market, 2016 – 2026 (USD Billion)
      8. 6.6.8. Rest of Latin America
        1. 6.6.8.1. Rest of Latin America Graph Database Market, 2016 – 2026 (USD Billion)
    7. 6.7. The Middle-East and Africa
      1. 6.7.1. The Middle-East and Africa Graph Database Market, 2016 – 2026 (USD Billion)
        1. 6.7.1.1. The Middle-East and Africa Graph Database Market, by Country, 2016 - 2026 (USD Billion)
      2. 6.7.2. The Middle-East and Africa Graph Database Market, by Component, 2016 – 2026
        1. 6.7.2.1. The Middle-East and Africa Graph Database Market, by Component, 2016 – 2026 (USD Billion)
      3. 6.7.3. The Middle-East and Africa Graph Database Market, by Type, 2016 – 2026
        1. 6.7.3.1. The Middle-East and Africa Graph Database Market, by Type, 2016 – 2026 (USD Billion)
      4. 6.7.4. The Middle-East and Africa Graph Database Market, by Industry Vertical, 2016 – 2026
        1. 6.7.4.1. The Middle-East and Africa Graph Database Market, by Industry Vertical, 2016 – 2026 (USD Billion)
      5. 6.7.5. The Middle-East and Africa Graph Database Market, by Application, 2016 – 2026
        1. 6.7.5.1. The Middle-East and Africa Graph Database Market, by Application, 2016 – 2026 (USD Billion)
      6. 6.7.6. GCC Countries
        1. 6.7.6.1. GCC Countries Graph Database Market, 2016 – 2026 (USD Billion)
      7. 6.7.7. South Africa
        1. 6.7.7.1. South Africa Graph Database Market, 2016 – 2026 (USD Billion)
      8. 6.7.8. Rest of Middle-East Africa
        1. 6.7.8.1. Rest of Middle-East Africa Graph Database Market, 2016 – 2026 (USD Billion)
  7. Chapter 7 Graph Database Market – Competitive Landscape
    1. 7.1. Competitor Market Share – Revenue
    2. 7.2. Market Concentration Rate Analysis, Top 3 and Top 5 Players
    3. 7.3. Strategic Developments
      1. 7.3.1. Acquisitions and Mergers
      2. 7.3.2. New Products
      3. 7.3.3. Research & Development Activities
  8. Chapter 8 Company Profiles
    1. 8.1. Oracle Corporation
      1. 8.1.1. Company Overview
      2. 8.1.2. Product/Service Portfolio
      3. 8.1.3. Oracle Corporation Sales, Revenue, and Gross Margin
      4. 8.1.4. Oracle Corporation Revenue and Growth Rate
      5. 8.1.5. Oracle Corporation Market Share
      6. 8.1.6. Recent Initiatives, Funding/VC Activities, and Technological Innovations
    2. 8.2. IBM Corporation
      1. 8.2.1. Company Overview
      2. 8.2.2. Product/Service Portfolio
      3. 8.2.3. IBM Corporation Sales, Revenue, and Gross Margin
      4. 8.2.4. IBM Corporation Revenue and Growth Rate
      5. 8.2.5. IBM Corporation Market Share
      6. 8.2.6. Recent Initiatives, Funding/VC Activities, and Technological Innovations
    3. 8.3. Amazon Web Services
      1. 8.3.1. Company Overview
      2. 8.3.2. Product/Service Portfolio
      3. 8.3.3. Amazon Web Services Sales, Revenue, and Gross Margin
      4. 8.3.4. Amazon Web Services Revenue and Growth Rate
      5. 8.3.5. Amazon Web Services Market Share
      6. 8.3.6. Recent Initiatives, Funding/VC Activities, and Technological Innovations
    4. 8.4. DataStax
      1. 8.4.1. Company Overview
      2. 8.4.2. Product/Service Portfolio
      3. 8.4.3. DataStax Sales, Revenue, and Gross Margin
      4. 8.4.4. DataStax Revenue and Growth Rate
      5. 8.4.5. DataStax Market Share
      6. 8.4.6. Recent Initiatives, Funding/VC Activities, and Technological Innovations
    5. 8.5. Ontotext
      1. 8.5.1. Company Overview
      2. 8.5.2. Product/Service Portfolio
      3. 8.5.3. Ontotext Sales, Revenue, and Gross Margin
      4. 8.5.4. Ontotext Revenue and Growth Rate
      5. 8.5.5. Ontotext Market Share
      6. 8.5.6. Recent Initiatives, Funding/VC Activities, and Technological Innovations
    6. 8.6. Stardog Union
      1. 8.6.1. Company Overview
      2. 8.6.2. Product/Service Portfolio
      3. 8.6.3. Stardog Union Sales, Revenue, and Gross Margin
      4. 8.6.4. Stardog Union Revenue and Growth Rate
      5. 8.6.5. Stardog Union Market Share
      6. 8.6.6. Recent Initiatives, Funding/VC Activities, and Technological Innovations
    7. 8.7. Hewlett Packard Enterprises
      1. 8.7.1. Company Overview
      2. 8.7.2. Product/Service Portfolio
      3. 8.7.3. Hewlett Packard Enterprises Sales, Revenue, and Gross Margin
      4. 8.7.4. Hewlett Packard Enterprises Revenue and Growth Rate
      5. 8.7.5. Hewlett Packard Enterprises Market Share
      6. 8.7.6. Recent Initiatives, Funding/VC Activities, and Technological Innovations
    8. 8.8. ArangoDB
      1. 8.8.1. Company Overview
      2. 8.8.2. Product/Service Portfolio
      3. 8.8.3. ArangoDB Sales, Revenue, and Gross Margin
      4. 8.8.4. ArangoDB Revenue and Growth Rate
      5. 8.8.5. ArangoDB Market Share
      6. 8.8.6. Recent Initiatives, Funding/VC Activities, and Technological Innovations
    9. 8.9. Blazegraph
      1. 8.9.1. Company Overview
      2. 8.9.2. Product/Service Portfolio
      3. 8.9.3. Blazegraph Sales, Revenue, and Gross Margin
      4. 8.9.4. Blazegraph Revenue and Growth Rate
      5. 8.9.5. Blazegraph Market Share
      6. 8.9.6. Recent Initiatives, Funding/VC Activities, and Technological Innovations
    10. 8.10. Microsoft Corporation
      1. 8.10.1. Company Overview
      2. 8.10.2. Product/Service Portfolio
      3. 8.10.3. Microsoft Corporation Sales, Revenue, and Gross Margin
      4. 8.10.4. Microsoft Corporation Revenue and Growth Rate
      5. 8.10.5. Microsoft Corporation Market Share
      6. 8.10.6. Recent Initiatives, Funding/VC Activities, and Technological Innovations
    11. 8.11. TIBCO Software Inc
      1. 8.11.1. Company Overview
      2. 8.11.2. Product/Service Portfolio
      3. 8.11.3. TIBCO Software Inc Sales, Revenue, and Gross Margin
      4. 8.11.4. TIBCO Software Inc Revenue and Growth Rate
      5. 8.11.5. TIBCO Software Inc Market Share
      6. 8.11.6. Recent Initiatives, Funding/VC Activities, and Technological Innovations
    12. 8.12. Neo4j Inc
      1. 8.12.1. Company Overview
      2. 8.12.2. Product/Service Portfolio
      3. 8.12.3. Neo4j Inc Sales, Revenue, and Gross Margin
      4. 8.12.4. Neo4j Inc Revenue and Growth Rate
      5. 8.12.5. Neo4j Inc Market Share
      6. 8.12.6. Recent Initiatives, Funding/VC Activities, and Technological Innovations
    13. 8.13. GraphBase
      1. 8.13.1. Company Overview
      2. 8.13.2. Product/Service Portfolio
      3. 8.13.3. GraphBase Sales, Revenue, and Gross Margin
      4. 8.13.4. GraphBase Revenue and Growth Rate
      5. 8.13.5. GraphBase Market Share
      6. 8.13.6. Recent Initiatives, Funding/VC Activities, and Technological Innovations
    14. 8.14. Cambridge Semantic
      1. 8.14.1. Company Overview
      2. 8.14.2. Product/Service Portfolio
      3. 8.14.3. Cambridge Semantic Sales, Revenue, and Gross Margin
      4. 8.14.4. Cambridge Semantic Revenue and Growth Rate
      5. 8.14.5. Cambridge Semantic Market Share
      6. 8.14.6. Recent Initiatives, Funding/VC Activities, and Technological Innovations
    15. 8.15. TigerGraph Inc
      1. 8.15.1. Company Overview
      2. 8.15.2. Product/Service Portfolio
      3. 8.15.3. TigerGraph Inc Sales, Revenue, and Gross Margin
      4. 8.15.4. TigerGraph Inc Revenue and Growth Rate
      5. 8.15.5. TigerGraph Inc Market Share
      6. 8.15.6. Recent Initiatives, Funding/VC Activities, and Technological Innovations
    16. 8.16. Dgraph Labs
      1. 8.16.1. Company Overview
      2. 8.16.2. Product/Service Portfolio
      3. 8.16.3. Dgraph Labs Sales, Revenue, and Gross Margin
      4. 8.16.4. Dgraph Labs Revenue and Growth Rate
      5. 8.16.5. Dgraph Labs Market Share
      6. 8.16.6. Recent Initiatives, Funding/VC Activities, and Technological Innovations
    17. 8.17. Eccenca
      1. 8.17.1. Company Overview
      2. 8.17.2. Product/Service Portfolio
      3. 8.17.3. Eccenca Sales, Revenue, and Gross Margin
      4. 8.17.4. Eccenca Revenue and Growth Rate
      5. 8.17.5. Eccenca Market Share
      6. 8.17.6. Recent Initiatives, Funding/VC Activities, and Technological Innovations
  9. Chapter 9 Graph Database — Industry Analysis
    1. 9.1. Introduction and Taxonomy
    2. 9.2. Graph Database Market – Key Trends
      1. 9.2.1. Market Drivers
      2. 9.2.2. Market Restraints
      3. 9.2.3. Market Opportunities
    3. 9.3. Value Chain Analysis
    4. 9.4. Key Mandates and Regulations
    5. 9.5. Technology Roadmap and Timeline
    6. 9.6. Graph Database Market – Attractiveness Analysis
      1. 9.6.1. By Component
      2. 9.6.2. By Type
      3. 9.6.3. By Industry Vertical
      4. 9.6.4. By Application
      5. 9.6.5. By Region
  10. Chapter 10 Industrial Chain, Sourcing Strategy, and Downstream Buyers
    1. 10.1. Graph Database Industrial Chain Analysis
    2. 10.2. Downstream Buyers
    3. 10.3. Distributors/Traders List
  11. Chapter 11 Marketing Strategy Analysis
    1. 11.1. Marketing Channel
    2. 11.2. Direct Marketing
    3. 11.3. Indirect Marketing
    4. 11.4. Marketing Channel Development Trends
    5. 11.5. Economic/Political Environmental Change
  12. Chapter 12 Report Conclusion & Key Insights
    1. 12.1. Key Insights from Primary Interviews & Surveys Respondents
    2. 12.2. Key Takeaways from Analysts, Consultants, and Industry Leaders
  13. Chapter 13 Research Approach & Methodology
    1. 13.1. Report Description
    2. 13.2. Research Scope
    3. 13.3. Research Methodology
      1. 13.3.1. Secondary Research
      2. 13.3.2. Primary Research
      3. 13.3.3. Statistical Models
        1. 13.3.3.1. Company Share Analysis Model
        2. 13.3.3.2. Revenue Based Modeling
      4. 13.3.4. Research Limitations

      List of Figures

      Fig.1	Product Picture of Graph Database
      Fig.2	Global Graph Database Market, 2016 – 2026 (USD Billion)
      Fig.3	Global Graph Database Market Absolute Revenue Opportunity, 2016 – 2026 (USD Billion)
      Fig.4	Global Graph Database Market Incremental Revenue Opportunity, 2020 – 2026 (USD Billion)
      Fig.5	Global Graph Database Market Share, by Component, 2019 & 2026 (USD Billion)
      Fig.6	Global Software Graph Database Market, 2016 – 2026 (USD Billion)
      Fig.7	Global Services Graph Database Market, 2016 – 2026 (USD Billion)
      Fig.8	Global Graph Database Market Share, by Type, 2019 & 2026 (USD Billion)
      Fig.9	Global RDF  Graph Database Market, 2016 – 2026 (USD Billion)
      Fig.10	Global Labeled Property Graph Graph Database Market, 2016 – 2026 (USD Billion)
      Fig.11	Global Graph Database Market Share, by Industry Vertical, 2019 & 2026 (USD Billion)
      Fig.12	Global Banking & Financial Services  Graph Database Market, 2016 – 2026 (USD Billion)
      Fig.13	Global Manufacturing  Graph Database Market, 2016 – 2026 (USD Billion)
      Fig.14	Global Retail & E-Commerce  Graph Database Market, 2016 – 2026 (USD Billion)
      Fig.15	Global Telecom & IT  Graph Database Market, 2016 – 2026 (USD Billion)
      Fig.16	Global Logistics Graph Database Market, 2016 – 2026 (USD Billion)
      Fig.17	Global Others Graph Database Market, 2016 – 2026 (USD Billion)
      Fig.18	Global Graph Database Market Share, by Application, 2019 & 2026 (USD Billion)
      Fig.19	Global Customer Analytics Graph Database Market, 2016 – 2026 (USD Billion)
      Fig.20	Global Risk Management & Fraud Detection Graph Database Market, 2016 – 2026 (USD Billion)
      Fig.21	Global Recommendation Engines Graph Database Market, 2016 – 2026 (USD Billion)
      Fig.22	Global Others Graph Database Market, 2016 – 2026 (USD Billion)
      Fig.23	Global Graph Database Market Share, by Region, 2019 & 2026 (USD Billion)
      Fig.24	North America Graph Database Market, 2016 – 2026 (USD Billion)
      Fig.25	U.S. Graph Database Market, 2016 – 2026 (USD Billion)
      Fig.26	Canada Graph Database Market, 2016 – 2026 (USD Billion)
      Fig.27	Europe Graph Database Market, 2016 – 2026 (USD Billion)
      Fig.28	Germany Graph Database Market, 2016 – 2026 (USD Billion)
      Fig.29	France Graph Database Market, 2016 – 2026 (USD Billion)
      Fig.30	U.K. Graph Database Market, 2016 – 2026 (USD Billion)
      Fig.31	Italy Graph Database Market, 2016 – 2026 (USD Billion)
      Fig.32	Spain Graph Database Market, 2016 – 2026 (USD Billion)
      Fig.33	Rest of Europe Graph Database Market, 2016 – 2026 (USD Billion)
      Fig.34	Asia Pacific Graph Database Market, 2016 – 2026 (USD Billion)
      Fig.35	China Graph Database Market, 2016 – 2026 (USD Billion)
      Fig.36	Japan Graph Database Market, 2016 – 2026 (USD Billion)
      Fig.37	India Graph Database Market, 2016 – 2026 (USD Billion)
      Fig.38	South  Korea Graph Database Market, 2016 – 2026 (USD Billion)
      Fig.39	South-East Asia Graph Database Market, 2016 – 2026 (USD Billion)
      Fig.40	Rest of Asia Pacific Graph Database Market, 2016 – 2026 (USD Billion)
      Fig.41	Latin America Graph Database Market, 2016 – 2026 (USD Billion)
      Fig.42	Brazil Graph Database Market, 2016 – 2026 (USD Billion)
      Fig.43	Mexico Graph Database Market, 2016 – 2026 (USD Billion)
      Fig.44	Rest of Latin America Graph Database Market, 2016 – 2026 (USD Billion)
      Fig.45	The Middle-East and Africa Graph Database Market, 2016 – 2026 (USD Billion)
      Fig.46	GCC Countries Graph Database Market, 2016 – 2026 (USD Billion)
      Fig.47	South Africa Graph Database Market, 2016 – 2026 (USD Billion)
      Fig.48	Rest of Middle-East Africa Graph Database Market, 2016 – 2026 (USD Billion)
      Fig.49	Competitor Market Share – Revenue
      Fig.50	Oracle Corporation Revenue and Growth Rate
      Fig.51	Oracle Corporation Market Share
      Fig.52	IBM Corporation Revenue and Growth Rate
      Fig.53	IBM Corporation Market Share
      Fig.54	Amazon Web Services Revenue and Growth Rate
      Fig.55	Amazon Web Services Market Share
      Fig.56	DataStax Revenue and Growth Rate
      Fig.57	DataStax Market Share
      Fig.58	Ontotext Revenue and Growth Rate
      Fig.59	Ontotext Market Share
      Fig.60	Stardog Union Revenue and Growth Rate
      Fig.61	Stardog Union Market Share
      Fig.62	Hewlett Packard Enterprises Revenue and Growth Rate
      Fig.63	Hewlett Packard Enterprises Market Share
      Fig.64	ArangoDB Revenue and Growth Rate
      Fig.65	ArangoDB Market Share
      Fig.66	Blazegraph Revenue and Growth Rate
      Fig.67	Blazegraph Market Share
      Fig.68	Microsoft Corporation Revenue and Growth Rate
      Fig.69	Microsoft Corporation Market Share
      Fig.70	TIBCO Software Inc Revenue and Growth Rate
      Fig.71	TIBCO Software Inc Market Share
      Fig.72	Neo4j Inc Revenue and Growth Rate
      Fig.73	Neo4j Inc Market Share
      Fig.74	GraphBase Revenue and Growth Rate
      Fig.75	GraphBase Market Share
      Fig.76	Cambridge Semantic Revenue and Growth Rate
      Fig.77	Cambridge Semantic Market Share
      Fig.78	TigerGraph Inc Revenue and Growth Rate
      Fig.79	TigerGraph Inc Market Share
      Fig.80	Dgraph Labs Revenue and Growth Rate
      Fig.81	Dgraph Labs Market Share
      Fig.82	Eccenca Revenue and Growth Rate
      Fig.83	Eccenca Market Share
      Fig.84	Market Dynamics
      Fig.85	Global Graph Database – Value Chain Analysis
      Fig.86	Key Mandates and Regulations
      Fig.87	Technology Roadmap and Timeline
      Fig.88	Market Attractiveness Analysis – By Component
      Fig.89	Market Attractiveness Analysis – By Type
      Fig.90	Market Attractiveness Analysis – By Industry Vertical
      Fig.91	Market Attractiveness Analysis – By Application
      Fig.92	Market Attractiveness Analysis – By Region
      Fig.93	Graph Database Industrial Chain Analysis
      Fig.94	Market Channels
      Fig.95	Marketing Channel Development Trend
      Fig.96	Growth in World Gross Product, 2008-2018
      

      List of Tables

      Table 1	Global Graph Database Market, 2019 & 2026 (USD Billion)
      Table 2	Global Graph Database Market, by Component, 2016 – 2026 (USD Billion)
      Table 3	Global Graph Database Market, by Type, 2016 – 2026 (USD Billion)
      Table 4	Global Graph Database Market, by Industry Vertical, 2016 – 2026 (USD Billion)
      Table 5	Global Graph Database Market, by Application, 2016 – 2026 (USD Billion)
      Table 6	Global Graph Database Market, by Region, 2016 – 2026 (USD Billion)
      Table 7	North America Graph Database Market, by Country, 2016 – 2026 (USD Billion)
      Table 8	North America Graph Database Market, by Component, 2016 – 2026 (USD Billion)
      Table 9	North America Graph Database Market, by Type, 2016 – 2026 (USD Billion)
      Table 10 North America Graph Database Market, by Industry Vertical, 2016 – 2026 (USD Billion)
      Table 11 North America Graph Database Market, by Application, 2016 – 2026 (USD Billion)
      Table 12 Europe Graph Database Market, by Country, 2016 – 2026 (USD Billion)
      Table 13 Europe Graph Database Market, by Component, 2016 – 2026 (USD Billion)
      Table 14 Europe Graph Database Market, by Type, 2016 – 2026 (USD Billion)
      Table 15 Europe Graph Database Market, by Industry Vertical, 2016 – 2026 (USD Billion)
      Table 16 Europe Graph Database Market, by Application, 2016 – 2026 (USD Billion)
      Table 17 Asia Pacific Graph Database Market, by Country, 2016 – 2026 (USD Billion)
      Table 18 Asia Pacific Graph Database Market, by Component, 2016 – 2026 (USD Billion)
      Table 19 Asia Pacific Graph Database Market, by Type, 2016 – 2026 (USD Billion)
      Table 20 Asia Pacific Graph Database Market, by Industry Vertical, 2016 – 2026 (USD Billion)
      Table 21 Asia Pacific Graph Database Market, by Application, 2016 – 2026 (USD Billion)
      Table 22 Latin America Graph Database Market, by Country, 2016 – 2026 (USD Billion)
      Table 23 Latin America Graph Database Market, by Component, 2016 – 2026 (USD Billion)
      Table 24 Latin America Graph Database Market, by Type, 2016 – 2026 (USD Billion)
      Table 25 Latin America Graph Database Market, by Industry Vertical, 2016 – 2026 (USD Billion)
      Table 26 Latin America Graph Database Market, by Application, 2016 – 2026 (USD Billion)
      Table 27 The Middle-East and Africa Graph Database Market, by Country, 2016 – 2026 (USD Billion)
      Table 28 The Middle-East and Africa Graph Database Market, by Component, 2016 – 2026 (USD Billion)
      Table 29 The Middle-East and Africa Graph Database Market, by Type, 2016 – 2026 (USD Billion)
      Table 30 The Middle-East and Africa Graph Database Market, by Industry Vertical, 2016 – 2026 (USD Billion)
      Table 31 The Middle-East and Africa Graph Database Market, by Application, 2016 – 2026 (USD Billion)
      Table 32 Global Graph Database Market - Company Revenue Analysis, 2016 – 2019 (USD Billion)
      Table 33 Global Graph Database Market - Company Revenue Share Analysis, 2016 – 2019 (%)
      Table 34 Acquisitions and Mergers
      Table 35 Market Drivers – Impact Analysis
      Table 36 Market Restraints
      Table 37 Market Opportunities
      Table 38 Major Buyers of Graph Database
      Table 39 Distributors/Traders of Graph Database by Region
      

Industry Major Market Players

  • Oracle Corporation
  • IBM Corporation
  • Amazon Web Services
  • DataStax
  • Ontotext
  • Stardog Union
  • Hewlett Packard Enterprises
  • ArangoDB
  • Blazegraph
  • Microsoft Corporation
  • TIBCO Software Inc.
  • Neo4j Inc.
  • GraphBase
  • Cambridge Semantic
  • TigerGraph Inc.
  • Dgraph Labs
  • Eccenca