Search Market Research Report

Discover Our Latest Reports
Discover Our Featured Reports
Discover Top Selling Reports

Visualization and 3D Rendering Software Market Size, Share Global Analysis Report, 2020–2026

report img

Visualization and 3D Rendering Software Market By Deployment Type (On-Premises and Cloud-Based), By End-User (Healthcare & Life Sciences, Architecture, Building, and Construction, Media & Entertainment, Design & Engineering, Academia, and Others), By Application (High-End Video Games, Architectural & Product Visualization, Training Simulation, and Marketing & Advertisement), and By Region: Global Industry Outlook, Market Size, Business Intelligence, Consumer Preferences, Statistical Surveys, Comprehensive Analysis, Historical Developments, Current Trends, and Forecast 2020–2026

Industry Insights

This specialized and expertise oriented industry research report scrutinizes the technical and commercial business outlook of the Visualization and 3D Rendering Software industry. The report analyzes and declares the historical and current trends analysis of the Visualization and 3D Rendering Software industry and subsequently recommends the projected trends anticipated to be observed in the global Visualization and 3D Rendering Software market during the upcoming years.

Global Visualization and 3D Rendering Software Market Size

To know more about this report | Request Free Sample Copy

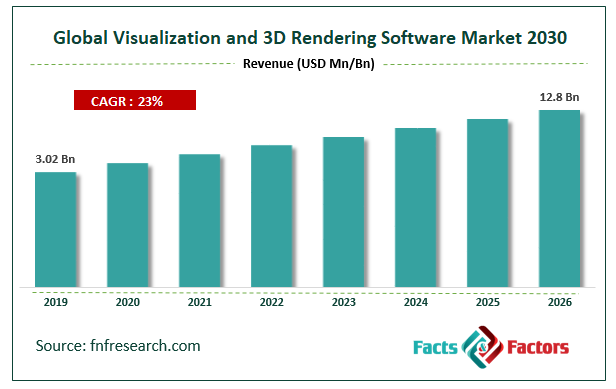
The global Visualization and 3D Rendering Software market report analyzes and notifies the industry statistics at the global as well as regional and country levels in order to acquire a thorough perspective of the entire Visualization and 3D Rendering Software market. The historical and past insights are provided for FY 2016 to FY 2019 whereas projected trends are delivered for FY 2020 to FY 2026. The quantitative and numerical data is represented in terms of value (USD Billion) from FY 2016 – 2026.

The quantitative data is further underlined and reinforced by comprehensive qualitative data which comprises various across-the-board market dynamics. The rationales which directly or indirectly impact the Visualization and 3D Rendering Software industry are exemplified through parameters such as growth drivers, restraints, challenges, and opportunities among other impacting factors.

Throughout our research report, we have encompassed all the proven models and tools of industry analysis and extensively illustrated all the key business strategies and business models adopted in the Visualization and 3D Rendering Software industry. The report provides an all-inclusive and detailed competitive landscape prevalent in the global Visualization and 3D Rendering Software market.

logoReport Scope

Report Attribute

Details

Market Size in 2019

USD 3.02 Billion

Projected Market Size in 2026

USD 12.8 Billion

CAGR Growth Rate

23% CAGR

Base Year

2019

Forecast Years

2020–2026

Key Market Players

Render Legion S.R.O., Autodesk, Inc., Adobe Systems, The Foundry Visionmongers Ltd., Dassault Systèmes, Siemens AG, Trimble, Inc., SAP SE, Next Limit Technologies, Corel Corporation, Chaos Group, NVIDIA Corporation, Luxion, Inc., NewTek, Inc., and Cristie Digital Systems.

Key Segment

By Offering, By Application, By Region

Major Regions Covered

North America, Europe, Asia Pacific, Latin America, and the Middle East & Africa

Purchase Options

Request customized purchase options to meet your research needs. Explore purchase options

The report utilizes established industry analysis tools and models such as Porter’s Five Forces framework to analyze and recognize critical business strategies adopted by various stakeholders involved in the entire value chain of the Visualization and 3D Rendering Software industry. The global Visualization and 3D Rendering Software market report additionally employs SWOT analysis and PESTLE analysis models for further in-depth analysis.

The report study further includes an in-depth analysis of industry players' market shares and provides an overview of leading players' market position in the Visualization and 3D Rendering Software sector. Key strategic developments in the global Visualization and 3D Rendering Software market competitive landscape such as acquisitions & mergers, inaugurations of different products and services, partnerships & joint ventures, MoU agreements, VC & funding activities, R&D activities, and geographic expansion among other noteworthy activities by key players of the global Visualization and 3D Rendering Software market are appropriately highlighted in the report.

Visualization and 3D rendering is a means of creating plus processing 3D models into 3D photorealistic images for further application in the design and engineering, media and entertainment, healthcare and life sciences, architecture, building and construction, and academia, and other sectors.

The growing demand for photo-realistic and professional visualization of future development in the design and engineering, architecture, building and construction, media and entertainment, and healthcare and life sciences is anticipated to boost the global Visualization and 3D Rendering Software market. The user-friendly interface of these software and plugins and add-ons offers a plethora of tools for creating photorealistic, high-level videography & gaming, and 3D rendered visuals, thereby surging its popularity. The high resolution, perfection, and quality of product designs in the engineering and healthcare or life science platform also aids in the market development. However, lack of infrastructure & technical experts, high hardware cost, and lack of adaptability of existing infrastructure pose a challenge for the market growth.

The global Visualization and 3D Rendering Software market research report delivers an acute valuation and taxonomy of the Visualization and 3D Rendering Software industry by practically splitting the market on the basis of different deployment types, end-user, applications, and regions. Through the analysis of the historical and projected trends, all the segments and sub-segments were evaluated through the bottom-up approach, and different market sizes have been projected for FY 2020 to FY 2026. The regional segmentation of the Visualization and 3D Rendering Software industry includes the complete classification of all the major continents including North America, Latin America, Europe, Asia Pacific, and Middle East & Africa. Further, country-wise data for the Visualization and 3D Rendering Software industry is provided for the leading economies of the world.

The global Visualization and 3D Rendering Software market is segmented based on Deployment Type, End-User, and Application. On the basis of deployment type, the market for visualization and 3D rendering software is divided into On-Premises and Cloud-Based. By the end-user, the market is segmented into Healthcare & Life Sciences, Architecture, Building, and Construction, Media & Entertainment, Design & Engineering, Academia, and Others. Based on application, the global Visualization and 3D Rendering Software market is sectored into High-End Video Games, Architectural & Product Visualization, Training Simulation, and Marketing & Advertisement.

logoSome of the essential players operating in the global Visualization and 3D Rendering Software market, but not restricted to include

  • Render Legion S.R.O.
  • Autodesk Inc.
  • Adobe Systems
  • The Foundry Visionmongers Ltd.
  • Dassault Systèmes
  • Siemens AG
  • Trimble Inc.
  • SAP SE
  • Next Limit Technologies
  • Corel Corporation
  • Chaos Group
  • NVIDIA Corporation
  • Luxion Inc.
  • NewTek Inc.
  • Cristie Digital Systems.

The taxonomy of the Visualization and 3D Rendering Software industry by its scope and segmentation is as follows:

logo Deployment Type Segmentation Analysis

  • On-Premises
  • Cloud-Based

logo Application Segmentation Analysis

  • Architectural & Product Visualization
  • High-End Video Games
  • Marketing & Advertisement
  • Training Simulation

logo End-User Segmentation Analysis

  • Architecture, Building, and Construction
  • Media & Entertainment
  • Design & Engineering
  • Healthcare & Life Sciences
  • Academia
  • Others

logo Regional Segmentation Analysis

  • North America
    • The U.S.
    • Canada
  • Europe
    • Germany
    • The UK
    • France
    • Spain
    • Italy
    • Rest of Europe
  • Asia Pacific
    • China
    • Japan
    • India
    • South Korea
    • Southeast Asia
    • Rest of Asia Pacific
  • Latin America
    • Brazil
    • Mexico
    • Rest of Latin America
  • Middle East & Africa
    • GCC
    • South Africa
    • Rest of Middle East & Africa

Table of Content

  1. CHAPTER 1. Executive Summary
  2. CHAPTER 2. Visualization and 3D Rendering Software market – Deployment Type Analysis
    1. 2.1. Global Visualization and 3D Rendering Software Market – Deployment Type Overview
    2. 2.2. Global Visualization and 3D Rendering Software Market Share, by Deployment Type, 2018 & 2025 (USD Billion)
    3. 2.3. On-Premises
      1. 2.3.1. Global On-Premises Visualization and 3D Rendering Software Market, 2016-2026 (USD Billion)
    4. 2.4. Cloud-Based
      1. 2.4.1. Global Cloud-Based Visualization and 3D Rendering Software Market, 2016-2026 (USD Billion)
  3. CHAPTER 3. Visualization and 3D Rendering Software market – End-User Analysis
    1. 3.1. Global Visualization and 3D Rendering Software Market – End-User Overview
    2. 3.2. Global Visualization and 3D Rendering Software Market Share, by End-User, 2018 & 2025 (USD Billion)
    3. 3.3. Healthcare & Life Sciences
      1. 3.3.1. Global Healthcare & Life Sciences Visualization and 3D Rendering Software Market, 2016-2026 (USD Billion)
    4. 3.4. Architecture
      1. 3.4.1. Global Architecture Visualization and 3D Rendering Software Market, 2016-2026 (USD Billion)
    5. 3.5. Building and Construction
      1. 3.5.1. Global Building and Construction Visualization and 3D Rendering Software Market, 2016-2026 (USD Billion)
    6. 3.6. Media & Entertainment
      1. 3.6.1. Global Media & Entertainment Visualization and 3D Rendering Software Market, 2016-2026 (USD Billion)
    7. 3.7. Design & Engineering
      1. 3.7.1. Global Design & Engineering Visualization and 3D Rendering Software Market, 2016-2026 (USD Billion)
    8. 3.8. Academia
      1. 3.8.1. Global Academia Visualization and 3D Rendering Software Market, 2016-2026 (USD Billion)
    9. 3.9. Others
      1. 3.9.1. Global Others Visualization and 3D Rendering Software Market, 2016-2026 (USD Billion)
  4. CHAPTER 4. Visualization and 3D Rendering Software market – Application Analysis
    1. 4.1. Global Visualization and 3D Rendering Software Market – Application Overview
    2. 4.2. Global Visualization and 3D Rendering Software Market Share, by Application, 2018 & 2025 (USD Billion)
    3. 4.3. High-End Video Games
      1. 4.3.1. Global High-End Video Games Visualization and 3D Rendering Software Market, 2016-2026 (USD Billion)
    4. 4.4. Architectural & Product Visualization
      1. 4.4.1. Global Architectural & Product Visualization Visualization and 3D Rendering Software Market, 2016-2026 (USD Billion)
    5. 4.5. Training Simulation
      1. 4.5.1. Global Training Simulation Visualization and 3D Rendering Software Market, 2016-2026 (USD Billion)
    6. 4.6. Marketing & Advertisement
      1. 4.6.1. Global Marketing & Advertisement Visualization and 3D Rendering Software Market, 2016-2026 (USD Billion)
  5. CHAPTER 5. Visualization and 3D Rendering Software market – Regional Analysis
    1. 5.1. Global Visualization and 3D Rendering Software Market Regional Overview
    2. 5.2. Global Visualization and 3D Rendering Software Market Share, by Region, 2018 & 2025 (Value)
    3. 5.3. North America
      1. 5.3.1. North America Visualization and 3D Rendering Software Market size and forecast, 2016-2026
      2. 5.3.2. North America Visualization and 3D Rendering Software Market, by Country, 2018 & 2025 (USD Billion)
      3. 5.3.3. North America Visualization and 3D Rendering Software Market, by Deployment Type, 2016-2026
        1. 5.3.3.1. North America Visualization and 3D Rendering Software Market, by Deployment Type, 2016-2026 (USD Billion)
      4. 5.3.4. North America Visualization and 3D Rendering Software Market, by End-User, 2016-2026
        1. 5.3.4.1. North America Visualization and 3D Rendering Software Market, by End-User, 2016-2026 (USD Billion)
      5. 5.3.5. North America Visualization and 3D Rendering Software Market, by Application, 2016-2026
        1. 5.3.5.1. North America Visualization and 3D Rendering Software Market, by Application, 2016-2026 (USD Billion)
      6. 5.3.6. U.S.
        1. 5.3.6.1. U.S. Market size and forecast, 2016-2026 (USD Billion)
      7. 5.3.7. Canada
        1. 5.3.7.1. Canada Market size and forecast, 2016-2026 (USD Billion)
    4. 5.4. Europe
      1. 5.4.1. Europe Visualization and 3D Rendering Software Market size and forecast, 2016-2026
      2. 5.4.2. Europe Visualization and 3D Rendering Software Market, by Country, 2018 & 2025 (USD Billion)
      3. 5.4.3. Europe Visualization and 3D Rendering Software Market, by Deployment Type, 2016-2026
        1. 5.4.3.1. Europe Visualization and 3D Rendering Software Market, by Deployment Type, 2016-2026 (USD Billion)
      4. 5.4.4. Europe Visualization and 3D Rendering Software Market, by End-User, 2016-2026
        1. 5.4.4.1. Europe Visualization and 3D Rendering Software Market, by End-User, 2016-2026 (USD Billion)
      5. 5.4.5. Europe Visualization and 3D Rendering Software Market, by Application, 2016-2026
        1. 5.4.5.1. Europe Visualization and 3D Rendering Software Market, by Application, 2016-2026 (USD Billion)
      6. 5.4.6. Germany
        1. 5.4.6.1. Germany Market size and forecast, 2016-2026 (USD Billion)
      7. 5.4.7. France
        1. 5.4.7.1. France Market size and forecast, 2016-2026 (USD Billion)
      8. 5.4.8. U.K.
        1. 5.4.8.1. U.K. Market size and forecast, 2016-2026 (USD Billion)
      9. 5.4.9. Italy
        1. 5.4.9.1. Italy Market size and forecast, 2016-2026 (USD Billion)
      10. 5.4.10. Spain
        1. 5.4.10.1. Spain Market size and forecast, 2016-2026 (USD Billion)
      11. 5.4.11. Rest of Europe
        1. 5.4.11.1. Rest of Europe Market size and forecast, 2016-2026 (USD Billion)
    5. 5.5. Asia Pacific
      1. 5.5.1. Asia Pacific Visualization and 3D Rendering Software Market size and forecast, 2016-2026
      2. 5.5.2. Asia Pacific Visualization and 3D Rendering Software Market, by Country, 2018 & 2025 (USD Billion)
      3. 5.5.3. Asia Pacific Visualization and 3D Rendering Software Market, by Deployment Type, 2016-2026
        1. 5.5.3.1. Asia Pacific Visualization and 3D Rendering Software Market, by Deployment Type, 2016-2026 (USD Billion)
      4. 5.5.4. Asia Pacific Visualization and 3D Rendering Software Market, by End-User, 2016-2026
        1. 5.5.4.1. Asia Pacific Visualization and 3D Rendering Software Market, by End-User, 2016-2026 (USD Billion)
      5. 5.5.5. Asia Pacific Visualization and 3D Rendering Software Market, by Application, 2016-2026
        1. 5.5.5.1. Asia Pacific Visualization and 3D Rendering Software Market, by Application, 2016-2026 (USD Billion)
      6. 5.5.6. China
        1. 5.5.6.1. China Market size and forecast, 2016-2026 (USD Billion)
      7. 5.5.7. Japan
        1. 5.5.7.1. Japan Market size and forecast, 2016-2026 (USD Billion)
      8. 5.5.8. India
        1. 5.5.8.1. India Market size and forecast, 2016-2026 (USD Billion)
      9. 5.5.9. South Korea
        1. 5.5.9.1. South Korea Market size and forecast, 2016-2026 (USD Billion)
      10. 5.5.10. South-East Asia
        1. 5.5.10.1. South-East Asia Market size and forecast, 2016-2026 (USD Billion)
      11. 5.5.11. Rest of Asia Pacific
        1. 5.5.11.1. Rest of Asia Pacific Market size and forecast, 2016-2026 (USD Billion)
    6. 5.6. Latin America
      1. 5.6.1. Latin America Visualization and 3D Rendering Software Market size and forecast, 2016-2026
      2. 5.6.2. Latin America Visualization and 3D Rendering Software Market, by Country, 2018 & 2025 (USD Billion)
      3. 5.6.3. Latin America Visualization and 3D Rendering Software Market, by Deployment Type, 2016-2026
        1. 5.6.3.1. Latin America Visualization and 3D Rendering Software Market, by Deployment Type, 2016-2026 (USD Billion)
      4. 5.6.4. Latin America Visualization and 3D Rendering Software Market, by End-User, 2016-2026
        1. 5.6.4.1. Latin America Visualization and 3D Rendering Software Market, by End-User, 2016-2026 (USD Billion)
      5. 5.6.5. Latin America Visualization and 3D Rendering Software Market, by Application, 2016-2026
        1. 5.6.5.1. Latin America Visualization and 3D Rendering Software Market, by Application, 2016-2026 (USD Billion)
      6. 5.6.6. Brazil
        1. 5.6.6.1. Brazil Market size and forecast, 2016-2026 (USD Billion)
      7. 5.6.7. Mexico
        1. 5.6.7.1. Mexico Market size and forecast, 2016-2026 (USD Billion)
      8. 5.6.8. Rest of Latin America
        1. 5.6.8.1. Rest of Latin America Market size and forecast, 2016-2026 (USD Billion)
    7. 5.7. The Middle-East and Africa
      1. 5.7.1. The Middle-East and Africa Visualization and 3D Rendering Software Market size and forecast, 2016-2026
      2. 5.7.2. The Middle-East and Africa Visualization and 3D Rendering Software Market, by Country, 2018 & 2025 (USD Billion)
      3. 5.7.3. The Middle-East and Africa Visualization and 3D Rendering Software Market, by Deployment Type, 2016-2026
        1. 5.7.3.1. The Middle-East and Africa Visualization and 3D Rendering Software Market, by Deployment Type, 2016-2026 (USD Billion)
      4. 5.7.4. The Middle-East and Africa Visualization and 3D Rendering Software Market, by End-User, 2016-2026
        1. 5.7.4.1. The Middle-East and Africa Visualization and 3D Rendering Software Market, by End-User, 2016-2026 (USD Billion)
      5. 5.7.5. The Middle-East and Africa Visualization and 3D Rendering Software Market, by Application, 2016-2026
        1. 5.7.5.1. The Middle-East and Africa Visualization and 3D Rendering Software Market, by Application, 2016-2026 (USD Billion)
      6. 5.7.6. GCC Countries
        1. 5.7.6.1. GCC Countries Market size and forecast, 2016-2026 (USD Billion)
      7. 5.7.7. South Africa
        1. 5.7.7.1. South Africa Market size and forecast, 2016-2026 (USD Billion)
      8. 5.7.8. Rest of Middle-East Africa
        1. 5.7.8.1. Rest of Middle-East Africa Market size and forecast, 2016-2026 (USD Billion)
  6. CHAPTER 6. Visualization and 3D Rendering Software market – Competitive Landscape
    1. 6.1. Competitor Market Share – Revenue
    2. 6.2. Market Concentration Rate Analysis, Top 3 and Top 5 Players
    3. 6.3. Strategic Development
      1. 6.3.1. Acquisitions and Mergers
      2. 6.3.2. New Products
      3. 6.3.3. Research & Development Activities
  7. CHAPTER 7. Company Profiles
    1. 7.1. Render Legion S.R.O.
      1. 7.1.1. Company Overview
      2. 7.1.2. Render Legion S.R.O. Revenue and Gross Margin
      3. 7.1.3. Product portfolio
      4. 7.1.4. Recent initiatives
    2. 7.2. Autodesk Inc.
      1. 7.2.1. Company Overview
      2. 7.2.2. Autodesk Inc. Revenue and Gross Margin
      3. 7.2.3. Product portfolio
      4. 7.2.4. Recent initiatives
    3. 7.3. Adobe Systems
      1. 7.3.1. Company Overview
      2. 7.3.2. Adobe Systems Revenue and Gross Margin
      3. 7.3.3. Product portfolio
      4. 7.3.4. Recent initiatives
    4. 7.4. The Foundry Visionmongers Ltd.
      1. 7.4.1. Company Overview
      2. 7.4.2. The Foundry Visionmongers Ltd. Revenue and Gross Margin
      3. 7.4.3. Product portfolio
      4. 7.4.4. Recent initiatives
    5. 7.5. Dassault Systèmes
      1. 7.5.1. Company Overview
      2. 7.5.2. Dassault Systèmes Revenue and Gross Margin
      3. 7.5.3. Product portfolio
      4. 7.5.4. Recent initiatives
    6. 7.6. Siemens AG
      1. 7.6.1. Company Overview
      2. 7.6.2. Siemens AG Revenue and Gross Margin
      3. 7.6.3. Product portfolio
      4. 7.6.4. Recent initiatives
    7. 7.7. Trimble Inc.
      1. 7.7.1. Company Overview
      2. 7.7.2. Trimble Inc. Revenue and Gross Margin
      3. 7.7.3. Product portfolio
      4. 7.7.4. Recent initiatives
    8. 7.8. SAP SE
      1. 7.8.1. Company Overview
      2. 7.8.2. SAP SE Revenue and Gross Margin
      3. 7.8.3. Product portfolio
      4. 7.8.4. Recent initiatives
    9. 7.9. Next Limit Technologies
      1. 7.9.1. Company Overview
      2. 7.9.2. Next Limit Technologies Revenue and Gross Margin
      3. 7.9.3. Product portfolio
      4. 7.9.4. Recent initiatives
    10. 7.10. Corel Corporation
      1. 7.10.1. Company Overview
      2. 7.10.2. Corel Corporation Revenue and Gross Margin
      3. 7.10.3. Product portfolio
      4. 7.10.4. Recent initiatives
    11. 7.11. Chaos group
      1. 7.11.1. Company Overview
      2. 7.11.2. Chaos group Revenue and Gross Margin
      3. 7.11.3. Product portfolio
      4. 7.11.4. Recent initiatives
    12. 7.12. NVIDIA Corporation
      1. 7.12.1. Company Overview
      2. 7.12.2. NVIDIA Corporation Revenue and Gross Margin
      3. 7.12.3. Product portfolio
      4. 7.12.4. Recent initiatives
    13. 7.13. Luxion Inc.
      1. 7.13.1. Company Overview
      2. 7.13.2. Luxion Inc. Revenue and Gross Margin
      3. 7.13.3. Product portfolio
      4. 7.13.4. Recent initiatives
    14. 7.14. NewTek Inc.
      1. 7.14.1. Company Overview
      2. 7.14.2. NewTek Inc. Revenue and Gross Margin
      3. 7.14.3. Product portfolio
      4. 7.14.4. Recent initiatives
    15. 7.15. Cristie Digital Systems
      1. 7.15.1. Company Overview
      2. 7.15.2. Cristie Digital Systems Revenue and Gross Margin
      3. 7.15.3. Product portfolio
      4. 7.15.4. Recent initiatives
  8. CHAPTER 8. Visualization and 3D Rendering Software — Industry Analysis
    1. 8.1. Visualization and 3D Rendering Software Market – Key Trends
      1. 8.1.1. Market Drivers
      2. 8.1.2. Market Restraints
      3. 8.1.3. Market Opportunities
    2. 8.2. Value Chain Analysis
    3. 8.3. Technology Roadmap and Timeline
    4. 8.4. Visualization and 3D Rendering Software Market – Attractiveness Analysis
      1. 8.4.1. By Deployment Type
      2. 8.4.2. By End-User
      3. 8.4.3. By Application
      4. 8.4.4. By Region
  9. CHAPTER 9. Marketing Strategy Analysis, Distributors
    1. 9.1. Marketing Channel
    2. 9.2. Direct Marketing
    3. 9.3. Indirect Marketing
    4. 9.4. Marketing Channel Development Trend
    5. 9.5. Economic/Political Environmental Change
  10. CHAPTER 10. Report Conclusion
  11. CHAPTER 11. Research Approach & Methodology
    1. 11.1. Report Description
    2. 11.2. Research Scope
    3. 11.3. Research Methodology
      1. 11.3.1. Secondary Research
      2. 11.3.2. Primary Research
      3. 11.3.3. Models
        1. 11.3.3.1. Company Share Analysis Model
        2. 11.3.3.2. Revenue Based Modeling
        3. 11.3.3.3. Research Limitations

        List of Figures

        FIG. 1 Global Visualization and 3D Rendering Software Market, 2016-2026 (USD Billion)
        FIG. 2 Global Visualization and 3D Rendering Software Market Share, by Deployment Type, 2018 & 2025 (USD Billion)
        FIG. 3 Global On-Premises Visualization and 3D Rendering Software Market, 2016-2026 (USD Billion)
        FIG. 4 Global Cloud-Based Visualization and 3D Rendering Software Market, 2016-2026 (USD Billion)
        FIG. 5 Global Visualization and 3D Rendering Software Market Share, by End-User, 2018 & 2025 (USD Billion)
        FIG. 6 Global Healthcare & Life Sciences Visualization and 3D Rendering Software Market, 2016-2026 (USD Billion)
        FIG. 7 Global Architecture Visualization and 3D Rendering Software Market, 2016-2026 (USD Billion)
        FIG. 8 Global Building and Construction Visualization and 3D Rendering Software Market, 2016-2026 (USD Billion)
        FIG. 9 Global Media & Entertainment Visualization and 3D Rendering Software Market, 2016-2026 (USD Billion)
        FIG. 10 Global Design & Engineering Visualization and 3D Rendering Software Market, 2016-2026 (USD Billion)
        FIG. 11 Global Academia Visualization and 3D Rendering Software Market, 2016-2026 (USD Billion)
        FIG. 12 Global Others Visualization and 3D Rendering Software Market, 2016-2026 (USD Billion)
        FIG. 13 Global Visualization and 3D Rendering Software Market Share, by Application, 2018 & 2025 (USD Billion)
        FIG. 14 Global High-End Video Games Visualization and 3D Rendering Software Market, 2016-2026 (USD Billion)
        FIG. 15 Global Architectural & Product Visualization Visualization and 3D Rendering Software Market, 2016-2026 (USD Billion)
        FIG. 16 Global Training Simulation Visualization and 3D Rendering Software Market, 2016-2026 (USD Billion)
        FIG. 17 Global Marketing & Advertisement Visualization and 3D Rendering Software Market, 2016-2026 (USD Billion)
        FIG. 18 Global Visualization and 3D Rendering Software Market Share, by Region, 2018 & 2025
        FIG. 19 North America Visualization and 3D Rendering Software Market, 2016-2026
        FIG. 20 U.S. Visualization and 3D Rendering Software Market, 2016-2026
        FIG. 21 Canada Visualization and 3D Rendering Software Market, 2016-2026
        FIG. 22 Europe Visualization and 3D Rendering Software Market, 2016-2026
        FIG. 23 Germany Visualization and 3D Rendering Software Market, 2016-2026
        FIG. 24 France Visualization and 3D Rendering Software Market, 2016-2026
        FIG. 25 U.K. Visualization and 3D Rendering Software Market, 2016-2026
        FIG. 26 Italy Visualization and 3D Rendering Software Market, 2016-2026
        FIG. 27 Spain Visualization and 3D Rendering Software Market, 2016-2026
        FIG. 28 Rest of Europe Visualization and 3D Rendering Software Market, 2016-2026
        FIG. 29 Asia Pacific Visualization and 3D Rendering Software Market, 2016-2026
        FIG. 30 China Visualization and 3D Rendering Software Market, 2016-2026
        FIG. 31 Japan Visualization and 3D Rendering Software Market, 2016-2026
        FIG. 32 India Visualization and 3D Rendering Software Market, 2016-2026
        FIG. 33 South  Korea Visualization and 3D Rendering Software Market, 2016-2026
        FIG. 34 South-East Asia Visualization and 3D Rendering Software Market, 2016-2026
        FIG. 35 Rest of Asia Pacific Visualization and 3D Rendering Software Market, 2016-2026
        FIG. 36 Latin America Visualization and 3D Rendering Software Market, 2016-2026
        FIG. 37 Brazil Visualization and 3D Rendering Software Market, 2016-2026
        FIG. 38 Mexico Visualization and 3D Rendering Software Market, 2016-2026
        FIG. 39 Rest of Latin America Visualization and 3D Rendering Software Market, 2016-2026
        FIG. 40 The Middle-East and Africa Visualization and 3D Rendering Software Market, 2016-2026
        FIG. 41 GCC Countries Visualization and 3D Rendering Software Market, 2016-2026
        FIG. 42 South Africa Visualization and 3D Rendering Software Market, 2016-2026
        FIG. 43 Rest of Middle-East Africa Visualization and 3D Rendering Software Market, 2016-2026
        FIG. 44 Competitor Market Share – Revenue
        FIG. 45 Render Legion S.R.O. Revenue and Growth Rate
        FIG. 46 Render Legion S.R.O. Market Share
        FIG. 47 Autodesk Inc. Revenue and Growth Rate
        FIG. 48 Autodesk Inc. Market Share
        FIG. 49 Adobe Systems Revenue and Growth Rate
        FIG. 50 Adobe Systems Market Share
        FIG. 51 The Foundry Visionmongers Ltd. Revenue and Growth Rate
        FIG. 52 The Foundry Visionmongers Ltd. Market Share
        FIG. 53 Dassault Systèmes Revenue and Growth Rate
        FIG. 54 Dassault Systèmes Market Share
        FIG. 55 Siemens AG Revenue and Growth Rate
        FIG. 56 Siemens AG Market Share
        FIG. 57 Trimble Inc. Revenue and Growth Rate
        FIG. 58 Trimble Inc. Market Share
        FIG. 59 SAP SE Revenue and Growth Rate
        FIG. 60 SAP SE Market Share
        FIG. 61 Next Limit Technologies Revenue and Growth Rate
        FIG. 62 Next Limit Technologies Market Share
        FIG. 63 Corel Corporation Revenue and Growth Rate
        FIG. 64 Corel Corporation Market Share
        FIG. 65 Chaos group Revenue and Growth Rate
        FIG. 66 Chaos group Market Share
        FIG. 67 NVIDIA Corporation Revenue and Growth Rate
        FIG. 68 NVIDIA Corporation Market Share
        FIG. 69 Luxion Inc. Revenue and Growth Rate
        FIG. 70 Luxion Inc. Market Share
        FIG. 71 NewTek Inc. Revenue and Growth Rate
        FIG. 72 NewTek Inc. Market Share
        FIG. 73 Cristie Digital Systems Revenue and Growth Rate
        FIG. 74 Cristie Digital Systems Market Share
        FIG. 75 Market Dynamics
        FIG. 76 Global Visualization and 3D Rendering Software – Value Chain Analysis
        FIG. 77 Technology Roadmap and Timeline
        FIG. 78 Market Attractiveness Analysis – By Deployment Type
        FIG. 79 Market Attractiveness Analysis – By End-User
        FIG. 80 Market Attractiveness Analysis – By Application
        FIG. 81 Market Attractiveness Analysis – By Region
        FIG. 82 Market Channel
        FIG. 83 Marketing Channel Development Trend
        FIG. 84 Growth in World Gross Product, 2008-2018

        List of Tables

        TABLE 1 Global Visualization and 3D Rendering Software Market, 2018 & 2025 (USD Billion)
        TABLE 2 Global Visualization and 3D Rendering Software market, by Deployment Type, 2016-2026 (USD Billion)
        TABLE 3 Global Visualization and 3D Rendering Software market, by End-User, 2016-2026 (USD Billion)
        TABLE 4 Global Visualization and 3D Rendering Software market, by Application, 2016-2026 (USD Billion)
        TABLE 5 Global Visualization and 3D Rendering Software market, by Region, 2016-2026 (USD Billion)
        TABLE 6 North America Visualization and 3D Rendering Software Market, by Deployment Type, 2016-2026 (USD Billion)
        TABLE 7 North America Visualization and 3D Rendering Software Market, by End-User, 2016-2026 (USD Billion)
        TABLE 8 North America Visualization and 3D Rendering Software Market, by Application, 2016-2026 (USD Billion)
        TABLE 9 Europe Visualization and 3D Rendering Software Market, by Deployment Type, 2016-2026 (USD Billion)
        TABLE 10 Europe Visualization and 3D Rendering Software Market, by End-User, 2016-2026 (USD Billion)
        TABLE 11 Europe Visualization and 3D Rendering Software Market, by Application, 2016-2026 (USD Billion)
        TABLE 12 Asia Pacific Visualization and 3D Rendering Software Market, by Deployment Type, 2016-2026 (USD Billion)
        TABLE 13 Asia Pacific Visualization and 3D Rendering Software Market, by End-User, 2016-2026 (USD Billion)
        TABLE 14 Asia Pacific Visualization and 3D Rendering Software Market, by Application, 2016-2026 (USD Billion)
        TABLE 15 Latin America Visualization and 3D Rendering Software Market, by Deployment Type, 2016-2026 (USD Billion)
        TABLE 16 Latin America Visualization and 3D Rendering Software Market, by End-User, 2016-2026 (USD Billion)
        TABLE 17 Latin America Visualization and 3D Rendering Software Market, by Application, 2016-2026 (USD Billion)
        TABLE 18 The Middle-East and Africa Visualization and 3D Rendering Software Market, by Deployment Type, 2016-2026 (USD Billion)
        TABLE 19 The Middle-East and Africa Visualization and 3D Rendering Software Market, by End-User, 2016-2026 (USD Billion)
        TABLE 20 The Middle-East and Africa Visualization and 3D Rendering Software Market, by Application, 2016-2026 (USD Billion)
        TABLE 21 Global Visualization and 3D Rendering Software Market - Company Revenue Analysis 2016-2019 (USD Billion)
        TABLE 22 Global Visualization and 3D Rendering Software Market - Company Revenue Share Analysis 2016-2019(%)
        TABLE 23 Acquisitions and Mergers
        TABLE 24 New Product/Service Launch
        TABLE 25 Research & Development Activities
        TABLE 26 Market Drivers
        TABLE 27 Market Restraints
        TABLE 28 Market Opportunities

Industry Major Market Players

  •  Render Legion S.R.O.
  •  Autodesk  Inc.
  •  Adobe Systems
  •  The Foundry Visionmongers Ltd.
  •  Dassault Systèmes
  •  Siemens AG
  •  Trimble  Inc.
  •  SAP SE
  •  Next Limit Technologies
  •  Corel Corporation
  •  Chaos group
  •  NVIDIA Corporation
  •  Luxion Inc.
  •  NewTek Inc.
  •  Cristie Digital Systems.