![]()
Search Market Research Report
Screenless Display Market Size, Share Global Analysis Report, 2020–2026

Screenless Display Market By Type (Visual Image, Virtual Retinal Display, and Synaptic Interface), By Application (Holographic Projections, Head-Mounted Display, and Head-Up Display), By Vertical (Automotive, Healthcare, Consumer Electronics, Aerospace & Defense, and Commercial), and By Region: Global Industry Outlook, Market Size, Business Intelligence, Consumer Preferences, Statistical Surveys, Comprehensive Analysis, Historical Developments, Current Trends, and Forecast 2020–2026
Industry Insights
This specialized and expertise oriented industry research report scrutinizes the technical and commercial business outlook of the Screenless Display industry. The report analyzes and declares the historical and current trends analysis of the Screenless Display industry and subsequently recommends the projected trends anticipated to be observed in the global Screenless Display market during the upcoming years.
The Screenless Display market report analyzes and notifies the industry statistics at the global as well as regional and country levels in order to acquire a thorough perspective of the entire Screenless Display market. The historical and past insights are provided for FY 2016 to FY 2019 whereas projected trends are delivered for FY 2020 to FY 2026. The quantitative and numerical data is represented in terms of both volume (Units) and value (USD Million) from FY 2016 – 2026.
The quantitative data is further underlined and reinforced by comprehensive qualitative data which comprises various across-the-board market dynamics. The rationales which directly or indirectly impact the Screenless Display industry are exemplified through parameters such as growth drivers, restraints, challenges, and opportunities among other impacting factors.
Throughout our research report, we have encompassed all the proven models and tools of industry analysis and extensively illustrated all the key business strategies and business models adopted in the Screenless Display industry. The report provides an all-inclusive and detailed competitive landscape prevalent in the global Screenless Display market.
The report utilizes established industry analysis tools and models such as Porter’s Five Forces framework to analyze and recognize critical business strategies adopted by various stakeholders involved in the entire value chain of the Screenless Display industry. The global Screenless Display market report additionally employs SWOT analysis and PESTLE analysis models for further in-depth analysis.
The report study further includes an in-depth analysis of industry players' market shares and provides an overview of leading players' market position in the Screenless Display sector. Key strategic developments in the global Screenless Display market competitive landscape such as acquisitions & mergers, inaugurations of different products and services, partnerships & joint ventures, MoU agreements, VC & funding activities, R&D activities, and geographic expansion among other noteworthy activities by key players of the global Screenless Display market are appropriately highlighted in the report.
Screenless display is an interactive projection technology that is designed to help solve issues related to device miniaturization of modern communication technologies. It is an emerging technology in the field of displays. These displays will help users to display and transmit information without the need for any screens or projectors. The increasing investments in the screenless displays technology could reduce the entire hardware components manufacturing cost is likely to bolster the global Screenless Display market growth.
The factors expected to propel the growth of the global Screenless Display market is the rising demand for power-efficient and wider angle view gadgets in comparison to usual screen displays. Furthermore, the requirement for portable devices is also surging owing to the space constraint issues in the commercial, residential, and professional sectors, thereby escalating the market growth. The growing inclination of consumers toward the latest gizmos and gadgets coupled with technological advancements in the screen display sector is expected to fuel the market for screenless displays. However, the high cost of the screenless displays, high expenditure on the manufacturing of new kinds of displays and technologies, and the lack of knowledge about the benefits of screenless displays are factors believed to hamper the global market growth. The problems associated with the screen’s close interaction between the eyes could also restrain the Screenless Display market growth.
The global Screenless Display market research report delivers an acute valuation and taxonomy of the Screenless Display industry by practically splitting the market on the basis of different types, applications, vertical, and regions. Through the analysis of the historical and projected trends, all the segments and sub-segments were evaluated through the bottom-up approach, and different market sizes have been projected for FY 2020 to FY 2026. The regional segmentation of the Screenless Display industry includes the complete classification of all the major continents including North America, Latin America, Europe, Asia Pacific, and Middle East & Africa. Further, country-wise data for the Screenless Display industry is provided for the leading economies of the world.
The global Screenless Display market is segmented based on Type, Application, and Vertical. On the basis of type segmentation, the Screenless Display market is Visual Image, Virtual Retinal Display, and Synaptic Interface. By application, the market is divided into Holographic Projections, Head-Mounted Display, and Head-Up Display. Based on vertical, the market for screenless display is segregated into Automotive, Healthcare, Consumer Electronics, Aerospace & Defense, and Commercial.
 Report Scope
Report Attribute |
Details |
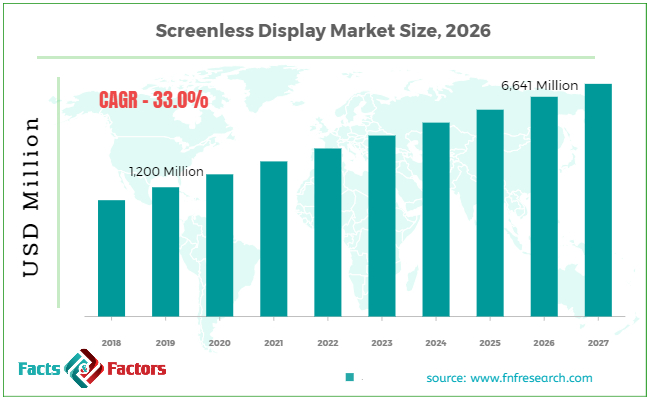
Market Size in 2019 |
USD 1,200 Million |
Projected Market Size in 2026 |
USD 6641 Million |
Growth Rate |
CAGR 33% |
Base Year |
2019 |
Forecast Years |
2020-2026 |
Key Market Players |
Synaptic Incorporated, Avegant Corporation, Google, Inc.,MicroVision, Inc., Microsoft Corporation, Esterline Technologies Corp., Displair, EON Reality, Inc., BAE Systems, and RealView Imaging Ltd. |
Key Segment |
By Type, By Application, By Vertical, and By Region |
Major Regions Covered |
North America, Europe, Asia Pacific, Latin America, and the Middle East & Africa |
Purchase Options |
Request customized purchase options to meet your research needs. Explore purchase options |
Some of the essential players operating in the global Screenless Display market, but not restricted to include
- Synaptic Incorporated
- Avegant Corporation
- Google Inc.
- MicroVision Inc.
- Microsoft Corporation
- Esterline Technologies Corp.
- Displair
- EON Reality Inc.
- BAE Systems
- RealView Imaging Ltd.
The taxonomy of the Screenless Display industry by its scope and segmentation is as follows:
Type Segmentation Analysis
- Visual Image
- Virtual Retinal Display
- Synaptic Interface
Application Segmentation Analysis
- Holographic Projections
- Head-mounted Display
- Head-up Display
Vertical Segmentation Analysis
- Aerospace & Defense
- Automotive
- Healthcare
- Consumer Electronics
- Commercial
Regional Segmentation Analysis
- North America
- The U.S.
- Canada
- Europe
- Germany
- The UK
- France
- Spain
- Italy
- Rest of Europe
- Asia Pacific
- China
- Japan
- India
- South Korea
- Southeast Asia
- Rest of Asia Pacific
- Latin America
- Brazil
- Mexico
- Rest of Latin America
- Middle East & Africa
- GCC
- South Africa
- Rest of Middle East & Africa
Table of Content
Industry Major Market Players
- Synaptic Incorporated
- Avegant Corporation
- Google Inc.
- MicroVision Inc.
- Microsoft Corporation
- Esterline Technologies Corp.
- Displair
- EON Reality Inc.
- BAE Systems
- RealView Imaging Ltd.


Copyright © 2025 - 2026, All Rights Reserved, Facts and Factors