![]()
Search Market Research Report
Retinal Imaging Devices Market Size, Share Global Analysis Report, 2020–2026

Retinal Imaging Devices Market By Type (Fundus Camera, Optical Coherence Tomography, and Fluorescein Angiography), By End-User (Hospitals, ASCs, Ophthalmic Centers, and Others), And By Region: Global Industry Outlook, Market Size, Business Intelligence, Consumer Preferences, Statistical Surveys, Comprehensive Analysis, Historical Developments, Current Trends, and Forecast 2020–2026
Industry Insights
This specialized and expertise oriented industry research report scrutinizes the technical and commercial business outlook of the global retinal imaging devices industry. The report analyzes and declares the historical and current trends analysis of the global retinal imaging devices industry and subsequently recommends the projected trends anticipated to be observed in the global retinal imaging devices market during the upcoming years.
The global retinal imaging devices market report analyzes and notifies the industry statistics at the global as well as regional and country levels in order to acquire a thorough perspective of the entire global retinal imaging devices market. The historical and past insights are provided for FY 2016 to FY 2019 whereas projected trends are delivered for FY 2020 to FY 2026. The quantitative and numerical data is represented in terms of value (USD Billion) from FY 2016 – 2026.
The quantitative data is further underlined and reinforced by comprehensive qualitative data which comprises various across-the-board market dynamics. The rationales which directly or indirectly impact the global retinal imaging devices industry are exemplified through parameters such as growth drivers, restraints, challenges, and opportunities among other impacting factors.
Throughout our research report, we have encompassed all the proven models and tools of industry analysis and extensively illustrated all the key business strategies and business models adopted in the global retinal imaging devices industry. The report provides an all-inclusive and detailed competitive landscape prevalent in the global retinal imaging devices market.
The report utilizes established industry analysis tools and models such as Porter’s Five Forces framework to analyze and recognize critical business strategies adopted by various stakeholders involved in the entire value chain of the global retinal imaging devices industry. The global retinal imaging devices market report additionally employs SWOT analysis and PESTLE analysis models for further in-depth analysis.
The report study further includes an in-depth analysis of industry players' market shares and provides an overview of leading players' market position in the global retinal imaging devices sector. Key strategic developments in the global retinal imaging devices market competitive landscape such as acquisitions & mergers, inaugurations of different products and services, partnerships & joint ventures, MoU agreements, VC & funding activities, R&D activities, and geographic expansion among other noteworthy activities by key players of the global retinal imaging devices market are appropriately highlighted in the report.
Retinal imaging devices are considered as effective medical equipment to diagnose and treat retinal disorders. The superior retinal imaging technology in devices can capture 0 to 200 degrees of the retinal area in a single shot. In conventional devices, a broad spectrum of visible light was utilized for imaging retina. However, the latest retinal imaging devices are based on low-powered laser light. Glaucoma, diabetic retinopathy, cancer, age-related macular degeneration, and various eye-related disorders are precisely diagnosed and treated using retinal imaging devices. Moreover, the devices have potential applications in diagnosing complicated neurodegenerative diseases (ND). The growth in the global retinal imaging devices market is attributed to the considerably rising incidences of vision loss and diabetic retinopathy among adults, as the pool of diabetic patients across the world has been expanding substantially from the past few years.
The global retinal imaging devices market research report delivers an acute valuation and taxonomy of the global retinal imaging devices industry by practically splitting the market on the basis of different types, end-users, and regions. Through the analysis of the historical and projected trends, all the segments and sub-segments were evaluated through the bottom-up approach, and different market sizes have been projected for FY 2020 to FY 2026. The regional segmentation of the global retinal imaging devices industry includes the complete classification of all the major continents including North America, Latin America, Europe, Asia Pacific, and Middle East & Africa. Further, country-wise data for the global retinal imaging devices industry is provided for the leading economies of the world.
The global retinal imaging devices market is segmented based on the type, end-user, and region. The type segment categorizes the global retinal imaging devices industry into fundus camera, optical coherence tomography, and fluorescein angiography. By end-user, the global market is sectored into hospitals, ASCs, ophthalmic centers, and others.
 Report Scope
Report Attribute |
Details |
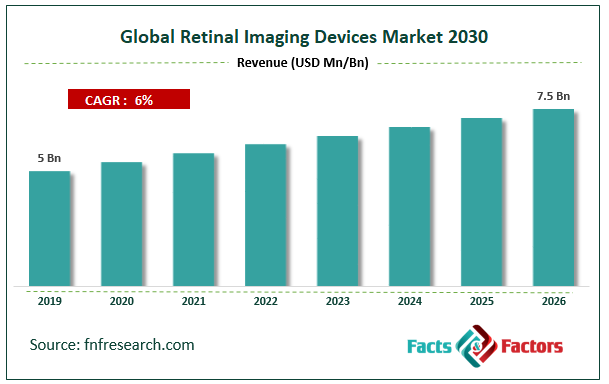
Market Size in 2019 |
USD 5 Billion |
Projected Market Size in 2026 |
USD 7.5 Billion |
Growth Rate |
CAGR 6% |
Base Year |
2019 |
Forecast Years |
2020-2026 |
Key Market Players |
Robert Bosch GmbH, Optomed, Forus Health, ZEISS International, Nidek Co. Ltd., Topcon Corporation, Centerveu, Optos plc, Eyenuk Inc., Olympus, and Epipole Ltd., among others. |
Key Segment |
By Type, By End-User, and By Region |
Major Regions Covered |
North America, Europe, Asia Pacific, Latin America, and the Middle East & Africa |
Purchase Options |
Request customized purchase options to meet your research needs. Explore purchase options |
Some of the essential players operating in the global retinal imaging devices market, but not restricted to include
- Robert Bosch GmbH
- Optomed
- Forus Health
- ZEISS International
- Nidek Co. Ltd.
- Topcon Corporation
- Centerveu
- Optos plc
- Eyenuk Inc.
- Olympus
- Epipole Ltd.
- among others.
The taxonomy of the global retinal imaging devices industry by its scope and segmentation is as follows:
Type Segmentation Analysis
- Fluorescein Angiography
- Optical Coherence Tomography
- Fundus Camera
End-User Segmentation Analysis
- Hospitals & Clinics
- Specialized Eye Care Centres
- Ambulatory Surgical Centres
- Others
Regional Segmentation Analysis
- North America
- The U.S.
- Canada
- Europe
- Germany
- The UK
- France
- Spain
- Italy
- Rest of Europe
- Asia Pacific
- China
- Japan
- India
- South Korea
- Southeast Asia
- Rest of Asia Pacific
- Latin America
- Brazil
- Mexico
- Rest of Latin America
- Middle East & Africa
- GCC
- South Africa
- Rest of Middle East & Africa
Table of Content
Industry Major Market Players
- Robert Bosch GmbH
- Optomed
- Forus Health
- ZEISS International
- Nidek Co. Ltd.
- Topcon Corporation
- Centerveu
- Optos plc
- Eyenuk Inc.
- Olympus
- Epipole Ltd.


Copyright © 2025 - 2026, All Rights Reserved, Facts and Factors