![]()
Search Market Research Report
Rare Sugars Market Size, Share Global Analysis Report, 2020–2026

Rare Sugars Market By Product (D-Mannose, Allulose, Tagatose, D-Xylose, L-Arabinose, L-Fucose, and Others), By Application (Dietary Supplements, Cosmetics & Personal Care, Pharmaceuticals, Food & Beverages, and Others), and By Region: Global Industry Outlook, Market Size, Business Intelligence, Consumer Preferences, Statistical Surveys, Comprehensive Analysis, Historical Developments, Current Trends, and Forecast 2020–2026
Industry Insights
This specialized and expertise oriented industry research report scrutinizes the technical and commercial business outlook of the Rare Sugars industry. The report analyzes and declares the historical and current trends analysis of the Rare Sugars industry and subsequently recommends the projected trends anticipated to be observed in the global Rare Sugars market during the upcoming years.
The global Rare Sugars market report analyzes and notifies the industry statistics at the global as well as regional and country levels in order to acquire a thorough perspective of the entire Rare Sugars market. The historical and past insights are provided for FY 2016 to FY 2019 whereas projected trends are delivered for FY 2020 to FY 2026. The quantitative and numerical data is represented in terms of both volume (Kilo Tons) and value (USD Billion) from FY 2016 – 2026.
The quantitative data is further underlined and reinforced by comprehensive qualitative data which comprises various across-the-board market dynamics. The rationales which directly or indirectly impact the Rare Sugars industry are exemplified through parameters such as growth drivers, restraints, challenges, and opportunities among other impacting factors.
Throughout our research report, we have encompassed all the proven models and tools of industry analysis and extensively illustrated all the key business strategies and business models adopted in the Rare Sugars industry. The report provides an all-inclusive and detailed competitive landscape prevalent in the global Rare Sugars market.
The report utilizes established industry analysis tools and models such as Porter’s Five Forces framework to analyze and recognize critical business strategies adopted by various stakeholders involved in the entire value chain of the Rare Sugars industry. The global Rare Sugars market report additionally employs SWOT analysis and PESTLE analysis models for further in-depth analysis.
The report study further includes an in-depth analysis of industry players' market shares and provides an overview of leading players' market position in the Rare Sugars sector. Key strategic developments in the global Rare Sugars market competitive landscape such as acquisitions & mergers, inaugurations of different products and services, partnerships & joint ventures, MoU agreements, VC & funding activities, R&D activities, and geographic expansion among other noteworthy activities by key players of the global Rare Sugars market are appropriately highlighted in the report.
Rare sugar is present in the natural products in smaller amounts. This basic type of carbohydrate are made through the organic procedures including fermentation & enzyme conversion. The rare sugars are used as additives in antiviral medications and cosmetics. The growing demand for rare sugars in food & beverage industry owing to the awareness regarding low glycemic index and its substitute to table sugar will accelerate the growth of the global Rare Sugars market.
Increasing prevalence of diabetes and more awareness regarding health beneficial options such as rare sugars as a substitute to table sugars will propel the expansion of the Rare Sugars market. Furthermore, the increasing number of people opting for weight management by adopting rare sugars to avoid the formation of fat accumulating enzymes is projected to upsurge the market growth. The high demand for digestion and metabolism improving alternatives to avoid gastric acids formation, cholesterol, and sugar levels. Apart from this, the stringent government regulations regarding the use or mentioning of sugar counts on the dietary supplements will further promulgate the Rare Sugars industry.
The global Rare Sugars market research report delivers an acute valuation and taxonomy of the Rare Sugars industry by practically splitting the market on the basis of different product, application, and regions. Through the analysis of the historical and projected trends, all the segments and sub-segments were evaluated through the bottom-up approach, and different market sizes have been projected for FY 2020 to FY 2026. The regional segmentation of the Rare Sugars industry includes the complete classification of all the major continents including North America, Latin America, Europe, Asia Pacific, and Middle East & Africa. Further, country-wise data for the Rare Sugars industry is provided for the leading economies of the world.
The global Rare Sugars market is segmented based on Product and Application. On the basis of product segmentation, the market is classified into D-Mannose, Allulose, Tagatose, D-Xylose, L-Arabinose, L-Fucose, and Others. By application, the market for rare sugars is segregated into Dietary Supplements, Cosmetics & Personal Care, Pharmaceuticals, Food & Beverages, and Others.
 Report Scope
Report Attribute |
Details |
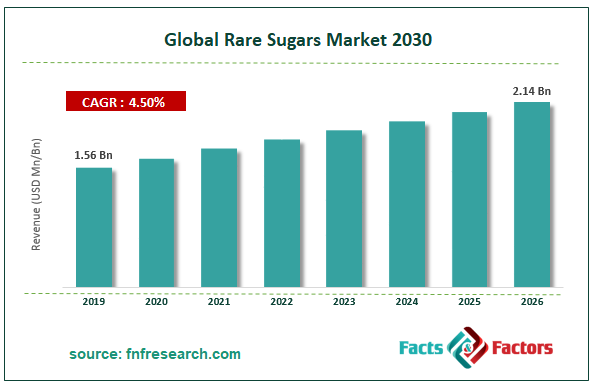
Market Size in 2019 |
USD 1.56 Billion |
Projected Market Size in 2026 |
USD 2.14 Billion |
Growth Rate |
CAGR 4.5% |
Base Year |
2019 |
Forecast Years |
2020-2026 |
Key Market Players |
Matsutami Chemical industry, DuPont, Douglas Laboratories, Sanwa Starch, Specom Biochemical, Sweet Cures, ASTRAEA Allulose, Naturesupplies, and Hebei Huaxu. |
Key Segment |
By Product, By Application, and By Region |
Major Regions Covered |
North America, Europe, Asia Pacific, Latin America, and the Middle East & Africa |
Purchase Options |
Request customized purchase options to meet your research needs. Explore purchase options |
Some of the essential players operating in the global Rare Sugars market, but not restricted to include
- Matsutami Chemical industry
- DuPont
- Douglas Laboratories
- Sanwa Starch
- Specom Biochemical
- Sweet Cures
- ASTRAEA Allulose
- Naturesupplies
- Hebei Huaxu.
The taxonomy of the Rare Sugars industry by its scope and segmentation is as follows:
By Type Segmentation Analysis
- D-Mannose
- Allulose
- Tagatose
- D-Xylose
- L-Arabinose
- L-Fucose
- Others
By Application Segmentation Analysis
- Dietary Supplements
- Cosmetics & Personal Care
- Pharmaceuticals
- Food & Beverages
- Others
Regional Segmentation Analysis
- North America
- The U.S.
- Canada
- Europe
- Germany
- The UK
- France
- Spain
- Italy
- Rest of Europe
- Asia Pacific
- China
- Japan
- India
- South Korea
- Southeast Asia
- Rest of Asia Pacific
- Latin America
- Brazil
- Mexico
- Rest of Latin America
- Middle East & Africa
- GCC
- South Africa
- Rest of Middle East & Africa
Table of Content
Industry Major Market Players
- Matsutami Chemical industry
- DuPont
- Douglas Laboratories
- Sanwa Starch
- Specom Biochemical
- Sweet Cures
- ASTRAEA Allulose
- Naturesupplies
- Hebei Huaxu


Copyright © 2025 - 2026, All Rights Reserved, Facts and Factors