Search Market Research Report

Discover Our Latest Reports
Discover Our Featured Reports
Discover Top Selling Reports

Plant Genomics Market Size, Share Global Analysis Report, 2023 – 2030

report img

Plant Genomics Market Size, Share, Growth Analysis Report By Type (Molecular Engineering, Genetic Engineering, and Others), By Trait (Disease Resistance, Herbicide Tolerance, Yield Improvement, and Others), By Objective (GENE Expression Profiling, DNA Extraction & Purification, DNA/RNA Sequencing, Marker-Assisted Selection, Genotyping, GMO-Trait Purity Testing, and Others), By Application (Fruits & Vegetables, Cereals & Grains, Oilseeds & Pulses, and Others), nd By Region - Global and Regional Industry Insights, Overview, Comprehensive Analysis, Trends, Statistical Research, Market Intelligence, Historical Data and Forecast 2023 – 2030

Industry Insights

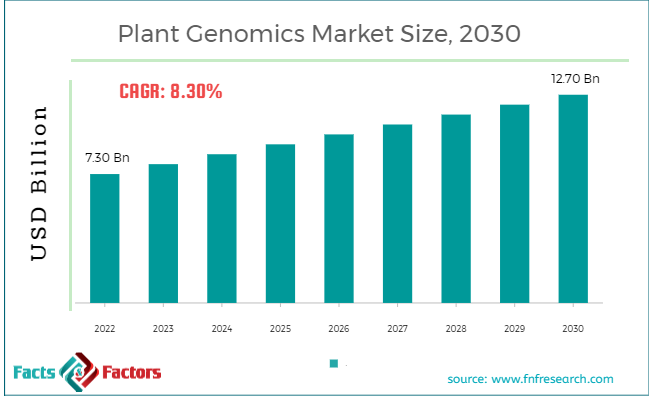
[180+ Pages Report] According to the report published by Facts and Factors, the global Plant Genomics market size was valued at around USD 7.30 billion in 2022 and is expected to surpass around USD 12.70 billion by 2030 with a compound annual growth rate (CAGR) of roughly 8.23% between 2023 and 2030. The report analyses the global Plant Genomics market drivers, restraints/challenges, and the effect they have on the demands during the projection period. In addition, the report analyses emerging opportunities in the Plant Genomics market.

plant-genomics-market-size

To know more about this report | Request Free Sample Copy

Our research analysts have used reliable market research tools to provide complete details about the global Plant Genomics market. The trusted methodologies have helped the analysts provide the global Plant Genomics market size in terms of USD Billion. The report provides historical data from 2019 to 2021 and forecasts from 2022 to 2030. The research report gives complete knowledge about the Plant Genomics market statistics and dynamics on a global and regional level. The report provides emerging trends, challenges & opportunities, competitive players, and valuation of the global Plant Genomics market.

The trusted methodologies and intense study performed by the analysts help in systematically presenting the trends and challenges of the market. Our research report presents all the important data regarding market players, regional segmentation, market hindrances, strategic alliances, business models, and market shares.

The report offers vital aspects including mergers, acquisitions, new launches, and new avenues that will help the market expansion during the forecast period. The market-oriented and commercial research study involves extensive use of Porter’s Five Forces, PESTEL analysis, and SWOT analysis to identify all the microscopic and megascopic factors that have a direct or indirect impact on the global Plant Genomics market.

logoReport Scope

Report Attribute

Details

Market Size in 2022

USD 7.30 Billion

Projected Market Size in 2030

USD 12.70 Billion

CAGR Growth Rate

8.30% CAGR

Base Year

2022

Forecast Years

2023-2030

Key Market Players

NRGene, Eurofins Scientific, Qiagen, Illumina Inc., Neogen Corporation, Agilent Technologies, LC Sciences, KeyGene, Traitgenetics GmbH, Oxford Nanopore Technologies, Novogene Corporation, Genewiz, Floragenex, BGI Genomics, Genotypic Technologies, and Others

Key Segment

By Type, Trait, Objective, Application, and Region

Major Regions Covered

North America, Europe, Asia Pacific, Latin America, and the Middle East & Africa

Purchase Options

Request customized purchase options to meet your research needs. Explore purchase options

Plant genomics basically deals with bringing about alterations in the compositions, genetic structures, functions, organizations, and interactions/networks of a whole plant genome using various advanced tools. The application of genomics in plant breeding and conservation of genetic resources is gaining a lot of popularity across the globe and thus, in turn, helping the market growth.

The increasing investments in the biotechnology research on food crops along with the increasing food requirements and reducing poverty aid the global Plant Genomics market growth.

With the burgeoning advancements in plant technology, new crops can be created to ensure high productivity. Apart from this, the rising demand for food security is also anticipated to help market growth. Other factors including escalating demand for improved crop varieties, the cost-effectiveness of genomics, and the increase in plant genome funding are projected to drive the growth of the global Plant Genomics market.

logoSegmentation Analysis Analysis:

On the basis of type, the global Plant Genomics market is segmented into Molecular Engineering, Genetic Engineering, and Others. In terms of Traits, the market is sectored into Herbicide Tolerance, Disease Resistance, Yield Improvement, and Others. Based on the objective, the industry is divided into Marker-Assisted Selection, DNA Extraction & Purification, GENE Expression Profiling, DNA/RNA Sequencing, Genotyping, GMO-Trait Purity Testing, and Others. Based on the application, the global Plant Genomics market is segregated into Fruits & Vegetables, Cereals & Grains, Oilseeds & Pulses, and Others.

Some of the key players in the global Plant Genomics market include NRGene, Eurofins Scientific, Qiagen, Illumina, Inc., Neogen Corporation, Agilent Technologies, LC Sciences, KeyGene, Traitgenetics GmbH, Oxford Nanopore Technologies, Novogene Corporation, Genewiz, Floragenex, BGI Genomics, and Genotypic Technologies.

logoCompetitive Landscape:

  • NRGene
  • Eurofins Scientific
  • Qiagen
  • Illumina Inc.
  • Neogen Corporation
  • Agilent Technologies
  • LC Sciences
  • KeyGene
  • Traitgenetics GmbH
  • Oxford Nanopore Technologies
  • Novogene Corporation
  • Genewiz
  • Floragenex
  • BGI Genomics
  • Genotypic Technologies

Global Plant Genomics market is segmented into:

logo By Type

  • Molecular Engineering
  • Genetic Engineering
  • Others

logo By Trait

  • Yield Improvement
  • Disease Resistance
  • Herbicide Tolerance
  • Others

logo By Objective

  • GENE Expression Profiling
  • DNA Extraction & Purification
  • DNA/RNA Sequencing
  • Marker-Assisted Selection
  • Genotyping
  • GMO-Trait Purity Testing
  • Others

logo By Application

  • Cereals & Grains
  • Fruits & Vegetables
  • Oilseeds & Pulses
  • Others

logo By Region

  • North America
    • The U.S.
    • Canada
    • Mexico
  • Europe
    • France
    • The UK
    • Spain
    • Germany
    • Italy
    • Nordic Countries
      • Denmark
      • Sweden
      • Norway
    • Benelux Union
      • Belgium
      • The Netherlands
      • Luxembourg
    • Rest of Europe
  • Asia Pacific
    • China
    • Japan
    • India
    • Australia
    • South Korea
    • Southeast Asia
      • Indonesia
      • Thailand
      • Malaysia
      • Singapore
      • Rest of Southeast Asia
    • Rest of Asia Pacific
  • The Middle East & Africa
    • Saudi Arabia
    • UAE
    • Egypt
    • South Africa
    • Rest of the Middle East & Africa
  • Latin America
    • Brazil
    • Argentina
    • Rest of Latin America

Table of Content

  1. CHAPTER 1. Executive Summary 22
  2. CHAPTER 2. Plant Genomics market – Type Analysis 24
    1. 2.1. Global Plant Genomics Market – Type Overview 24
    2. 2.2. Global Plant Genomics Market Share, by Type, 2023 & 2030 (USD Billion) 24
    3. 2.3. Molecular Engineering 26
      1. 2.3.1. Global Molecular Engineering Plant Genomics Market, 2020-2030 (USD Billion) 26
    4. 2.4. Genetic Engineering 27
      1. 2.4.1. Global Genetic Engineering Plant Genomics Market, 2020-2030 (USD Billion) 27
    5. 2.5. Others 28
      1. 2.5.1. Global Others Plant Genomics Market, 2020-2030 (USD Billion) 28
  3. CHAPTER 3. Plant Genomics market – Trait Analysis 28
    1. 3.1. Global Plant Genomics Market – Trait Overview 28
    2. 3.2. Global Plant Genomics Market Share, by Trait, 2023 & 2030 (USD Billion) 29
    3. 3.3. Disease Resistance 30
      1. 3.3.1. Global Disease Resistance Plant Genomics Market, 2020-2030 (USD Billion) 30
    4. 3.4. Herbicide Tolerance 31
      1. 3.4.1. Global Herbicide Tolerance Plant Genomics Market, 2020-2030 (USD Billion) 31
    5. 3.5. Yield Improvement 32
      1. 3.5.1. Global Yield Improvement Plant Genomics Market, 2020-2030 (USD Billion) 32
    6. 3.6. Others 33
      1. 3.6.1. Global Others Plant Genomics Market, 2020-2030 (USD Billion) 33
  4. CHAPTER 4. Plant Genomics market – Objective Analysis 33
    1. 4.1. Global Plant Genomics Market – Objective Overview 33
    2. 4.2. Global Plant Genomics Market Share, by Objective, 2023 & 2030 (USD Billion) 34
    3. 4.3. GENE Expression Profiling 35
      1. 4.3.1. Global GENE Expression Profiling Plant Genomics Market, 2020-2030 (USD Billion) 35
    4. 4.4. DNA Extraction & Purification 36
      1. 4.4.1. Global DNA Extraction & Purification Plant Genomics Market, 2020-2030 (USD Billion) 36
    5. 4.5. DNA/RNA Sequencing 37
      1. 4.5.1. Global DNA/RNA Sequencing Plant Genomics Market, 2020-2030 (USD Billion) 37
    6. 4.6. Marker-Assisted Selection 38
      1. 4.6.1. Global Marker-Assisted Selection Plant Genomics Market, 2020-2030 (USD Billion) 38
    7. 4.7. Genotyping 39
      1. 4.7.1. Global Genotyping Plant Genomics Market, 2020-2030 (USD Billion) 39
    8. 4.8. GMO-Trait Purity Testing 40
      1. 4.8.1. Global GMO-Trait Purity Testing Plant Genomics Market, 2020-2030 (USD Billion) 40
    9. 4.9. Others 41
      1. 4.9.1. Global Others Plant Genomics Market, 2020-2030 (USD Billion) 41
  5. CHAPTER 5. Plant Genomics market – Application Analysis 41
    1. 5.1. Global Plant Genomics Market – Application Overview 41
    2. 5.2. Global Plant Genomics Market Share, by Application, 2023 & 2030 (USD Billion) 42
    3. 5.3. Fruits & Vegetables 43
      1. 5.3.1. Global Fruits & Vegetables Plant Genomics Market, 2020-2030 (USD Billion) 43
    4. 5.4. Cereals & Grains 44
      1. 5.4.1. Global Cereals & Grains Plant Genomics Market, 2020-2030 (USD Billion) 44
    5. 5.5. Oilseeds & Pulses 45
      1. 5.5.1. Global Oilseeds & Pulses Plant Genomics Market, 2020-2030 (USD Billion) 45
    6. 5.6. Others 46
      1. 5.6.1. Global Others Plant Genomics Market, 2020-2030 (USD Billion) 46
  6. CHAPTER 6. Plant Genomics market – Regional Analysis 47
    1. 6.1. Global Plant Genomics Market Regional Overview 47
    2. 6.2. Global Plant Genomics Market Share, by Region, 2023 & 2030 (Value) 47
    3. 6.3. North America 49
      1. 6.3.1. North America Plant Genomics Market size and forecast, 2020-2030 49
      2. 6.3.2. North America Plant Genomics Market, by Country, 2023 & 2030 (USD Billion) 49
      3. 6.3.3. North America Plant Genomics Market, by Type, 2020-2030 51
        1. 6.3.3.1. North America Plant Genomics Market, by Type, 2020-2030 (USD Billion) 51
      4. 6.3.4. North America Plant Genomics Market, by Trait, 2020-2030 52
        1. 6.3.4.1. North America Plant Genomics Market, by Trait, 2020-2030 (USD Billion) 52
      5. 6.3.5. North America Plant Genomics Market, by Objective, 2020-2030 53
        1. 6.3.5.1. North America Plant Genomics Market, by Objective, 2020-2030 (USD Billion) 53
      6. 6.3.6. North America Plant Genomics Market, by Application, 2020-2030 54
        1. 6.3.6.1. North America Plant Genomics Market, by Application, 2020-2030 (USD Billion) 54
      7. 6.3.7. U.S. 55
        1. 6.3.7.1. U.S. Market size and forecast, 2020-2030 (USD Billion) 55
      8. 6.3.8. Canada 56
        1. 6.3.8.1. Canada Market size and forecast, 2020-2030 (USD Billion) 56
      9. 6.3.9. Mexico 57
        1. 6.3.9.1. Mexico Market size and forecast, 2020-2030 (USD Billion) 57
    4. 6.4. Europe 58
      1. 6.4.1. Europe Plant Genomics Market size and forecast, 2020-2030 58
      2. 6.4.2. Europe Plant Genomics Market, by Country, 2023 & 2030 (USD Billion) 58
      3. 6.4.3. Europe Plant Genomics Market, by Type, 2020-2030 60
        1. 6.4.3.1. Europe Plant Genomics Market, by Type, 2020-2030 (USD Billion) 60
      4. 6.4.4. Europe Plant Genomics Market, by Trait, 2020-2030 61
        1. 6.4.4.1. Europe Plant Genomics Market, by Trait, 2020-2030 (USD Billion) 61
      5. 6.4.5. Europe Plant Genomics Market, by Objective, 2020-2030 62
        1. 6.4.5.1. Europe Plant Genomics Market, by Objective, 2020-2030 (USD Billion) 62
      6. 6.4.6. Europe Plant Genomics Market, by Application, 2020-2030 63
        1. 6.4.6.1. Europe Plant Genomics Market, by Application, 2020-2030 (USD Billion) 63
      7. 6.4.7. Germany 64
        1. 6.4.7.1. Germany Market size and forecast, 2020-2030 (USD Billion) 64
      8. 6.4.8. France 65
        1. 6.4.8.1. France Market size and forecast, 2020-2030 (USD Billion) 65
      9. 6.4.9. U.K. 66
        1. 6.4.9.1. U.K. Market size and forecast, 2020-2030 (USD Billion) 66
      10. 6.4.10. Italy 67
        1. 6.4.10.1. Italy Market size and forecast, 2020-2030 (USD Billion) 67
      11. 6.4.11. Spain 68
        1. 6.4.11.1. Spain Market size and forecast, 2020-2030 (USD Billion) 68
      12. 6.4.12. Nordic Countries 69
        1. 6.4.12.1. Nordic Countries Market size and forecast, 2020-2030 (USD Billion) 69
      13. 6.4.13. Benelux Union 70
        1. 6.4.13.1. Benelux Union Market size and forecast, 2020-2030 (USD Billion) 70
      14. 6.4.14. Rest of Europe 71
        1. 6.4.14.1. Rest of Europe Market size and forecast, 2020-2030 (USD Billion) 71
    5. 6.5. Asia Pacific 72
      1. 6.5.1. Asia Pacific Plant Genomics Market size and forecast, 2020-2030 72
      2. 6.5.2. Asia Pacific Plant Genomics Market, by Country, 2023 & 2030 (USD Billion) 72
      3. 6.5.3. Asia Pacific Plant Genomics Market, by Type, 2020-2030 74
        1. 6.5.3.1. Asia Pacific Plant Genomics Market, by Type, 2020-2030 (USD Billion) 74
      4. 6.5.4. Asia Pacific Plant Genomics Market, by Trait, 2020-2030 75
        1. 6.5.4.1. Asia Pacific Plant Genomics Market, by Trait, 2020-2030 (USD Billion) 75
      5. 6.5.5. Asia Pacific Plant Genomics Market, by Objective, 2020-2030 76
        1. 6.5.5.1. Asia Pacific Plant Genomics Market, by Objective, 2020-2030 (USD Billion) 76
      6. 6.5.6. Asia Pacific Plant Genomics Market, by Application, 2020-2030 77
        1. 6.5.6.1. Asia Pacific Plant Genomics Market, by Application, 2020-2030 (USD Billion) 77
      7. 6.5.7. China 78
        1. 6.5.7.1. China Market size and forecast, 2020-2030 (USD Billion) 78
      8. 6.5.8. Japan 79
        1. 6.5.8.1. Japan Market size and forecast, 2020-2030 (USD Billion) 79
      9. 6.5.9. India 80
        1. 6.5.9.1. India Market size and forecast, 2020-2030 (USD Billion) 80
      10. 6.5.10. New Zealand 81
        1. 6.5.10.1. New Zealand Market size and forecast, 2020-2030 (USD Billion) 81
      11. 6.5.11. Australia 82
        1. 6.5.11.1. Australia Market size and forecast, 2020-2030 (USD Billion) 82
      12. 6.5.12. South Korea 83
        1. 6.5.12.1. South Korea Market size and forecast, 2020-2030 (USD Billion) 83
      13. 6.5.13. South-East Asia 84
        1. 6.5.13.1. South-East Asia Market size and forecast, 2020-2030 (USD Billion) 84
      14. 6.5.14. Rest of Asia Pacific 85
        1. 6.5.14.1. Rest of Asia Pacific Market size and forecast, 2020-2030 (USD Billion) 85
    6. 6.6. Latin America 86
      1. 6.6.1. Latin America Plant Genomics Market size and forecast, 2020-2030 86
      2. 6.6.2. Latin America Plant Genomics Market, by Country, 2023 & 2030 (USD Billion) 86
      3. 6.6.3. Latin America Plant Genomics Market, by Type, 2020-2030 88
        1. 6.6.3.1. Latin America Plant Genomics Market, by Type, 2020-2030 (USD Billion) 88
      4. 6.6.4. Latin America Plant Genomics Market, by Trait, 2020-2030 89
        1. 6.6.4.1. Latin America Plant Genomics Market, by Trait, 2020-2030 (USD Billion) 89
      5. 6.6.5. Latin America Plant Genomics Market, by Objective, 2020-2030 90
        1. 6.6.5.1. Latin America Plant Genomics Market, by Objective, 2020-2030 (USD Billion) 90
      6. 6.6.6. Latin America Plant Genomics Market, by Application, 2020-2030 91
        1. 6.6.6.1. Latin America Plant Genomics Market, by Application, 2020-2030 (USD Billion) 91
      7. 6.6.7. Brazil 92
        1. 6.6.7.1. Brazil Market size and forecast, 2020-2030 (USD Billion) 92
      8. 6.6.8. Argentina 93
        1. 6.6.8.1. Argentina Market size and forecast, 2020-2030 (USD Billion) 93
      9. 6.6.9. Rest of Latin America 94
        1. 6.6.9.1. Rest of Latin America Market size and forecast, 2020-2030 (USD Billion) 94
    7. 6.7. The Middle-East and Africa 95
      1. 6.7.1. The Middle-East and Africa Plant Genomics Market size and forecast, 2020-2030 95
      2. 6.7.2. The Middle-East and Africa Plant Genomics Market, by Country, 2023 & 2030 (USD Billion) 95
      3. 6.7.3. The Middle-East and Africa Plant Genomics Market, by Type, 2020-2030 97
        1. 6.7.3.1. The Middle-East and Africa Plant Genomics Market, by Type, 2020-2030 (USD Billion) 97
      4. 6.7.4. The Middle-East and Africa Plant Genomics Market, by Trait, 2020-2030 98
        1. 6.7.4.1. The Middle-East and Africa Plant Genomics Market, by Trait, 2020-2030 (USD Billion) 98
      5. 6.7.5. The Middle-East and Africa Plant Genomics Market, by Objective, 2020-2030 99
        1. 6.7.5.1. The Middle-East and Africa Plant Genomics Market, by Objective, 2020-2030 (USD Billion) 99
      6. 6.7.6. The Middle-East and Africa Plant Genomics Market, by Application, 2020-2030 100
        1. 6.7.6.1. The Middle-East and Africa Plant Genomics Market, by Application, 2020-2030 (USD Billion) 100
      7. 6.7.7. Saudi Arabia 101
        1. 6.7.7.1. Saudi Arabia Market size and forecast, 2020-2030 (USD Billion) 101
      8. 6.7.8. UAE 102
        1. 6.7.8.1. UAE Market size and forecast, 2020-2030 (USD Billion) 102
      9. 6.7.9. Egypt 103
        1. 6.7.9.1. Egypt Market size and forecast, 2020-2030 (USD Billion) 103
      10. 6.7.10. Kuwait 104
        1. 6.7.10.1. Kuwait Market size and forecast, 2020-2030 (USD Billion) 104
      11. 6.7.11. South Africa 105
        1. 6.7.11.1. South Africa Market size and forecast, 2020-2030 (USD Billion) 105
      12. 6.7.12. Rest of Middle-East Africa 106
        1. 6.7.12.1. Rest of Middle-East Africa Market size and forecast, 2020-2030 (USD Billion) 106
  7. CHAPTER 7. Plant Genomics market – Competitive Landscape 107
    1. 7.1. Competitor Market Share – Revenue 107
    2. 7.2. Market Concentration Rate Analysis, Top 3 and Top 5 Players 109
    3. 7.3. Strategic Development 110
      1. 7.3.1. Acquisitions and Mergers 110
      2. 7.3.2. New Products 110
      3. 7.3.3. Research & Development Activities 110
  8. CHAPTER 8. Company Profiles 111
    1. 8.1. NRGene 111
      1. 8.1.1. Company Overview 111
      2. 8.1.2. NRGene Revenue and Gross Margin 111
      3. 8.1.3. Product portfolio 112
      4. 8.1.4. Recent initiatives 113
    2. 8.2. Eurofins Scientific 113
      1. 8.2.1. Company Overview 113
      2. 8.2.2. Eurofins Scientific Revenue and Gross Margin 113
      3. 8.2.3. Product portfolio 114
      4. 8.2.4. Recent initiatives 115
    3. 8.3. Qiagen 115
      1. 8.3.1. Company Overview 115
      2. 8.3.2. Qiagen Revenue and Gross Margin 115
      3. 8.3.3. Product portfolio 116
      4. 8.3.4. Recent initiatives 117
    4. 8.4. Illumina Inc. 117
      1. 8.4.1. Company Overview 117
      2. 8.4.2. Illumina Inc. Revenue and Gross Margin 117
      3. 8.4.3. Product portfolio 118
      4. 8.4.4. Recent initiatives 119
    5. 8.5. Neogen Corporation 119
      1. 8.5.1. Company Overview 119
      2. 8.5.2. Neogen Corporation Revenue and Gross Margin 119
      3. 8.5.3. Product portfolio 120
      4. 8.5.4. Recent initiatives 121
    6. 8.6. Agilent Technologies 121
      1. 8.6.1. Company Overview 121
      2. 8.6.2. Agilent Technologies Revenue and Gross Margin 121
      3. 8.6.3. Product portfolio 122
      4. 8.6.4. Recent initiatives 123
    7. 8.7. LC Sciences 123
      1. 8.7.1. Company Overview 123
      2. 8.7.2. LC Sciences Revenue and Gross Margin 123
      3. 8.7.3. Product portfolio 124
      4. 8.7.4. Recent initiatives 125
    8. 8.8. KeyGene 125
      1. 8.8.1. Company Overview 125
      2. 8.8.2. KeyGene Revenue and Gross Margin 125
      3. 8.8.3. Product portfolio 126
      4. 8.8.4. Recent initiatives 127
    9. 8.9. Traitgenetics GmbH 127
      1. 8.9.1. Company Overview 127
      2. 8.9.2. Traitgenetics GmbH Revenue and Gross Margin 127
      3. 8.9.3. Product portfolio 128
      4. 8.9.4. Recent initiatives 129
    10. 8.10. Oxford Nanopore Technologies 129
      1. 8.10.1. Company Overview 129
      2. 8.10.2. Oxford Nanopore Technologies Revenue and Gross Margin 129
      3. 8.10.3. Product portfolio 130
      4. 8.10.4. Recent initiatives 131
    11. 8.11. Novogene Corporation 131
      1. 8.11.1. Company Overview 131
      2. 8.11.2. Novogene Corporation Revenue and Gross Margin 131
      3. 8.11.3. Product portfolio 132
      4. 8.11.4. Recent initiatives 133
    12. 8.12. Genewiz 133
      1. 8.12.1. Company Overview 133
      2. 8.12.2. Genewiz Revenue and Gross Margin 133
      3. 8.12.3. Product portfolio 134
      4. 8.12.4. Recent initiatives 135
    13. 8.13. Floragenex 135
      1. 8.13.1. Company Overview 135
      2. 8.13.2. Floragenex Revenue and Gross Margin 135
      3. 8.13.3. Product portfolio 136
      4. 8.13.4. Recent initiatives 137
    14. 8.14. BGI Genomics 137
      1. 8.14.1. Company Overview 137
      2. 8.14.2. BGI Genomics Revenue and Gross Margin 137
      3. 8.14.3. Product portfolio 138
      4. 8.14.4. Recent initiatives 139
    15. 8.15. Genotypic Technologies 139
      1. 8.15.1. Company Overview 139
      2. 8.15.2. Genotypic Technologies Revenue and Gross Margin 139
      3. 8.15.3. Product portfolio 140
      4. 8.15.4. Recent initiatives 141
  9. CHAPTER 9. Plant Genomics — Industry Analysis 142
    1. 9.1. Plant Genomics Market – Key Trends 142
      1. 9.1.1. Market Drivers 143
      2. 9.1.2. Market Restraints 143
      3. 9.1.3. Market Opportunities 144
    2. 9.2. Value Chain Analysis 145
    3. 9.3. Technology Roadmap and Timeline 146
    4. 9.4. Plant Genomics Market – Attractiveness Analysis 147
      1. 9.4.1. By Type 147
      2. 9.4.2. By Trait 147
      3. 9.4.3. By Objective 148
      4. 9.4.4. By Application 149
      5. 9.4.5. By Region 150
  10. CHAPTER 10. Marketing Strategy Analysis, Distributors 151
    1. 10.1. Marketing Channel 151
    2. 10.2. Direct Marketing 152
    3. 10.3. Indirect Marketing 152
    4. 10.4. Marketing Channel Development Trend 152
    5. 10.5. Economic/Political Environmental Change 153
  11. CHAPTER 11. Report Conclusion 154
  12. CHAPTER 12. Research Approach & Methodology 155
    1. 12.1. Report Description 155
    2. 12.2. Research Scope 156
    3. 12.3. Research Methodology 156
      1. 12.3.1. Secondary Research 157
      2. 12.3.2. Primary Research 158
      3. 12.3.3. Models 159
        1. 12.3.3.1. Company Share Analysis Model 159
        2. 12.3.3.2. Revenue Based Modeling 160
        3. 12.3.3.3. Research Limitations 160

        List of Figures

        FIG. 1 Global Plant Genomics Market, 2020-2030 (USD Billion) 25
        FIG. 2 Global Plant Genomics Market Share, by Type, 2023 & 2030 (USD Billion) 26
        FIG. 3 Global Molecular Engineering Plant Genomics Market, 2020-2030 (USD Billion) 28
        FIG. 4 Global Genetic Engineering Plant Genomics Market, 2020-2030 (USD Billion) 29
        FIG. 5 Global Others Plant Genomics Market, 2020-2030 (USD Billion) 30
        FIG. 6 Global Plant Genomics Market Share, by Trait, 2023 & 2030 (USD Billion) 31
        FIG. 7 Global Disease Resistance Plant Genomics Market, 2020-2030 (USD Billion) 32
        FIG. 8 Global Herbicide Tolerance Plant Genomics Market, 2020-2030 (USD Billion) 33
        FIG. 9 Global Yield Improvement Plant Genomics Market, 2020-2030 (USD Billion) 34
        FIG. 10 Global Others Plant Genomics Market, 2020-2030 (USD Billion) 35
        FIG. 11 Global Plant Genomics Market Share, by Objective, 2023 & 2030 (USD Billion) 36
        FIG. 12 Global GENE Expression Profiling Plant Genomics Market, 2020-2030 (USD Billion) 37
        FIG. 13 Global DNA Extraction & Purification Plant Genomics Market, 2020-2030 (USD Billion) 38
        FIG. 14 Global DNA/RNA Sequencing Plant Genomics Market, 2020-2030 (USD Billion) 39
        FIG. 15 Global Marker-Assisted Selection Plant Genomics Market, 2020-2030 (USD Billion) 40
        FIG. 16 Global Genotyping Plant Genomics Market, 2020-2030 (USD Billion) 41
        FIG. 17 Global GMO-Trait Purity Testing Plant Genomics Market, 2020-2030 (USD Billion) 42
        FIG. 18 Global Others Plant Genomics Market, 2020-2030 (USD Billion) 43
        FIG. 19 Global Plant Genomics Market Share, by Application, 2023 & 2030 (USD Billion) 44
        FIG. 20 Global Fruits & Vegetables Plant Genomics Market, 2020-2030 (USD Billion) 45
        FIG. 21 Global Cereals & Grains Plant Genomics Market, 2020-2030 (USD Billion) 46
        FIG. 22 Global Oilseeds & Pulses Plant Genomics Market, 2020-2030 (USD Billion) 47
        FIG. 23 Global Others Plant Genomics Market, 2020-2030 (USD Billion) 48
        FIG. 24 Global Plant Genomics Market Share, by Region, 2023 & 2030 49
        FIG. 25 North America Plant Genomics Market, 2020-2030 51
        FIG. 26 U.S. Plant Genomics Market, 2020-2030 57
        FIG. 27 Canada Plant Genomics Market, 2020-2030 58
        FIG. 28 Mexico Plant Genomics Market, 2020-2030 59
        FIG. 29 Europe Plant Genomics Market, 2020-2030 60
        FIG. 30 Germany Plant Genomics Market, 2020-2030 66
        FIG. 31 France Plant Genomics Market, 2020-2030 67
        FIG. 32 U.K. Plant Genomics Market, 2020-2030 68
        FIG. 33 Italy Plant Genomics Market, 2020-2030 69
        FIG. 34 Spain Plant Genomics Market, 2020-2030 70
        FIG. 35 Nordic Countries Plant Genomics Market, 2020-2030 71
        FIG. 36 Benelux Union Plant Genomics Market, 2020-2030 72
        FIG. 37 Rest of Europe Plant Genomics Market, 2020-2030 73
        FIG. 38 Asia Pacific Plant Genomics Market, 2020-2030 74
        FIG. 39 China Plant Genomics Market, 2020-2030 80
        FIG. 40 Japan Plant Genomics Market, 2020-2030 81
        FIG. 41 India Plant Genomics Market, 2020-2030 82
        FIG. 42 New Zealand Plant Genomics Market, 2020-2030 83
        FIG. 43 Australia Plant Genomics Market, 2020-2030 84
        FIG. 44 South  Korea Plant Genomics Market, 2020-2030 85
        FIG. 45 South-East Asia Plant Genomics Market, 2020-2030 86
        FIG. 46 Rest of Asia Pacific Plant Genomics Market, 2020-2030 87
        FIG. 47 Latin America Plant Genomics Market, 2020-2030 88
        FIG. 48 Brazil Plant Genomics Market, 2020-2030 94
        FIG. 49 Argentina Plant Genomics Market, 2020-2030 95
        FIG. 50 Rest of Latin America Plant Genomics Market, 2020-2030 96
        FIG. 51 The Middle-East and Africa Plant Genomics Market, 2020-2030 97
        FIG. 52 Saudi Arabia Plant Genomics Market, 2020-2030 103
        FIG. 53 UAE Plant Genomics Market, 2020-2030 104
        FIG. 54 Egypt Plant Genomics Market, 2020-2030 105
        FIG. 55 Kuwait Plant Genomics Market, 2020-2030 106
        FIG. 56 South Africa Plant Genomics Market, 2020-2030 107
        FIG. 57 Rest of Middle-East Africa Plant Genomics Market, 2020-2030 108
        FIG. 58 Competitor Market Share – Revenue 109
        FIG. 59 NRGene Revenue and Growth Rate 114
        FIG. 60 NRGene Market Share 114
        FIG. 61 Eurofins Scientific Revenue and Growth Rate 116
        FIG. 62 Eurofins Scientific Market Share 116
        FIG. 63 Qiagen Revenue and Growth Rate 118
        FIG. 64 Qiagen Market Share 118
        FIG. 65 Illumina Inc. Revenue and Growth Rate 120
        FIG. 66 Illumina Inc. Market Share 120
        FIG. 67 Neogen Corporation Revenue and Growth Rate 122
        FIG. 68 Neogen Corporation Market Share 122
        FIG. 69 Agilent Technologies Revenue and Growth Rate 124
        FIG. 70 Agilent Technologies Market Share 124
        FIG. 71 LC Sciences Revenue and Growth Rate 126
        FIG. 72 LC Sciences Market Share 126
        FIG. 73 KeyGene Revenue and Growth Rate 128
        FIG. 74 KeyGene Market Share 128
        FIG. 75 Traitgenetics GmbH Revenue and Growth Rate 130
        FIG. 76 Traitgenetics GmbH Market Share 130
        FIG. 77 Oxford Nanopore Technologies Revenue and Growth Rate 132
        FIG. 78 Oxford Nanopore Technologies Market Share 132
        FIG. 79 Novogene Corporation Revenue and Growth Rate 134
        FIG. 80 Novogene Corporation Market Share 134
        FIG. 81 Genewiz Revenue and Growth Rate 136
        FIG. 82 Genewiz Market Share 136
        FIG. 83 Floragenex Revenue and Growth Rate 138
        FIG. 84 Floragenex Market Share 138
        FIG. 85 BGI Genomics Revenue and Growth Rate 140
        FIG. 86 BGI Genomics Market Share 140
        FIG. 87 Genotypic Technologies Revenue and Growth Rate 142
        FIG. 88 Genotypic Technologies Market Share 142
        FIG. 89 Market Dynamics 144
        FIG. 90 Global Plant Genomics – Value Chain Analysis 147
        FIG. 91 Technology Roadmap and Timeline 148
        FIG. 92 Market Attractiveness Analysis – By Type 149
        FIG. 93 Market Attractiveness Analysis – By Trait 150
        FIG. 94 Market Attractiveness Analysis – By Objective 150
        FIG. 95 Market Attractiveness Analysis – By Application 151
        FIG. 96 Market Attractiveness Analysis – By Region 152
        FIG. 97 Market Channel 153
        FIG. 98 Marketing Channel Development Trend 154
        FIG. 99 Growth in World Gross Product, 2008-2018 155


        List of Tables

        TABLE 1 Global Plant Genomics market, 2023 & 2030 (USD Billion) 16
        TABLE 2 Global Plant Genomics market, by undefined, 2020-2030 (USD Billion) 18
        TABLE 3 Global Plant Genomics market, by undefined, 2020-2030 () 19
        TABLE 4 Global Plant Genomics market, by region, 2020-2030 (USD Billion) 22
        TABLE 5 Global Plant Genomics market, by region, 2020-2030 () 23
        TABLE 6 undefined Plant Genomics Market, by undefined, 2020-2030 (USD Billion) 26
        TABLE 7 undefined Plant Genomics Market, by undefined, 2020-2030 () 26
        TABLE 8 North America Plant Genomics Production, Consumption, Export, Import, 2020-2030 33
        TABLE 9 Europe Plant Genomics Production, Consumption, Export, Import, 2020-2030 33
        TABLE 10 Asia Pacific Plant Genomics Production, Consumption, Export, Import, 2020-2030 33
        TABLE 11 Latin America Plant Genomics Production, Consumption, Export, Import, 2020-2030 34
        TABLE 12 Middle East & Africa Plant Genomics Production, Consumption, Export, Import, 2020-2030 34
        TABLE 13 Global Plant Genomics Market - Company Revenue Analysis 2019-2021 (USD Billion) 35
        TABLE 14 Global Plant Genomics Market - Company Revenue Share Analysis 2019-2021 (%) 36
        TABLE 15 Global Plant Genomics Market - Company Volume Analysis 2019-2021 () 37
        TABLE 16 Global Plant Genomics Market - Company Volume Share Analysis 2019-2021 (%) 38
        TABLE 17 Acquisitions and Mergers 39
        TABLE 18 New Product/Service Launch 39
        TABLE 19 Research & Development Activities 39
        TABLE 20 Market Drivers 42
        TABLE 21 Market Restraints 42
        TABLE 22 Market Opportunities 43
        TABLE 23 Production Base and Market Concentration Rate of Raw Material 49
        TABLE 24 Key Suppliers of Raw Materials 51
        TABLE 25 Raw Materials Sources of Plant Genomics Major Manufacturers in 2016 54
        TABLE 26 Major Buyers of Plant Genomics 54

Industry Major Market Players

  • NRGene
  • Eurofins Scientific
  • Qiagen
  • Illumina Inc.
  • Neogen Corporation
  • Agilent Technologies
  • LC Sciences
  • KeyGene
  • Traitgenetics GmbH
  • Oxford Nanopore Technologies
  • Novogene Corporation
  • Genewiz
  • Floragenex
  • BGI Genomics
  • Genotypic Technologies