Search Market Research Report

Discover Our Latest Reports
Discover Our Featured Reports
Discover Top Selling Reports

Ophthalmic Drug Market Size, Share Global Analysis Report, 2019–2026

report img

Ophthalmic Drug Market By Type (Over-the-Counter Drugs and Prescription Drugs), By Drug Class (Anti-inflammatory Drugs, Anti-Infective Drugs, Anti-Allergic Drugs, Anti-Glaucoma Drugs, and Others), By Disease Indication (Inflammation/ Infection, Retinal Disorders, Dry Eye, Glaucoma, Allergies, and Others), By Distribution Channel (Online Sales, Retail Pharmacies, Hospital Pharmacies, and Others), and By Region: Global Industry Perspective, Market Size, Statistical Research, Market Intelligence, Comprehensive Analysis, Historical Trends, and Forecast 2019–2026

Industry Insights

This professional and specialized report study examines the technical and business perspective of the global ophthalmic drug industry. The report provides a historical analysis of the industry as well as the projected trends expected to be witnessed in the global ophthalmic drug market. The report study analyzes the market statistics at the global as well as the regional levels to gain an in-depth perspective of the overall global ophthalmic drug market. The historical insights are provided from 2016 to 2019 and projected trends are provided from 2020 to 2026. The quantitative data is provided in terms of both volume (K Units) and value (USD Million) for 2016 – 2026. The qualitative data is reinforced by analyzing and providing numerous market dynamics (directly or indirectly affecting the industry) such as growth drivers, restraints, challenges, and opportunities.

We have included various industry analysis models in our report and extensively demonstrated the key business strategies and competitive landscape of the global ophthalmic drug market in our study.

Ophthalmic Drug Market Size

To know more about this report | Request Free Sample Copy


logoKey Insights from Primary Research

  • The increasing ocular disease-relatedincidences are propelling the global ophthalmic drug market, according to the primary respondents.
  • The increase in R&D and drug discovery activities in the pharmaceutical sector from the past several years has significantly boosted the ophthalmic drug market.
  • In some cases, the ophthalmic drugs react and cause severe side effects including irritation and blurred vision, thereby impeding the drug market.
  • Novel and effective discovery of ophthalmic drugs is a laborious process owing to the stringent guidelines set by the FDA and other regulatory bodies, which eventually hampers the global market growth.
  • The primary respondents stated that anti-infective drugs have been contributing significantly to the global market, capturing over one-third of the market share in terms of revenue and unit sales.

logoKey Recommendations from Analysts

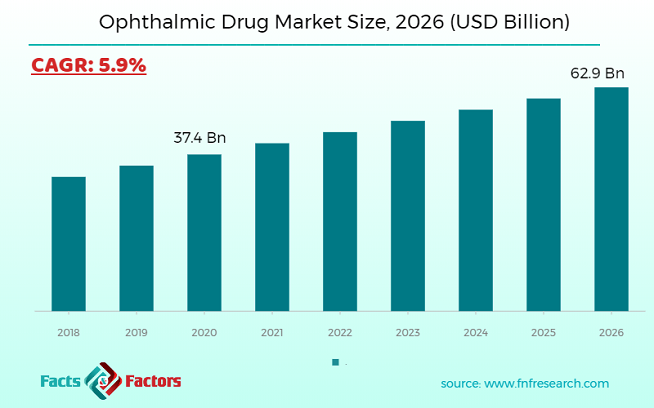
  • Based on the analytical data, the global ophthalmic market generated a revenue of over USD 27,000 million in 2019 and is projected to reach the value close to USD 37,700 million propelling at a rate of around 4.6%.
  • According to analysts, the cases of ophthalmic disorders are rising considerably due to the increasing environmental pollution, especially air & water, which in turn flourishes the global ophthalmic drug market.
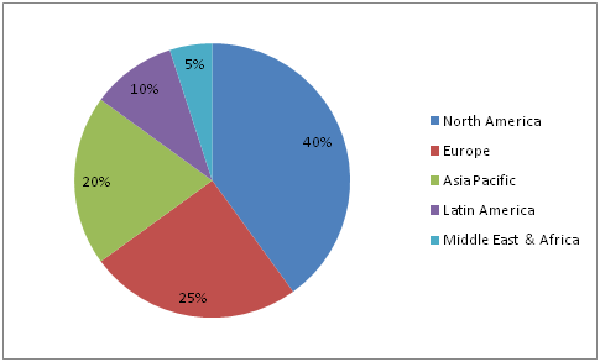
  • Analysts indicated that North America dominated the global ophthalmic market holding over 40% market share in terms of revenue and volume.
  • The drugs associated with “retinal disorders” category under the disease indication segment accounts for around one-third of the global ophthalmic market share.
  • Hospital pharmacies generate considerably higher revenue through ophthalmic drug sales. However, analysts have indicated that the retail pharmacies category is anticipated to grow at a faster rate.

logoGlobal Ophthalmic Drug Market Attractiveness in 2018- By Region

Global Ophthalmic Drug Market

To know more about this report | Request Free Sample Copy


Our study also includes an analysis of Porter’s Five Forces framework for understanding the competitive strategies adopted by various stakeholders involved in the entire value chain of the global ophthalmic drug market. It also encompasses PESTLE analysis and SWOT analysis.

The report also offers an in-depth analysis of the market shares of each industry player and gives an outline of the market position of key players in the global ophthalmic drug market. Moreover, the study offers wide coverage of key strategic advances witnessed in the market such as new product launches, acquisitions & mergers, collaborations & joint ventures, funding & VC activities, agreements, partnerships, R&D activities, and regional expansion of key players of the global ophthalmic drug market.

The research study provides a critical assessment of the global ophthalmic drug industry by logically segmenting the market on the basis of type, drug class, disease indication, distribution channel, and regions. Based on the past, present, and future trends, all the segments were analyzed from the bottom up, and the market sizes have been estimated from 2020 to 2026. The regional segmentation of the global ophthalmic drug industry includes the holistic bifurcation of all the five major continents including North America, Europe, Asia Pacific, Latin America, and the Middle East & Africa.

The visual impairment incidences have been surging considerably worldwide irrespective of the age group. This challenging situation has urged drug manufacturers and pharmaceutical companies to design and supply effective medications against this rapidly spreading disorder. Hence, the introduction of novel effective ophthalmic drug bolsters the global ophthalmic drug market. Exposure to air and water pollution poses a greater risk to the eyes. Thus, surging the demand for the drugs and propelling the global ophthalmic drug market.

The global ophthalmic drug market is segmented based on type, drug class, disease indication, distribution channel, and region. By type, the market is segmented into over-the-counter drugs and prescription drugs. Drug class classifies the market into anti-inflammatory drugs, anti-infective drugs, anti-allergic drugs, anti-glaucoma drugs, and others. Based on disease indication, the global market is categorized into inflammation/ infection, retinal disorders, dry eye, glaucoma, allergies, and others. The distribution channel segment of the global magnesium chloride market is sectored into online sales, retail pharmacies, hospital pharmacies, and others.

logoReport Scope

Report Attribute

Details

Market Size in 2020

USD 37.4 Billion

Projected Market Size in 2026

USD 62.9 Billion

CAGR Growth Rate

5.9% CAGR

Base Year

2020

Forecast Years

2021-2026

Key Market Players

Santen Pharmaceutical Co. Ltd., Bayer AG, ALLERGAN, Novartis AG, Pfizer Inc., Genentech Inc., Oxurion NV, Bausch Health Companies Inc., and Regeneron Pharmaceuticals Inc., among others.

Key Segment

By Type, By Drug Class, By Disease Indication, By Distribution, By Region

Major Regions Covered

North America, Europe, Asia Pacific, Latin America, and the Middle East & Africa

Purchase Options

Request customized purchase options to meet your research needs. Explore purchase options

logoCompetitive Players

Some of the essential players operating in the global ophthalmic drug market, but not restricted to include :

  • Santen Pharmaceutical Co. Ltd.
  • Bayer AG
  • ALLERGAN
  • Novartis AG
  • Pfizer Inc.
  • Genentech Inc.
  • Oxurion NV
  • Bausch Health Companies Inc.
  • Regeneron Pharmaceuticals Inc.  

The global ophthalmic drug market is segmented as:

logo Type Segmentation Analysis

  • Over-the-Counter Drugs
  • Prescription Drugs

logo Drug Class Segmentation Analysis

  • Anti-Infective Drugs
    • Anti-Bacterial Drugs
    • Anti-Fungal Drugs
    • Anti-Viral Drugs
    • Others
  • Anti-Glaucoma Drugs
    • Prostaglandin Analogs
    • Alpha Agonist
    • BetaBlockers
    • Combined Medication
    • Others
  • Anti-inflammatory Drugs
    • Steroids
    • Non-Steroidal Anti-Inflammatory Drugs
  • Anti-Allergic Drugs
  • Others

logo Disease Indication Segmentation Analysis

  • Inflammation/ Infection
  • Retinal Disorders
  • Dry Eye
  • Glaucoma
  • Allergies
  • Others

logo Distribution Channel Segmentation Analysis

  • Online Sales
  • Retail Pharmacies
  • Hospital Pharmacies
  • Others

logo Regional Segmentation Analysis

  • North America
    • The U.S.
    • Canada
  • Europe
    • France
    • The UK
    • Spain
    • Germany
    • Italy
    • Rest of Europe
  • Asia Pacific
    • China
    • Japan
    • India
    • South Korea
    • Southeast Asia
    • Rest of Asia Pacific
  • Latin America
    • Brazil
    • Mexico
    • Rest of Latin America
  • Middle East & Africa
    • GCC
    • South Africa
    • Rest of the Middle East & Africa

logoKEY BUSINESS POINTERS ADDRESSED & FOREMOST REASONS TO PROCURE THE REPORT:

  • Statistical Analysis of the Past, Current, and Future Trends of the Industry with Validated Market Sizes Data
  • Direct and Indirect Rationales Impacting the Industry
  • In-depth and Micro Analysis of Viable Segments and Sub-segments
  • Companies and Vendors Market Share, Competitive Landscape, and Player Positioning Analysis
  • Demand Side (Consumption) and Supply Side (Production) Perspective and Analysis wherever applicable
  • Key Buyers and End-Users Analysis
  • Value Chain and Manufacturing Cost Structure Analysis wherever relevant
  • Key Marketing Strategies as well as Key Sales Channels adopted in the market
  • Investment Opportunity Analysis & Patents Analysis wherever feasible
  • Technological Road Map & Technical Analysis
  • Robust Research Methodology comprising a dynamic mix (65%~35%) of Extensive Primary Research (primary interviews, ad-hoc surveys, questionnaires) and Protracted Secondary Research (proprietary in-house database, paid external databases, publically available validated sources)

Table of Content

  1. CHAPTER 1. Executive Summary
  2. CHAPTER 2. Ophthalmic drug market – Type Analysis
    1. 2.1. Global Ophthalmic drug Market – Type Overview
    2. 2.2. Global Ophthalmic drug Market Share, by Type, 2018 & 2025 (USD Million)
    3. 2.3. Global Ophthalmic drug Market share, by Type, 2018 & 2025 (K Units)
    4. 2.4. Over-the-Counter Drugs
      1. 2.4.1. Global Over-the-Counter Drugs Ophthalmic drug Market, 2016-2026 (USD Million)
      2. 2.4.2. Global Over-the-Counter Drugs Ophthalmic drug Market, 2016-2026 (K Units)
    5. 2.5. Prescription Drugs
      1. 2.5.1. Global Prescription Drugs Ophthalmic drug Market, 2016-2026 (USD Million)
      2. 2.5.2. Global Prescription Drugs Ophthalmic drug Market, 2016-2026 (K Units)
  3. CHAPTER 3. Ophthalmic drug market – Drug Class Analysis
    1. 3.1. Global Ophthalmic drug Market – Drug Class Overview
    2. 3.2. Global Ophthalmic drug Market Share, by Drug Class, 2018 & 2025 (USD Million)
    3. 3.3. Global Ophthalmic drug Market share, by Drug Class, 2018 & 2025 (K Units)
    4. 3.4. Anti-Infective Drugs
      1. 3.4.1. Global Anti-Infective Drugs Ophthalmic drug Market, 2016-2026 (USD Million)
      2. 3.4.2. Global Anti-Infective Drugs Ophthalmic drug Market, 2016-2026 (K Units)
    5. 3.5. Anti-Glaucoma Drugs
      1. 3.5.1. Global Anti-Glaucoma Drugs Ophthalmic drug Market, 2016-2026 (USD Million)
      2. 3.5.2. Global Anti-Glaucoma Drugs Ophthalmic drug Market, 2016-2026 (K Units)
    6. 3.6. Anti-inflammatory Drugs
      1. 3.6.1. Global Anti-inflammatory Drugs Ophthalmic drug Market, 2016-2026 (USD Million)
      2. 3.6.2. Global Anti-inflammatory Drugs Ophthalmic drug Market, 2016-2026 (K Units)
    7. 3.7. Anti-Allergic Drugs
      1. 3.7.1. Global Anti-Allergic Drugs Ophthalmic drug Market, 2016-2026 (USD Million)
      2. 3.7.2. Global Anti-Allergic Drugs Ophthalmic drug Market, 2016-2026 (K Units)
  4. CHAPTER 4. Ophthalmic drug market – Disease Indication Analysis
    1. 4.1. Global Ophthalmic drug Market – Disease Indication Overview
    2. 4.2. Global Ophthalmic drug Market Share, by Disease Indication, 2018 & 2025 (USD Million)
    3. 4.3. Global Ophthalmic drug Market share, by Disease Indication, 2018 & 2025 (K Units)
    4. 4.4. Inflammation/ Infection
      1. 4.4.1. Global Inflammation/ Infection Ophthalmic drug Market, 2016-2026 (USD Million)
      2. 4.4.2. Global Inflammation/ Infection Ophthalmic drug Market, 2016-2026 (K Units)
    5. 4.5. Retinal Disorders
      1. 4.5.1. Global Retinal Disorders Ophthalmic drug Market, 2016-2026 (USD Million)
      2. 4.5.2. Global Retinal Disorders Ophthalmic drug Market, 2016-2026 (K Units)
    6. 4.6. Dry Eye
      1. 4.6.1. Global Dry Eye Ophthalmic drug Market, 2016-2026 (USD Million)
      2. 4.6.2. Global Dry Eye Ophthalmic drug Market, 2016-2026 (K Units)
    7. 4.7. Glaucoma
      1. 4.7.1. Global Glaucoma Ophthalmic drug Market, 2016-2026 (USD Million)
      2. 4.7.2. Global Glaucoma Ophthalmic drug Market, 2016-2026 (K Units)
    8. 4.8. Allergies
      1. 4.8.1. Global Allergies Ophthalmic drug Market, 2016-2026 (USD Million)
      2. 4.8.2. Global Allergies Ophthalmic drug Market, 2016-2026 (K Units)
    9. 4.9. Others
      1. 4.9.1. Global Others Ophthalmic drug Market, 2016-2026 (USD Million)
      2. 4.9.2. Global Others Ophthalmic drug Market, 2016-2026 (K Units)
  5. CHAPTER 5. Ophthalmic drug market – Distribution Channel Analysis
    1. 5.1. Global Ophthalmic drug Market – Distribution Channel Overview
    2. 5.2. Global Ophthalmic drug Market Share, by Distribution Channel, 2018 & 2025 (USD Million)
    3. 5.3. Global Ophthalmic drug Market share, by Distribution Channel, 2018 & 2025 (K Units)
    4. 5.4. Online Sales
      1. 5.4.1. Global Online Sales Ophthalmic drug Market, 2016-2026 (USD Million)
      2. 5.4.2. Global Online Sales Ophthalmic drug Market, 2016-2026 (K Units)
    5. 5.5. Retail Pharmacies
      1. 5.5.1. Global Retail Pharmacies Ophthalmic drug Market, 2016-2026 (USD Million)
      2. 5.5.2. Global Retail Pharmacies Ophthalmic drug Market, 2016-2026 (K Units)
    6. 5.6. Hospital Pharmacies
      1. 5.6.1. Global Hospital Pharmacies Ophthalmic drug Market, 2016-2026 (USD Million)
      2. 5.6.2. Global Hospital Pharmacies Ophthalmic drug Market, 2016-2026 (K Units)
    7. 5.7. Others
      1. 5.7.1. Global Others Ophthalmic drug Market, 2016-2026 (USD Million)
      2. 5.7.2. Global Others Ophthalmic drug Market, 2016-2026 (K Units)
  6. CHAPTER 6. Ophthalmic drug market – Regional Analysis
    1. 6.1. Global Ophthalmic drug Market Regional Overview
    2. 6.2. Global Ophthalmic drug Market Share, by Region, 2018 & 2025 (Value)
    3. 6.3. Global Ophthalmic drug Market Share, by Region, 2018 & 2025 (Volume)
    4. 6.4. North America
      1. 6.4.1. North America Ophthalmic drug Market size and forecast, 2016-2026
      2. 6.4.2. North America Ophthalmic drug Market, by Country, 2018 - 2025 (USD Million)
      3. 6.4.3. North America Market size and forecast, 2016-2026 (K Units)
      4. 6.4.4. North America Ophthalmic drug Market, by Country, 2018 - 2025 (K Units)
      5. 6.4.5. North America Ophthalmic drug Market, by Type, 2016-2026
        1. 6.4.5.1. North America Ophthalmic drug Market, by Type, 2016-2026 (USD Million)
        2. 6.4.5.2. North America Ophthalmic drug Market, by Type, 2016-2026 (K Units)
      6. 6.4.6. North America Ophthalmic drug Market, by Drug Class, 2016-2026
        1. 6.4.6.1. North America Ophthalmic drug Market, by Drug Class, 2016-2026 (USD Million)
        2. 6.4.6.2. North America Ophthalmic drug Market, by Drug Class, 2016-2026 (K Units)
      7. 6.4.7. North America Ophthalmic drug Market, by Disease Indication, 2016-2026
        1. 6.4.7.1. North America Ophthalmic drug Market, by Disease Indication, 2016-2026 (USD Million)
        2. 6.4.7.2. North America Ophthalmic drug Market, by Disease Indication, 2016-2026 (K Units)
      8. 6.4.8. North America Ophthalmic drug Market, by Distribution Channel, 2016-2026
        1. 6.4.8.1. North America Ophthalmic drug Market, by Distribution Channel, 2016-2026 (USD Million)
        2. 6.4.8.2. North America Ophthalmic drug Market, by Distribution Channel, 2016-2026 (K Units)
      9. 6.4.9. U.S.
        1. 6.4.9.1. U.S. Market size and forecast, 2016-2026 (USD Million)
        2. 6.4.9.2. U.S. Market size and forecast, 2016-2026 (K Units)
      10. 6.4.10. Canada
        1. 6.4.10.1. Canada Market size and forecast, 2016-2026 (USD Million)
        2. 6.4.10.2. Canada Market size and forecast, 2016-2026 (K Units)
    5. 6.5. Europe
      1. 6.5.1. Europe Ophthalmic drug Market size and forecast, 2016-2026
      2. 6.5.2. Europe Ophthalmic drug Market, by Country, 2018 - 2025 (USD Million)
      3. 6.5.3. Europe Market size and forecast, 2016-2026 (K Units)
      4. 6.5.4. Europe Ophthalmic drug Market, by Country, 2018 - 2025 (K Units)
      5. 6.5.5. Europe Ophthalmic drug Market, by Type, 2016-2026
        1. 6.5.5.1. Europe Ophthalmic drug Market, by Type, 2016-2026 (USD Million)
        2. 6.5.5.2. Europe Ophthalmic drug Market, by Type, 2016-2026 (K Units)
      6. 6.5.6. Europe Ophthalmic drug Market, by Drug Class, 2016-2026
        1. 6.5.6.1. Europe Ophthalmic drug Market, by Drug Class, 2016-2026 (USD Million)
        2. 6.5.6.2. Europe Ophthalmic drug Market, by Drug Class, 2016-2026 (K Units)
      7. 6.5.7. Europe Ophthalmic drug Market, by Disease Indication, 2016-2026
        1. 6.5.7.1. Europe Ophthalmic drug Market, by Disease Indication, 2016-2026 (USD Million)
        2. 6.5.7.2. Europe Ophthalmic drug Market, by Disease Indication, 2016-2026 (K Units)
      8. 6.5.8. Europe Ophthalmic drug Market, by Distribution Channel, 2016-2026
        1. 6.5.8.1. Europe Ophthalmic drug Market, by Distribution Channel, 2016-2026 (USD Million)
        2. 6.5.8.2. Europe Ophthalmic drug Market, by Distribution Channel, 2016-2026 (K Units)
      9. 6.5.9. Germany
        1. 6.5.9.1. Germany Market size and forecast, 2016-2026 (USD Million)
        2. 6.5.9.2. Germany Market size and forecast, 2016-2026 (K Units)
      10. 6.5.10. France
        1. 6.5.10.1. France Market size and forecast, 2016-2026 (USD Million)
        2. 6.5.10.2. France Market size and forecast, 2016-2026 (K Units)
      11. 6.5.11. U.K.
        1. 6.5.11.1. U.K. Market size and forecast, 2016-2026 (USD Million)
        2. 6.5.11.2. U.K. Market size and forecast, 2016-2026 (K Units)
      12. 6.5.12. Italy
        1. 6.5.12.1. Italy Market size and forecast, 2016-2026 (USD Million)
        2. 6.5.12.2. Italy Market size and forecast, 2016-2026 (K Units)
      13. 6.5.13. Spain
        1. 6.5.13.1. Spain Market size and forecast, 2016-2026 (USD Million)
        2. 6.5.13.2. Spain Market size and forecast, 2016-2026 (K Units)
      14. 6.5.14. Rest of Europe
        1. 6.5.14.1. Rest of Europe Market size and forecast, 2016-2026 (USD Million)
        2. 6.5.14.2. Rest of Europe Market size and forecast, 2016-2026 (K Units)
    6. 6.6. Asia Pacific
      1. 6.6.1. Asia Pacific Ophthalmic drug Market size and forecast, 2016-2026
      2. 6.6.2. Asia Pacific Ophthalmic drug Market, by Country, 2018 - 2025 (USD Million)
      3. 6.6.3. Asia Pacific Market size and forecast, 2016-2026 (K Units)
      4. 6.6.4. Asia Pacific Ophthalmic drug Market, by Country, 2018 - 2025 (K Units)
      5. 6.6.5. Asia Pacific Ophthalmic drug Market, by Type, 2016-2026
        1. 6.6.5.1. Asia Pacific Ophthalmic drug Market, by Type, 2016-2026 (USD Million)
        2. 6.6.5.2. Asia Pacific Ophthalmic drug Market, by Type, 2016-2026 (K Units)
      6. 6.6.6. Asia Pacific Ophthalmic drug Market, by Drug Class, 2016-2026
        1. 6.6.6.1. Asia Pacific Ophthalmic drug Market, by Drug Class, 2016-2026 (USD Million)
        2. 6.6.6.2. Asia Pacific Ophthalmic drug Market, by Drug Class, 2016-2026 (K Units)
      7. 6.6.7. Asia Pacific Ophthalmic drug Market, by Disease Indication, 2016-2026
        1. 6.6.7.1. Asia Pacific Ophthalmic drug Market, by Disease Indication, 2016-2026 (USD Million)
        2. 6.6.7.2. Asia Pacific Ophthalmic drug Market, by Disease Indication, 2016-2026 (K Units)
      8. 6.6.8. Asia Pacific Ophthalmic drug Market, by Distribution Channel, 2016-2026
        1. 6.6.8.1. Asia Pacific Ophthalmic drug Market, by Distribution Channel, 2016-2026 (USD Million)
        2. 6.6.8.2. Asia Pacific Ophthalmic drug Market, by Distribution Channel, 2016-2026 (K Units)
      9. 6.6.9. China
        1. 6.6.9.1. China Market size and forecast, 2016-2026 (USD Million)
        2. 6.6.9.2. China Market size and forecast, 2016-2026 (K Units)
      10. 6.6.10. Japan
        1. 6.6.10.1. Japan Market size and forecast, 2016-2026 (USD Million)
        2. 6.6.10.2. Japan Market size and forecast, 2016-2026 (K Units)
      11. 6.6.11. India
        1. 6.6.11.1. India Market size and forecast, 2016-2026 (USD Million)
        2. 6.6.11.2. India Market size and forecast, 2016-2026 (K Units)
      12. 6.6.12. South Korea
        1. 6.6.12.1. South Korea Market size and forecast, 2016-2026 (USD Million)
        2. 6.6.12.2. South Korea Market size and forecast, 2016-2026 (K Units)
      13. 6.6.13. South-East Asia
        1. 6.6.13.1. South-East Asia Market size and forecast, 2016-2026 (USD Million)
        2. 6.6.13.2. South-East Asia Market size and forecast, 2016-2026 (K Units)
      14. 6.6.14. Rest of Asia Pacific
        1. 6.6.14.1. Rest of Asia Pacific Market size and forecast, 2016-2026 (USD Million)
        2. 6.6.14.2. Rest of Asia Pacific Market size and forecast, 2016-2026 (K Units)
    7. 6.7. Latin America
      1. 6.7.1. Latin America Ophthalmic drug Market size and forecast, 2016-2026
      2. 6.7.2. Latin America Ophthalmic drug Market, by Country, 2018 - 2025 (USD Million)
      3. 6.7.3. Latin America Market size and forecast, 2016-2026 (K Units)
      4. 6.7.4. Latin America Ophthalmic drug Market, by Country, 2018 - 2025 (K Units)
      5. 6.7.5. Latin America Ophthalmic drug Market, by Type, 2016-2026
        1. 6.7.5.1. Latin America Ophthalmic drug Market, by Type, 2016-2026 (USD Million)
        2. 6.7.5.2. Latin America Ophthalmic drug Market, by Type, 2016-2026 (K Units)
      6. 6.7.6. Latin America Ophthalmic drug Market, by Drug Class, 2016-2026
        1. 6.7.6.1. Latin America Ophthalmic drug Market, by Drug Class, 2016-2026 (USD Million)
        2. 6.7.6.2. Latin America Ophthalmic drug Market, by Drug Class, 2016-2026 (K Units)
      7. 6.7.7. Latin America Ophthalmic drug Market, by Disease Indication, 2016-2026
        1. 6.7.7.1. Latin America Ophthalmic drug Market, by Disease Indication, 2016-2026 (USD Million)
        2. 6.7.7.2. Latin America Ophthalmic drug Market, by Disease Indication, 2016-2026 (K Units)
      8. 6.7.8. Latin America Ophthalmic drug Market, by Distribution Channel, 2016-2026
        1. 6.7.8.1. Latin America Ophthalmic drug Market, by Distribution Channel, 2016-2026 (USD Million)
        2. 6.7.8.2. Latin America Ophthalmic drug Market, by Distribution Channel, 2016-2026 (K Units)
      9. 6.7.9. Brazil
        1. 6.7.9.1. Brazil Market size and forecast, 2016-2026 (USD Million)
        2. 6.7.9.2. Brazil Market size and forecast, 2016-2026 (K Units)
      10. 6.7.10. Mexico
        1. 6.7.10.1. Mexico Market size and forecast, 2016-2026 (USD Million)
        2. 6.7.10.2. Mexico Market size and forecast, 2016-2026 (K Units)
      11. 6.7.11. Rest of Latin America
        1. 6.7.11.1. Rest of Latin America Market size and forecast, 2016-2026 (USD Million)
        2. 6.7.11.2. Rest of Latin America Market size and forecast, 2016-2026 (K Units)
    8. 6.8. The Middle-East and Africa
      1. 6.8.1. The Middle-East and Africa Ophthalmic drug Market size and forecast, 2016-2026
      2. 6.8.2. The Middle-East and Africa Ophthalmic drug Market, by Country, 2018 - 2025 (USD Million)
      3. 6.8.3. The Middle-East and Africa Market size and forecast, 2016-2026 (K Units)
      4. 6.8.4. The Middle-East and Africa Ophthalmic drug Market, by Country, 2018 - 2025 (K Units)
      5. 6.8.5. The Middle-East and Africa Ophthalmic drug Market, by Type, 2016-2026
        1. 6.8.5.1. The Middle-East and Africa Ophthalmic drug Market, by Type, 2016-2026 (USD Million)
        2. 6.8.5.2. The Middle-East and Africa Ophthalmic drug Market, by Type, 2016-2026 (K Units)
      6. 6.8.6. The Middle-East and Africa Ophthalmic drug Market, by Drug Class, 2016-2026
        1. 6.8.6.1. The Middle-East and Africa Ophthalmic drug Market, by Drug Class, 2016-2026 (USD Million)
        2. 6.8.6.2. The Middle-East and Africa Ophthalmic drug Market, by Drug Class, 2016-2026 (K Units)
      7. 6.8.7. The Middle-East and Africa Ophthalmic drug Market, by Disease Indication, 2016-2026
        1. 6.8.7.1. The Middle-East and Africa Ophthalmic drug Market, by Disease Indication, 2016-2026 (USD Million)
        2. 6.8.7.2. The Middle-East and Africa Ophthalmic drug Market, by Disease Indication, 2016-2026 (K Units)
      8. 6.8.8. The Middle-East and Africa Ophthalmic drug Market, by Distribution Channel, 2016-2026
        1. 6.8.8.1. The Middle-East and Africa Ophthalmic drug Market, by Distribution Channel, 2016-2026 (USD Million)
        2. 6.8.8.2. The Middle-East and Africa Ophthalmic drug Market, by Distribution Channel, 2016-2026 (K Units)
      9. 6.8.9. GCC Countries
        1. 6.8.9.1. GCC Countries Market size and forecast, 2016-2026 (USD Million)
        2. 6.8.9.2. GCC Countries Market size and forecast, 2016-2026 (K Units)
      10. 6.8.10. South Africa
        1. 6.8.10.1. South Africa Market size and forecast, 2016-2026 (USD Million)
        2. 6.8.10.2. South Africa Market size and forecast, 2016-2026 (K Units)
      11. 6.8.11. Rest of Middle-East Africa
        1. 6.8.11.1. Rest of Middle-East Africa Market size and forecast, 2016-2026 (USD Million)
        2. 6.8.11.2. Rest of Middle-East Africa Market size and forecast, 2016-2026 (K Units)
  7. CHAPTER 7. Ophthalmic drugProduction, Consumption, Export, Import by Regions
    1. 7.1. Global Ophthalmic drug production and revenue, 2015-2025 (USD Million) (K Units)
    2. 7.2. Global Import and Export Analysis, by Region
  8. CHAPTER 8. Ophthalmic drug market – Competitive Landscape
    1. 8.1. Competitor Market Share – Revenue
    2. 8.2. Market Concentration Rate Analysis, Top 3 and Top 5 Players
    3. 8.3. Competitor Market Share – Volume
    4. 8.4. Strategic Development
      1. 8.4.1. Acquisitions and Mergers
      2. 8.4.2. New Products
      3. 8.4.3. Research & Development Activities
  9. CHAPTER 9. Company Profiles
    1. 9.1. Santen Pharmaceutical Co. Ltd.
      1. 9.1.1. Company Overview
      2. 9.1.2. Santen Pharmaceutical Co. Ltd. Sales, Revenue, Price, and Gross Margin
      3. 9.1.3. Product portfolio
      4. 9.1.4. Recent initiatives
    2. 9.2. Bayer AG
      1. 9.2.1. Company Overview
      2. 9.2.2. Bayer AG Sales, Revenue, Price, and Gross Margin
      3. 9.2.3. Product portfolio
      4. 9.2.4. Recent initiatives
    3. 9.3. ALLERGAN
      1. 9.3.1. Company Overview
      2. 9.3.2. ALLERGAN Sales, Revenue, Price, and Gross Margin
      3. 9.3.3. Product portfolio
      4. 9.3.4. Recent initiatives
    4. 9.4. Novartis AG
      1. 9.4.1. Company Overview
      2. 9.4.2. Novartis AG Sales, Revenue, Price, and Gross Margin
      3. 9.4.3. Product portfolio
      4. 9.4.4. Recent initiatives
    5. 9.5. Pfizer Inc.
      1. 9.5.1. Company Overview
      2. 9.5.2. Pfizer Inc. Sales, Revenue, Price, and Gross Margin
      3. 9.5.3. Product portfolio
      4. 9.5.4. Recent initiatives
    6. 9.6. Genentech Inc.
      1. 9.6.1. Company Overview
      2. 9.6.2. Genentech Inc. Sales, Revenue, Price, and Gross Margin
      3. 9.6.3. Product portfolio
      4. 9.6.4. Recent initiatives
    7. 9.7. Oxurion NV
      1. 9.7.1. Company Overview
      2. 9.7.2. Oxurion NV Sales, Revenue, Price, and Gross Margin
      3. 9.7.3. Product portfolio
      4. 9.7.4. Recent initiatives
    8. 9.8. Bausch Health Companies Inc.
      1. 9.8.1. Company Overview
      2. 9.8.2. Bausch Health Companies Inc. Sales, Revenue, Price, and Gross Margin
      3. 9.8.3. Product portfolio
      4. 9.8.4. Recent initiatives
    9. 9.9. Regeneron Pharmaceuticals Inc.
      1. 9.9.1. Company Overview
      2. 9.9.2. Regeneron Pharmaceuticals Inc. Sales, Revenue, Price, and Gross Margin
      3. 9.9.3. Product portfolio
      4. 9.9.4. Recent initiatives
  10. CHAPTER 10. Ophthalmic drug — Industry Analysis
    1. 10.1. Introduction and Taxonomy
    2. 10.2. Ophthalmic drug Market – Key Trends
      1. 10.2.1. Market Drivers
      2. 10.2.2. Market Restraints
      3. 10.2.3. Market Opportunities
    3. 10.3. Value Chain Analysis
    4. 10.4. Key Mandates and Regulations
    5. 10.5. Technology Roadmap and Timeline
    6. 10.6. Ophthalmic drug market – Attractiveness Analysis
      1. 10.6.1. By Type
      2. 10.6.2. By Drug Class
      3. 10.6.3. By Disease Indication
      4. 10.6.4. By Distribution Channel
      5. 10.6.5. By Region
  11. CHAPTER 11. Raw Material analysis
    1. 11.1. Ophthalmic drug Key Raw Material Analysis
      1. 11.1.1. Key Raw Materials
      2. 11.1.2. Price Trend of Key Raw Materials
    2. 11.2. Key Suppliers of Raw Materials
    3. 11.3. Proportion of Manufacturing Cost Structure
      1. 11.3.1. Raw Materials
      2. 11.3.2. Labor Cost
    4. 11.4. Manufacturing Expenses Analysis of Ophthalmic drug
  12. CHAPTER 12. Industrial Chain, Sourcing Strategy and Downstream Buyers
    1. 12.1. Ophthalmic drug Industrial Chain Analysis
    2. 12.2. Upstream Raw Materials Sourcing
      1. 12.2.1. Risk Mitigation:
      2. 12.2.2. Supplier Relationships:
      3. 12.2.3. Business Processes:
      4. 12.2.4. Securing the Product:
    3. 12.3. Raw Materials Sources of Ophthalmic drug Major Manufacturers in 2016
    4. 12.4. Downstream Buyers
    5. 12.5. Distributors/Traders List
  13. CHAPTER 13. Marketing Strategy Analysis, Distributors
    1. 13.1. Marketing Channel
    2. 13.2. Direct Marketing
    3. 13.3. Indirect Marketing
    4. 13.4. Marketing Channel Development Trend
    5. 13.5. Economic/Political Environmental Change
  14. CHAPTER 14. Report Conclusion
  15. CHAPTER 15. Research Approach & Methodology
    1. 15.1. Report Description
    2. 15.2. Research Scope
    3. 15.3. Research Methodology
      1. 15.3.1. Secondary Research
      2. 15.3.2. Primary Research
      3. 15.3.3. Models
        1. 15.3.3.1. Company Share Analysis Model
        2. 15.3.3.2. Revenue Based Modeling
        3. 15.3.3.3. Research Limitations

        List of Figures

        FIG. 1 Global Ophthalmic drug Market, 2016-2026 (USD Million)
        FIG. 2 Global Ophthalmic drug Market Share, by Type, 2018 & 2025 (USD Million)
        FIG. 3 Global Ophthalmic drug Market share, by Type, 2018 & 2025 (K Units)
        FIG. 4 Global Over-the-Counter Drugs Ophthalmic drug Market, 2016-2026 (USD Million)
        FIG. 5 Global Over-the-Counter Drugs Ophthalmic drug  Market, 2016-2026 (K Units)
        FIG. 6 Global Prescription Drugs Ophthalmic drug Market, 2016-2026 (USD Million)
        FIG. 7 Global Prescription Drugs Ophthalmic drug  Market, 2016-2026 (K Units)
        FIG. 8 Global Ophthalmic drug Market Share, by Drug Class, 2018 & 2025 (USD Million)
        FIG. 9 Global Ophthalmic drug Market share, by Drug Class, 2018 & 2025 (K Units)
        FIG. 10 Global Anti-Infective Drugs Ophthalmic drug Market, 2016-2026 (USD Million)
        FIG. 11 Global Anti-Infective Drugs Ophthalmic drug  Market, 2016-2026 (K Units)
        FIG. 12 Global Anti-Glaucoma Drugs Ophthalmic drug Market, 2016-2026 (USD Million)
        FIG. 13 Global Anti-Glaucoma Drugs Ophthalmic drug  Market, 2016-2026 (K Units)
        FIG. 14 Global Anti-inflammatory Drugs Ophthalmic drug Market, 2016-2026 (USD Million)
        FIG. 15 Global Anti-inflammatory Drugs Ophthalmic drug  Market, 2016-2026 (K Units)
        FIG. 16 Global Anti-Allergic Drugs Ophthalmic drug Market, 2016-2026 (USD Million)
        FIG. 17 Global Anti-Allergic Drugs Ophthalmic drug  Market, 2016-2026 (K Units)
        FIG. 18 Global Ophthalmic drug Market Share, by Disease Indication, 2018 & 2025 (USD Million)
        FIG. 19 Global Ophthalmic drug Market share, by Disease Indication, 2018 & 2025 (K Units)
        FIG. 20 Global Inflammation/ Infection Ophthalmic drug Market, 2016-2026 (USD Million)
        FIG. 21 Global Inflammation/ Infection Ophthalmic drug  Market, 2016-2026 (K Units)
        FIG. 22 Global Retinal Disorders Ophthalmic drug Market, 2016-2026 (USD Million)
        FIG. 23 Global Retinal Disorders Ophthalmic drug  Market, 2016-2026 (K Units)
        FIG. 24 Global Dry Eye Ophthalmic drug Market, 2016-2026 (USD Million)
        FIG. 25 Global Dry Eye Ophthalmic drug  Market, 2016-2026 (K Units)
        FIG. 26 Global Glaucoma Ophthalmic drug Market, 2016-2026 (USD Million)
        FIG. 27 Global Glaucoma Ophthalmic drug  Market, 2016-2026 (K Units)
        FIG. 28 Global Allergies Ophthalmic drug Market, 2016-2026 (USD Million)
        FIG. 29 Global Allergies Ophthalmic drug  Market, 2016-2026 (K Units)
        FIG. 30 Global Others Ophthalmic drug Market, 2016-2026 (USD Million)
        FIG. 31 Global Others Ophthalmic drug  Market, 2016-2026 (K Units)
        FIG. 32 Global Ophthalmic drug Market Share, by Distribution Channel, 2018 & 2025 (USD Million)
        FIG. 33 Global Ophthalmic drug Market share, by Distribution Channel, 2018 & 2025 (K Units)
        FIG. 34 Global Online Sales Ophthalmic drug Market, 2016-2026 (USD Million)
        FIG. 35 Global Online Sales Ophthalmic drug  Market, 2016-2026 (K Units)
        FIG. 36 Global Retail Pharmacies Ophthalmic drug Market, 2016-2026 (USD Million)
        FIG. 37 Global Retail Pharmacies Ophthalmic drug  Market, 2016-2026 (K Units)
        FIG. 38 Global Hospital Pharmacies Ophthalmic drug Market, 2016-2026 (USD Million)
        FIG. 39 Global Hospital Pharmacies Ophthalmic drug  Market, 2016-2026 (K Units)
        FIG. 40 Global Others Ophthalmic drug Market, 2016-2026 (USD Million)
        FIG. 41 Global Others Ophthalmic drug  Market, 2016-2026 (K Units)
        FIG. 42 Global Ophthalmic drug Market Share, by Region, 2018 & 2025
        FIG. 43 Global Ophthalmic drug Market Share, by Region, 2018 & 2025
        FIG. 44 North America Ophthalmic drug Market, 2016-2026
        FIG. 45 North America Ophthalmic drug  Market, 2016-2026 (K Units)
        FIG. 46 U.S. Ophthalmic drug Market, 2016-2026
        FIG. 47 U.S. Ophthalmic drug  Market, 2016-2026 (K Units)
        FIG. 48 Canada Ophthalmic drug Market, 2016-2026
        FIG. 49 Canada Ophthalmic drug  Market, 2016-2026 (K Units)
        FIG. 50 Europe Ophthalmic drug Market, 2016-2026
        FIG. 51 Europe Ophthalmic drug  Market, 2016-2026 (K Units)
        FIG. 52 Germany Ophthalmic drug Market, 2016-2026
        FIG. 53 Germany Ophthalmic drug  Market, 2016-2026 (K Units)
        FIG. 54 France Ophthalmic drug Market, 2016-2026
        FIG. 55 France Ophthalmic drug  Market, 2016-2026 (K Units)
        FIG. 56 U.K. Ophthalmic drug Market, 2016-2026
        FIG. 57 U.K. Ophthalmic drug  Market, 2016-2026 (K Units)
        FIG. 58 Italy Ophthalmic drug Market, 2016-2026
        FIG. 59 Italy Ophthalmic drug  Market, 2016-2026 (K Units)
        FIG. 60 Spain Ophthalmic drug Market, 2016-2026
        FIG. 61 Spain Ophthalmic drug  Market, 2016-2026 (K Units)
        FIG. 62 Rest of Europe Ophthalmic drug Market, 2016-2026
        FIG. 63 Rest of Europe Ophthalmic drug  Market, 2016-2026 (K Units)
        FIG. 64 Asia Pacific Ophthalmic drug Market, 2016-2026
        FIG. 65 Asia Pacific Ophthalmic drug  Market, 2016-2026 (K Units)
        FIG. 66 China Ophthalmic drug Market, 2016-2026
        FIG. 67 China Ophthalmic drug  Market, 2016-2026 (K Units)
        FIG. 68 Japan Ophthalmic drug Market, 2016-2026
        FIG. 69 Japan Ophthalmic drug  Market, 2016-2026 (K Units)
        FIG. 70 India Ophthalmic drug Market, 2016-2026
        FIG. 71 India Ophthalmic drug  Market, 2016-2026 (K Units)
        FIG. 72 South  Korea Ophthalmic drug Market, 2016-2026
        FIG. 73 South  Korea Ophthalmic drug  Market, 2016-2026 (K Units)
        FIG. 74 South-East Asia Ophthalmic drug Market, 2016-2026
        FIG. 75 South-East Asia Ophthalmic drug  Market, 2016-2026 (K Units)
        FIG. 76 Rest of Asia Pacific Ophthalmic drug Market, 2016-2026
        FIG. 77 Rest of Asia Pacific Ophthalmic drug  Market, 2016-2026 (K Units)
        FIG. 78 Latin America Ophthalmic drug Market, 2016-2026
        FIG. 79 Latin America Ophthalmic drug  Market, 2016-2026 (K Units)
        FIG. 80 Brazil Ophthalmic drug Market, 2016-2026
        FIG. 81 Brazil Ophthalmic drug  Market, 2016-2026 (K Units)
        FIG. 82 Mexico Ophthalmic drug Market, 2016-2026
        FIG. 83 Mexico Ophthalmic drug  Market, 2016-2026 (K Units)
        FIG. 84 Rest of Latin America Ophthalmic drug Market, 2016-2026
        FIG. 85 Rest of Latin America Ophthalmic drug  Market, 2016-2026 (K Units)
        FIG. 86 The Middle-East and Africa Ophthalmic drug Market, 2016-2026
        FIG. 87 The Middle-East and Africa Ophthalmic drug  Market, 2016-2026 (K Units)
        FIG. 88 GCC Countries Ophthalmic drug Market, 2016-2026
        FIG. 89 GCC Countries Ophthalmic drug  Market, 2016-2026 (K Units)
        FIG. 90 South Africa Ophthalmic drug Market, 2016-2026
        FIG. 91 South Africa Ophthalmic drug  Market, 2016-2026 (K Units)
        FIG. 92 Rest of Middle-East Africa Ophthalmic drug Market, 2016-2026
        FIG. 93 Rest of Middle-East Africa Ophthalmic drug  Market, 2016-2026 (K Units)
        FIG. 94 Global Ophthalmic drug production and revenue, 2015-2025 (USD Million) (K Units)
        FIG. 95 North America Ophthalmic drug production and revenue, 2015-2025 (USD Million) (K Units)
        FIG. 96 Europe Ophthalmic drug production and revenue, 2015-2025 (USD Million) (K Units)
        FIG. 97 Asia Pacific Ophthalmic drug production and revenue, 2015-2025 (USD Million) (K Units)
        FIG. 98 Latin America Ophthalmic drug production and revenue, 2015-2025 (USD Million) (K Units)
        FIG. 99 Middle East and Africa Ophthalmic drug production and revenue, 2015-2025 (USD Million) (K Units)
        FIG. 100 Competitor Market Share – Revenue
        FIG. 101 Competitor Market Share – Volume
        FIG. 102 Santen Pharmaceutical Co. Ltd. Revenue and Growth Rate
        FIG. 103 Santen Pharmaceutical Co. Ltd. Market Share
        FIG. 104 Bayer AG Revenue and Growth Rate
        FIG. 105 Bayer AG Market Share
        FIG. 106 ALLERGAN Revenue and Growth Rate
        FIG. 107 ALLERGAN Market Share
        FIG. 108 Novartis AG Revenue and Growth Rate
        FIG. 109 Novartis AG Market Share
        FIG. 110 Pfizer Inc. Revenue and Growth Rate
        FIG. 111 Pfizer Inc. Market Share
        FIG. 112 Genentech Inc. Revenue and Growth Rate
        FIG. 113 Genentech Inc. Market Share
        FIG. 114 Oxurion NV Revenue and Growth Rate
        FIG. 115 Oxurion NV Market Share
        FIG. 116 Bausch Health Companies Inc. Revenue and Growth Rate
        FIG. 117 Bausch Health Companies Inc. Market Share
        FIG. 118 Regeneron Pharmaceuticals Inc. Revenue and Growth Rate
        FIG. 119 Regeneron Pharmaceuticals Inc. Market Share
        FIG. 120 Market Dynamics
        FIG. 121 Global Ophthalmic drug – Value Chain Analysis
        FIG. 122 Key Mandates and Regulations
        FIG. 123 Technology Roadmap and Timeline
        FIG. 124 Market Attractiveness Analysis – By Type
        FIG. 125 Market Attractiveness Analysis – By Drug Class
        FIG. 126 Market Attractiveness Analysis – By Disease Indication
        FIG. 127 Market Attractiveness Analysis – By Distribution Channel
        FIG. 128 Market Attractiveness Analysis – By Region
        FIG. 129 Manufacturing Cost Structure of Ophthalmic drug
        FIG. 130 Ophthalmic drug Industrial Chain Analysis
        FIG. 131 Market Channel
        FIG. 132 Marketing Channel Development Trend
        FIG. 133 Growth in World Gross Product, 2008-2018


        List of Tables

        TABLE 1 Global Ophthalmic drug market, 2018 & 2025 (USD Million)
        TABLE 2 Global Ophthalmic drug market, by Type, 2016-2026 (USD Million)
        TABLE 3 Global Ophthalmic drug market, by Type, 2016-2026 (K Units)
        TABLE 4 Global Ophthalmic drug market, by Drug Class, 2016-2026 (USD Million)
        TABLE 5 Global Ophthalmic drug market, by Drug Class, 2016-2026 (K Units)
        TABLE 6 Global Ophthalmic drug market, by Disease Indication, 2016-2026 (USD Million)
        TABLE 7 Global Ophthalmic drug market, by Disease Indication, 2016-2026 (K Units)
        TABLE 8 Global Ophthalmic drug market, by Distribution Channel, 2016-2026 (USD Million)
        TABLE 9 Global Ophthalmic drug market, by Distribution Channel, 2016-2026 (K Units)
        TABLE 10 Global Ophthalmic drug market, by region, 2016-2026 (USD Million)
        TABLE 11 Global Ophthalmic drug market, by region, 2016-2026 (K Units)
        TABLE 12 North America Ophthalmic drug Market, by Type, 2016-2026 (USD Million)
        TABLE 13 North America Ophthalmic drug Market, by Type, 2016-2026 (K Units)
        TABLE 14 North America Ophthalmic drug Market, by Drug Class, 2016-2026 (USD Million)
        TABLE 15 North America Ophthalmic drug Market, by Drug Class, 2016-2026 (K Units)
        TABLE 16 North America Ophthalmic drug Market, by Disease Indication, 2016-2026 (USD Million)
        TABLE 17 North America Ophthalmic drug Market, by Disease Indication, 2016-2026 (K Units)
        TABLE 18 North America Ophthalmic drug Market, by Distribution Channel, 2016-2026 (USD Million)
        TABLE 19 North America Ophthalmic drug Market, by Distribution Channel, 2016-2026 (K Units)
        TABLE 20 Europe Ophthalmic drug Market, by Type, 2016-2026 (USD Million)
        TABLE 21 Europe Ophthalmic drug Market, by Type, 2016-2026 (K Units)
        TABLE 22 Europe Ophthalmic drug Market, by Drug Class, 2016-2026 (USD Million)
        TABLE 23 Europe Ophthalmic drug Market, by Drug Class, 2016-2026 (K Units)
        TABLE 24 Europe Ophthalmic drug Market, by Disease Indication, 2016-2026 (USD Million)
        TABLE 25 Europe Ophthalmic drug Market, by Disease Indication, 2016-2026 (K Units)
        TABLE 26 Europe Ophthalmic drug Market, by Distribution Channel, 2016-2026 (USD Million)
        TABLE 27 Europe Ophthalmic drug Market, by Distribution Channel, 2016-2026 (K Units)
        TABLE 28 Asia Pacific Ophthalmic drug Market, by Type, 2016-2026 (USD Million)
        TABLE 29 Asia Pacific Ophthalmic drug Market, by Type, 2016-2026 (K Units)
        TABLE 30 Asia Pacific Ophthalmic drug Market, by Drug Class, 2016-2026 (USD Million)
        TABLE 31 Asia Pacific Ophthalmic drug Market, by Drug Class, 2016-2026 (K Units)
        TABLE 32 Asia Pacific Ophthalmic drug Market, by Disease Indication, 2016-2026 (USD Million)
        TABLE 33 Asia Pacific Ophthalmic drug Market, by Disease Indication, 2016-2026 (K Units)
        TABLE 34 Asia Pacific Ophthalmic drug Market, by Distribution Channel, 2016-2026 (USD Million)
        TABLE 35 Asia Pacific Ophthalmic drug Market, by Distribution Channel, 2016-2026 (K Units)
        TABLE 36 Latin America Ophthalmic drug Market, by Type, 2016-2026 (USD Million)
        TABLE 37 Latin America Ophthalmic drug Market, by Type, 2016-2026 (K Units)
        TABLE 38 Latin America Ophthalmic drug Market, by Drug Class, 2016-2026 (USD Million)
        TABLE 39 Latin America Ophthalmic drug Market, by Drug Class, 2016-2026 (K Units)
        TABLE 40 Latin America Ophthalmic drug Market, by Disease Indication, 2016-2026 (USD Million)
        TABLE 41 Latin America Ophthalmic drug Market, by Disease Indication, 2016-2026 (K Units)
        TABLE 42 Latin America Ophthalmic drug Market, by Distribution Channel, 2016-2026 (USD Million)
        TABLE 43 Latin America Ophthalmic drug Market, by Distribution Channel, 2016-2026 (K Units)
        TABLE 44 The Middle-East and Africa Ophthalmic drug Market, by Type, 2016-2026 (USD Million)
        TABLE 45 The Middle-East and Africa Ophthalmic drug Market, by Type, 2016-2026 (K Units)
        TABLE 46 The Middle-East and Africa Ophthalmic drug Market, by Drug Class, 2016-2026 (USD Million)
        TABLE 47 The Middle-East and Africa Ophthalmic drug Market, by Drug Class, 2016-2026 (K Units)
        TABLE 48 The Middle-East and Africa Ophthalmic drug Market, by Disease Indication, 2016-2026 (USD Million)
        TABLE 49 The Middle-East and Africa Ophthalmic drug Market, by Disease Indication, 2016-2026 (K Units)
        TABLE 50 The Middle-East and Africa Ophthalmic drug Market, by Distribution Channel, 2016-2026 (USD Million)
        TABLE 51 The Middle-East and Africa Ophthalmic drug Market, by Distribution Channel, 2016-2026 (K Units)
        TABLE 52 North America Ophthalmic drug Production, Consumption, Export, Import, 2016-2019
        TABLE 53 Europe Ophthalmic drug Production, Consumption, Export, Import, 2016-2019
        TABLE 54 Asia Pacific Ophthalmic drug Production, Consumption, Export, Import, 2016-2019
        TABLE 55 Latin America Ophthalmic drug Production, Consumption, Export, Import, 2016-2019
        TABLE 56 Middle East & Africa Ophthalmic drug Production, Consumption, Export, Import, 2016-2019
        TABLE 57 Global Ophthalmic drug Market - Company Revenue Analysis 2016-2019 (USD Million)
        TABLE 58 Global Ophthalmic drug Market - Company Revenue Share Analysis 2016-2019
        TABLE 59 Global Ophthalmic drug Market - Company Volume Analysis 2016-2019 (K Units)
        TABLE 60 Global Ophthalmic drug Market - Company Volume Share Analysis 2016-2019
        TABLE 61 Acquisitions and Mergers
        TABLE 62 New Product/Service Launch
        TABLE 63 Research & Development Activities
        TABLE 64 Market Drivers
        TABLE 65 Market Restraints
        TABLE 66 Market Opportunities
        TABLE 67 Production Base and Market Concentration Rate of Raw Material
        TABLE 68 Key Suppliers of Raw Materials
        TABLE 69 Raw Materials Sources of Ophthalmic drug Major Manufacturers in 2016
        TABLE 70 Major Buyers of Ophthalmic drug
        TABLE 71 Distributors/Traders of Ophthalmic drug by Region

Industry Major Market Players

  • Santen Pharmaceutical Co. Ltd.
  • Bayer AG
  • ALLERGAN
  • Novartis AG
  • Pfizer Inc.
  • Genentech Inc.
  • Oxurion NV
  • Bausch Health Companies Inc.
  • Regeneron Pharmaceuticals Inc.