Search Market Research Report

Discover Our Latest Reports
Discover Our Featured Reports
Discover Top Selling Reports

Nanodiamonds Market Size, Share Global Analysis Report, 2020–2026

report img

Nanodiamonds Market By Application (Finish polishing, Electroplating, Oil compounds, and others): Global Industry Outlook, Market Size, Business Intelligence, Consumer Preferences, Statistical Surveys, Comprehensive Analysis, Historical Developments, Current Trends, and Forecast 2020–2026

Industry Insights

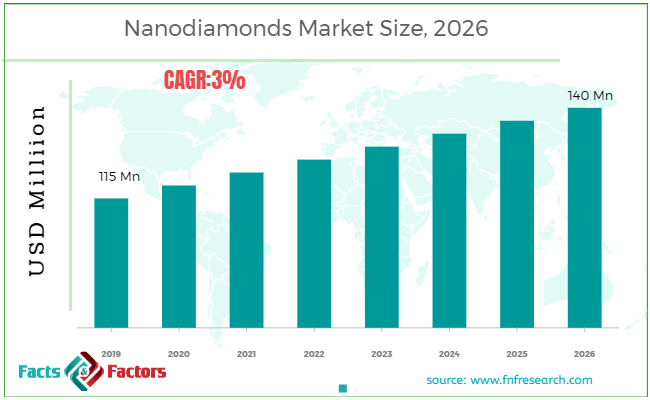
[188+ Pages Report] According to the report published by Facts Factors, the global nanodiamonds market size was worth around USD 115 million in 2019 and is predicted to grow to around USD 140 million by 2026 with a compound annual growth rate (CAGR) of roughly 3% between 2023 and 2030. The report analyzes the global nanodiamonds market drivers, restraints/challenges, and the effect they have on the demands during the projection period. In addition, the report explores emerging opportunities in the nanodiamonds market.

The nanodiamonds market report analyzes and notifies the industry statistics at the global as well as regional and country levels in order to acquire a thorough perspective of the entire nanodiamonds market. The historical and past insights are provided for FY 2016 to FY 2019 whereas projected trends are delivered for FY 2020 to FY 2026. The quantitative and numerical data is represented in terms of volume (Kilotons), and value (USD billion) from FY 2016 – 2026.

Nanodiamonds Market Size

To know more about this report | Request Free Sample Copy


logoKey Insights from Primary Research

  • According to the primary CXOs of the global nanodiamonds market, the market is estimated to witness a substantial growth of nearly 3% over the forecast period.
  • The market was valued at USD 115 million, in 2019 and is expected to be valued at over USD 140 million.
  • By application segmentation, the finish polishing category is expected to contribute the largest market share in the global nanodiamonds market owing to the wide use of nanodiamonds in coating and polishing applications.
  • By geography, in 2019, the Asia Pacific region dominated the market and it is projected to witness the highest market share attributed to the increasing use of nanodiamonds in the automotive and biomedical sectors.
  • Owing to the wide use of nanodiamonds, major manufacturers started their production in North America.

logoKey Recommendations from Analysts

  • Our analysts recommend that the European region will dominate nanodiamonds over the forecast period owing to the presence of major manufacturers.
  • Owing to increasing demand in the automotive sector is anticipated to boost the market over the forecast period.
  • Due to the use of nanodiamonds in electroplating, the electroplating category is anticipated to grow over the forecast period. 
  • Owing to the wide use of nanodiamonds in various applications such as bioimaging, drug delivery, disease detection may create numerous opportunities in the market over the forecast period.

The quantitative data is further underlined and reinforced by comprehensive qualitative data which comprises various across-the-board market dynamics. The rationales which directly or indirectly impact the nanodiamonds industries are exemplified through parameters such as growth drivers, restraints, challenges, and opportunities among other impacting factors.

Throughout our research report, we have encompassed all the proven models and tools of industry analysis and extensively illustrated all the key business strategies and business models adopted in the nanodiamonds industry. The report provides an all-inclusive and detailed competitive landscape prevalent in the nanodiamonds market.

The report utilizes established industry analysis tools and models such as Porter’s Five Forces framework to analyze and recognize critical business strategies adopted by various stakeholders involved in the entire value chain of the nanodiamonds industry. The nanodiamonds market report additionally employs SWOT analysis and PESTLE analysis models for further in-depth analysis.

The report study further includes an in-depth analysis of industry players' market shares and provides an overview of leading players' market position in the nanodiamonds sector. Key strategic developments in the nanodiamonds market competitive landscape such as acquisitions & mergers, inaugurations of different products and services, partnerships & joint ventures, MoU agreements, VC & funding activities, R&D activities, and geographic expansion among other noteworthy activities by key players of the nanodiamonds market are appropriately highlighted in the report.

The nanodiamonds market research report delivers an acute valuation and taxonomy of the nanodiamonds industry by practically splitting the market on the basis of different types, categories, and regions. Through the analysis of the historical and projected trends, all the segments and sub-segments were evaluated through the bottom-up approach, and different market sizes have been projected for FY 2020 to FY 2026.

logoReport Scope

Report Attribute

Details

Market Size in 2019

USD 115 Million

Projected Market Size in 2026

USD 140 Million

CAGR Growth Rate

3% CAGR

Base Year

2019

Forecast Years

2020-2026

Key Market Players

Kent & Yorkshire Gaskets, Modus Advanced, Silex, Warco, Fuji Polymer Industries, Samco, EREFSA, Zenith, Mosites Rubber,  Kiran Rubber, 3A Rubber, MER-Europe, Jingdong Rubber, Silicone Engineering, White Cross Rubber

Key Segment

By Application, and Region

Major Regions Covered

North America, Europe, Asia Pacific, Latin America, and the Middle East & Africa

Purchase Options

Request customized purchase options to meet your research needs. Explore purchase options

The regional segmentation of the nanodiamonds industry includes the complete classification of all the major continents including North America, Latin America, Europe, Asia Pacific, and the Middle East & Africa. Further, country-wise data for the nanodiamonds industry is provided for the leading economies of the world.

Nanodiamond is referred to as diamond detonation. They are small diamond particles and their particle size is in nanometers. They are completely different from diamonds which naturally occur in terms of their chemical property and performance. Nanodiamond is a hard substance and is extremely conductive under thermal conditions. Nanodiamond is the composition of the diamond core, functional oxygen group, and amorphous carbon layer.

The nanodiamond has excellent optical, mechanical, chemical, and thermal properties. The nanodiamond market is expected to see substantial growth over the forecast period, growing in the commercial production of nanodiamonds and R&D activities. The increased demand for nanodiamonds from various industries such as automotive, and biomedical may drive the market growth. However, the availability of alternative nanomaterials may impede market growth. Conversely, increased consumption of nanodiamonds in the automotive industry, and increasingly used in the electroplating application may create lucrative opportunities in the market.

The nanodiamonds market is segmented based on type, application, and region. On the basis of type segmentation, the market is classified into insulation nanodiamonds, antistatic nanodiamonds, conductive nanodiamonds, and others. By application segmentation, the market is divided into food & beverage, medical, automotive, construction, and others.

logoSome of the essential players operating in the nanodiamonds market, but not restricted to include

  • Kent & Yorkshire Gaskets
  • Modus Advanced
  • Silex
  • Warco
  • Fuji Polymer Industries
  • Samco
  • EREFSA
  • Zenith
  • Mosites Rubber
  • Kiran Rubber
  • 3A Rubber
  • MER-Europe
  • Jingdong Rubber
  • Silicone Engineering
  • White Cross Rubber

The taxonomy of the nanodiamonds industry by its scope and segmentation is as follows:

logoGlobal nanodiamonds Market: By Type Segmentation Analysis

  • Insulation nanodiamonds
  • Antistatic nanodiamonds
  • Conductive nanodiamonds
  • Others

logoGlobal nanodiamonds Market: By Application Segmentation Analysis

  • Food & Beverage
  • Medical
  • Automotive
  • Construction
  • Others

logoGlobal nanodiamonds Market: Regional Segmentation Analysis

  • North America
    • The U.S.
    • Canada
  • Europe
    • Germany
    • The UK
    • France
    • Spain
    • Italy
    • Rest of Europe
  • Asia Pacific
    • China
    • Japan
    • India
    • South Korea
    • Southeast Asia
    • Rest of Asia Pacific
  • Latin America
    • Brazil
    • Mexico
    • Rest of Latin America
  • Middle East & Africa
    • GCC
    • South Africa
    • Rest of Middle East & Africa

Table of Content

  1. CHAPTER 1. Executive Summary
  2. CHAPTER 2. Nanodiamonds market – Application Analysis
    1. 2.1. Global Nanodiamonds Market–ApplicationOverview
    2. 2.2. Global NanodiamondsMarketShare, by Application, 2019 & 2026 (USD Million)
    3. 2.3. Global Nanodiamonds Market share, by Application, 2019 & 2026 (Kilos)
    4. 2.4. Finish polishing
      1. 2.4.1. Global Finish polishingNanodiamondsMarket,2016-2026 (USD Million)
      2. 2.4.2. Global Finish polishingNanodiamonds Market, 2016-2026 (Kilos)
    5. 2.5. Electroplating
      1. 2.5.1. Global ElectroplatingNanodiamondsMarket,2016-2026 (USD Million)
      2. 2.5.2. Global ElectroplatingNanodiamonds Market, 2016-2026 (Kilos)
    6. 2.6. Oil compounds
      1. 2.6.1. Global Oil compoundsNanodiamondsMarket,2016-2026 (USD Million)
      2. 2.6.2. Global Oil compoundsNanodiamonds Market, 2016-2026 (Kilos)
    7. 2.7. Others
      1. 2.7.1. Global OthersNanodiamondsMarket,2016-2026 (USD Million)
      2. 2.7.2. Global OthersNanodiamonds Market, 2016-2026 (Kilos)
  3. CHAPTER 3. Nanodiamonds market – Regional Analysis
    1. 3.1. Global Nanodiamonds MarketRegionalOverview
    2. 3.2. Global NanodiamondsMarketShare, by Region, 2019 & 2026 (Value)
    3. 3.3. Global Nanodiamonds Market Share, by Region, 2019 & 2026 (Volume)
    4. 3.4. North America
      1. 3.4.1. North AmericaNanodiamonds Market size and forecast, 2016-2026
      2. 3.4.2. North AmericaNanodiamonds Market, by Country, 2019 - 2026 (USD Million)
      3. 3.4.3. North America Market size and forecast, 2016-2026 (Kilos)
      4. 3.4.4. North AmericaNanodiamonds Market, by Country, 2019 - 2026 (Kilos)
      5. 3.4.5. North AmericaNanodiamonds Market, by Application, 2016-2026
        1. 3.4.5.1. North AmericaNanodiamonds Market, by Application, 2016-2026 (USD Million)
        2. 3.4.5.2. North AmericaNanodiamonds Market, by Application, 2016-2026 (Kilos)
      6. 3.4.6. U.S.
        1. 3.4.6.1. U.S. Market size and forecast, 2016-2026 (USD Million)
        2. 3.4.6.2. U.S. Market size and forecast, 2016-2026 (Kilos)
      7. 3.4.7. Canada
        1. 3.4.7.1. Canada Market size and forecast, 2016-2026 (USD Million)
        2. 3.4.7.2. Canada Market size and forecast, 2016-2026 (Kilos)
    5. 3.5. Europe
      1. 3.5.1. EuropeNanodiamonds Market size and forecast, 2016-2026
      2. 3.5.2. EuropeNanodiamonds Market, by Country, 2019 - 2026 (USD Million)
      3. 3.5.3. Europe Market size and forecast, 2016-2026 (Kilos)
      4. 3.5.4. EuropeNanodiamonds Market, by Country, 2019 - 2026 (Kilos)
      5. 3.5.5. EuropeNanodiamonds Market, by Application, 2016-2026
        1. 3.5.5.1. EuropeNanodiamonds Market, by Application, 2016-2026 (USD Million)
        2. 3.5.5.2. EuropeNanodiamonds Market, by Application, 2016-2026 (Kilos)
      6. 3.5.6. Germany
        1. 3.5.6.1. Germany Market size and forecast, 2016-2026 (USD Million)
        2. 3.5.6.2. Germany Market size and forecast, 2016-2026 (Kilos)
      7. 3.5.7. France
        1. 3.5.7.1. France Market size and forecast, 2016-2026 (USD Million)
        2. 3.5.7.2. France Market size and forecast, 2016-2026 (Kilos)
      8. 3.5.8. U.K.
        1. 3.5.8.1. U.K. Market size and forecast, 2016-2026 (USD Million)
        2. 3.5.8.2. U.K. Market size and forecast, 2016-2026 (Kilos)
      9. 3.5.9. Italy
        1. 3.5.9.1. Italy Market size and forecast, 2016-2026 (USD Million)
        2. 3.5.9.2. Italy Market size and forecast, 2016-2026 (Kilos)
      10. 3.5.10. Spain
        1. 3.5.10.1. Spain Market size and forecast, 2016-2026 (USD Million)
        2. 3.5.10.2. Spain Market size and forecast, 2016-2026 (Kilos)
      11. 3.5.11. Rest of Europe
        1. 3.5.11.1. Rest of Europe Market size and forecast, 2016-2026 (USD Million)
        2. 3.5.11.2. Rest of Europe Market size and forecast, 2016-2026 (Kilos)
    6. 3.6. Asia Pacific
      1. 3.6.1. Asia PacificNanodiamonds Market size and forecast, 2016-2026
      2. 3.6.2. Asia PacificNanodiamonds Market, by Country, 2019 - 2026 (USD Million)
      3. 3.6.3. Asia Pacific Market size and forecast, 2016-2026 (Kilos)
      4. 3.6.4. Asia PacificNanodiamonds Market, by Country, 2019 - 2026 (Kilos)
      5. 3.6.5. Asia PacificNanodiamonds Market, by Application, 2016-2026
        1. 3.6.5.1. Asia PacificNanodiamonds Market, by Application, 2016-2026 (USD Million)
        2. 3.6.5.2. Asia PacificNanodiamonds Market, by Application, 2016-2026 (Kilos)
      6. 3.6.6. China
        1. 3.6.6.1. China Market size and forecast, 2016-2026 (USD Million)
        2. 3.6.6.2. China Market size and forecast, 2016-2026 (Kilos)
      7. 3.6.7. Japan
        1. 3.6.7.1. Japan Market size and forecast, 2016-2026 (USD Million)
        2. 3.6.7.2. Japan Market size and forecast, 2016-2026 (Kilos)
      8. 3.6.8. India
        1. 3.6.8.1. India Market size and forecast, 2016-2026 (USD Million)
        2. 3.6.8.2. India Market size and forecast, 2016-2026 (Kilos)
      9. 3.6.9. South Korea
        1. 3.6.9.1. South Korea Market size and forecast, 2016-2026 (USD Million)
        2. 3.6.9.2. South Korea Market size and forecast, 2016-2026 (Kilos)
      10. 3.6.10. South-East Asia
        1. 3.6.10.1. South-East Asia Market size and forecast, 2016-2026 (USD Million)
        2. 3.6.10.2. South-East Asia Market size and forecast, 2016-2026 (Kilos)
      11. 3.6.11. Rest of Asia Pacific
        1. 3.6.11.1. Rest of Asia Pacific Market size and forecast, 2016-2026 (USD Million)
        2. 3.6.11.2. Rest of Asia Pacific Market size and forecast, 2016-2026 (Kilos)
    7. 3.7. Latin America
      1. 3.7.1. Latin AmericaNanodiamonds Market size and forecast, 2016-2026
      2. 3.7.2. Latin AmericaNanodiamonds Market, by Country, 2019 - 2026 (USD Million)
      3. 3.7.3. Latin America Market size and forecast, 2016-2026 (Kilos)
      4. 3.7.4. Latin AmericaNanodiamonds Market, by Country, 2019 - 2026 (Kilos)
      5. 3.7.5. Latin AmericaNanodiamonds Market, by Application, 2016-2026
        1. 3.7.5.1. Latin AmericaNanodiamonds Market, by Application, 2016-2026 (USD Million)
        2. 3.7.5.2. Latin AmericaNanodiamonds Market, by Application, 2016-2026 (Kilos)
      6. 3.7.6. Brazil
        1. 3.7.6.1. Brazil Market size and forecast, 2016-2026 (USD Million)
        2. 3.7.6.2. Brazil Market size and forecast, 2016-2026 (Kilos)
      7. 3.7.7. Mexico
        1. 3.7.7.1. Mexico Market size and forecast, 2016-2026 (USD Million)
        2. 3.7.7.2. Mexico Market size and forecast, 2016-2026 (Kilos)
      8. 3.7.8. Rest of Latin America
        1. 3.7.8.1. Rest of Latin America Market size and forecast, 2016-2026 (USD Million)
        2. 3.7.8.2. Rest of Latin America Market size and forecast, 2016-2026 (Kilos)
    8. 3.8. The Middle-East and Africa
      1. 3.8.1. The Middle-East and AfricaNanodiamonds Market size and forecast, 2016-2026
      2. 3.8.2. The Middle-East and AfricaNanodiamonds Market, by Country, 2019 - 2026 (USD Million)
      3. 3.8.3. The Middle-East and Africa Market size and forecast, 2016-2026 (Kilos)
      4. 3.8.4. The Middle-East and AfricaNanodiamonds Market, by Country, 2019 - 2026 (Kilos)
      5. 3.8.5. The Middle-East and AfricaNanodiamonds Market, by Application, 2016-2026
        1. 3.8.5.1. The Middle-East and AfricaNanodiamonds Market, by Application, 2016-2026 (USD Million)
        2. 3.8.5.2. The Middle-East and AfricaNanodiamonds Market, by Application, 2016-2026 (Kilos)
      6. 3.8.6. GCC Countries
        1. 3.8.6.1. GCC Countries Market size and forecast, 2016-2026 (USD Million)
        2. 3.8.6.2. GCC Countries Market size and forecast, 2016-2026 (Kilos)
      7. 3.8.7. South Africa
        1. 3.8.7.1. South Africa Market size and forecast, 2016-2026 (USD Million)
        2. 3.8.7.2. South Africa Market size and forecast, 2016-2026 (Kilos)
      8. 3.8.8. Rest of Middle-East Africa
        1. 3.8.8.1. Rest of Middle-East Africa Market size and forecast, 2016-2026 (USD Million)
        2. 3.8.8.2. Rest of Middle-East Africa Market size and forecast, 2016-2026 (Kilos)
  4. CHAPTER 4. NanodiamondsProduction, Consumption, Export, Import by Regions
    1. 4.1. Global Nanodiamonds production and revenue, 2016-2026 (USD Million) (Kilos)
    2. 4.2. Global Import and Export Analysis, by Region
  5. CHAPTER 5. Nanodiamonds market – Competitive Landscape
    1. 5.1. Competitor Market Share – Revenue
    2. 5.2. Market Concentration Rate Analysis, Top 3 and Top 5 Players
    3. 5.3. Competitor Market Share – Volume
    4. 5.4. Strategic Development
      1. 5.4.1. Acquisitions and Mergers
      2. 5.4.2. New Products
      3. 5.4.3. Research & Development Activities
  6. CHAPTER 6. Company Profiles
    1. 6.1. Henan Yuxing Sino-Crystal Micron Diamond
      1. 6.1.1. Company Overview
      2. 6.1.2. Henan Yuxing Sino-Crystal Micron Diamond Sales, Revenue, Price, and Gross Margin
      3. 6.1.3. Product portfolio
      4. 6.1.4. Recent initiatives
    2. 6.2. Diacel Corporation
      1. 6.2.1. Company Overview
      2. 6.2.2. Diacel Corporation Sales, Revenue, Price, and Gross Margin
      3. 6.2.3. Product portfolio
      4. 6.2.4. Recent initiatives
    3. 6.3. Beijing Grish Hitech Co.
      1. 6.3.1. Company Overview
      2. 6.3.2. Beijing Grish Hitech Co. Sales, Revenue, Price, and Gross Margin
      3. 6.3.3. Product portfolio
      4. 6.3.4. Recent initiatives
    4. 6.4. Ltd.
      1. 6.4.1. Company Overview
      2. 6.4.2. Ltd. Sales, Revenue, Price, and Gross Margin
      3. 6.4.3. Product portfolio
      4. 6.4.4. Recent initiatives
    5. 6.5. Henan Union Abrasives Corp
      1. 6.5.1. Company Overview
      2. 6.5.2. Henan Union Abrasives Corp Sales, Revenue, Price, and Gross Margin
      3. 6.5.3. Product portfolio
      4. 6.5.4. Recent initiatives
    6. 6.6. Adamas Technologies
      1. 6.6.1. Company Overview
      2. 6.6.2. Adamas Technologies Sales, Revenue, Price, and Gross Margin
      3. 6.6.3. Product portfolio
      4. 6.6.4. Recent initiatives
    7. 6.7. NanoTech Lubricants
      1. 6.7.1. Company Overview
      2. 6.7.2. NanoTech Lubricants Sales, Revenue, Price, and Gross Margin
      3. 6.7.3. Product portfolio
      4. 6.7.4. Recent initiatives
    8. 6.8. Carbodeon Ltd. Oy
      1. 6.8.1. Company Overview
      2. 6.8.2. Carbodeon Ltd. Oy Sales, Revenue, Price, and Gross Margin
      3. 6.8.3. Product portfolio
      4. 6.8.4. Recent initiatives
    9. 6.9. Microdiamant
      1. 6.9.1. Company Overview
      2. 6.9.2. Microdiamant Sales, Revenue, Price, and Gross Margin
      3. 6.9.3. Product portfolio
      4. 6.9.4. Recent initiatives
    10. 6.10. NanoDiamond Products Limited
      1. 6.10.1. Company Overview
      2. 6.10.2. NanoDiamond Products Limited Sales, Revenue, Price, and Gross Margin
      3. 6.10.3. Product portfolio
      4. 6.10.4. Recent initiatives
    11. 6.11. Ray Techniques Ltd.
      1. 6.11.1. Company Overview
      2. 6.11.2. Ray Techniques Ltd. Sales, Revenue, Price, and Gross Margin
      3. 6.11.3. Product portfolio
      4. 6.11.4. Recent initiatives
    12. 6.12. SINTA
      1. 6.12.1. Company Overview
      2. 6.12.2. SINTA Sales, Revenue, Price, and Gross Margin
      3. 6.12.3. Product portfolio
      4. 6.12.4. Recent initiatives
  7. CHAPTER 7. Nanodiamonds — Industry Analysis
    1. 7.1. Introduction and Taxonomy
    2. 7.2. Nanodiamonds Market – Key Trends
      1. 7.2.1. Market Drivers
      2. 7.2.2. Market Restraints
      3. 7.2.3. Market Opportunities
    3. 7.3. Value Chain Analysis
    4. 7.4. Key Mandates and Regulations
    5. 7.5. Technology Roadmap and Timeline
    6. 7.6. Nanodiamonds market – Attractiveness Analysis
      1. 7.6.1. By Application
      2. 7.6.2. By Region
  8. CHAPTER 8. Raw Material analysis
    1. 8.1. Nanodiamonds Key Raw Material Analysis
      1. 8.1.1. Key Raw Materials
      2. 8.1.2. Price Trend of Key Raw Materials
    2. 8.2. Key Suppliers of Raw Materials
    3. 8.3. Proportion of Manufacturing Cost Structure
      1. 8.3.1. Raw Materials
      2. 8.3.2. Labor Cost
    4. 8.4. Manufacturing Expenses Analysis of Nanodiamonds
  9. CHAPTER 9. Industrial Chain, Sourcing Strategy and Downstream Buyers
    1. 9.1. Nanodiamonds Industrial Chain Analysis
    2. 9.2. Upstream Raw Materials Sourcing
      1. 9.2.1. Risk Mitigation:
      2. 9.2.2. Supplier Relationships:
      3. 9.2.3. Business Processes:
      4. 9.2.4. Securing the Product:
    3. 9.3. Raw Materials Sources of Nanodiamonds Major Manufacturers in 2016
    4. 9.4. Downstream Buyers
    5. 9.5. Distributors/Traders List
  10. CHAPTER 10. Marketing Strategy Analysis, Distributors
    1. 10.1. Marketing Channel
    2. 10.2. Direct Marketing
    3. 10.3. Indirect Marketing
    4. 10.4. Marketing Channel Development Trend
    5. 10.5. Economic/Political Environmental Change
  11. CHAPTER 11. Report Conclusion
  12. CHAPTER 12. Research Approach & Methodology
    1. 12.1. Report Description
    2. 12.2. Research Scope
    3. 12.3. Research Methodology
      1. 12.3.1. Secondary Research
      2. 12.3.2. Primary Research
      3. 12.3.3. Models
        1. 12.3.3.1. Company Share Analysis Model
        2. 12.3.3.2. Revenue Based Modeling
        3. 12.3.3.3. Research Limitations

        List of Figures

        FIG. 1 Global Nanodiamonds Market, 2016-2026(USD Million)
        FIG. 2 Global Nanodiamonds MarketShare, by Application, 2019 & 2026 (USD Million)
        FIG. 3 Global Nanodiamonds Market share, by Application, 2019 & 2026 (Kilos)
        FIG. 4 Global Finish polishingNanodiamondsMarket,2016-2026 (USD Million)
        FIG. 5 Global Finish polishingNanodiamonds  Market, 2016-2026 (Kilos)
        FIG. 6 Global ElectroplatingNanodiamondsMarket,2016-2026 (USD Million)
        FIG. 7 Global ElectroplatingNanodiamonds  Market, 2016-2026 (Kilos)
        FIG. 8 Global Oil compoundsNanodiamondsMarket,2016-2026 (USD Million)
        FIG. 9 Global Oil compoundsNanodiamonds  Market, 2016-2026 (Kilos)
        FIG. 10 Global OthersNanodiamondsMarket,2016-2026 (USD Million)
        FIG. 11 Global OthersNanodiamonds  Market, 2016-2026 (Kilos)
        FIG. 12 Global Nanodiamonds MarketShare, by Region, 2019 & 2026
        FIG. 13 Global Nanodiamonds MarketShare, by Region, 2019 & 2026
        FIG. 14 North AmericaNanodiamonds Market, 2016-2026
        FIG. 15 North AmericaNanodiamonds  Market, 2016-2026 (Kilos)
        FIG. 16 U.S.Nanodiamonds Market, 2016-2026
        FIG. 17 U.S.Nanodiamonds  Market, 2016-2026 (Kilos)
        FIG. 18 CanadaNanodiamonds Market, 2016-2026
        FIG. 19 CanadaNanodiamonds  Market, 2016-2026 (Kilos)
        FIG. 20 EuropeNanodiamonds Market, 2016-2026
        FIG. 21 EuropeNanodiamonds  Market, 2016-2026 (Kilos)
        FIG. 22 GermanyNanodiamonds Market, 2016-2026
        FIG. 23 GermanyNanodiamonds  Market, 2016-2026 (Kilos)
        FIG. 24 FranceNanodiamonds Market, 2016-2026
        FIG. 25 FranceNanodiamonds  Market, 2016-2026 (Kilos)
        FIG. 26 U.K.Nanodiamonds Market, 2016-2026
        FIG. 27 U.K.Nanodiamonds  Market, 2016-2026 (Kilos)
        FIG. 28 ItalyNanodiamonds Market, 2016-2026
        FIG. 29 ItalyNanodiamonds  Market, 2016-2026 (Kilos)
        FIG. 30 SpainNanodiamonds Market, 2016-2026
        FIG. 31 SpainNanodiamonds  Market, 2016-2026 (Kilos)
        FIG. 32 Rest of EuropeNanodiamonds Market, 2016-2026
        FIG. 33 Rest of EuropeNanodiamonds  Market, 2016-2026 (Kilos)
        FIG. 34 Asia PacificNanodiamonds Market, 2016-2026
        FIG. 35 Asia PacificNanodiamonds  Market, 2016-2026 (Kilos)
        FIG. 36 ChinaNanodiamonds Market, 2016-2026
        FIG. 37 ChinaNanodiamonds  Market, 2016-2026 (Kilos)
        FIG. 38 JapanNanodiamonds Market, 2016-2026
        FIG. 39 JapanNanodiamonds  Market, 2016-2026 (Kilos)
        FIG. 40 IndiaNanodiamonds Market, 2016-2026
        FIG. 41 IndiaNanodiamonds  Market, 2016-2026 (Kilos)
        FIG. 42 South  KoreaNanodiamonds Market, 2016-2026
        FIG. 43 South  KoreaNanodiamonds  Market, 2016-2026 (Kilos)
        FIG. 44 South-East AsiaNanodiamonds Market, 2016-2026
        FIG. 45 South-East AsiaNanodiamonds  Market, 2016-2026 (Kilos)
        FIG. 46 Rest of Asia PacificNanodiamonds Market, 2016-2026
        FIG. 47 Rest of Asia PacificNanodiamonds  Market, 2016-2026 (Kilos)
        FIG. 48 Latin AmericaNanodiamonds Market, 2016-2026
        FIG. 49 Latin AmericaNanodiamonds  Market, 2016-2026 (Kilos)
        FIG. 50 BrazilNanodiamonds Market, 2016-2026
        FIG. 51 BrazilNanodiamonds  Market, 2016-2026 (Kilos)
        FIG. 52 MexicoNanodiamonds Market, 2016-2026
        FIG. 53 MexicoNanodiamonds  Market, 2016-2026 (Kilos)
        FIG. 54 Rest of Latin AmericaNanodiamonds Market, 2016-2026
        FIG. 55 Rest of Latin AmericaNanodiamonds  Market, 2016-2026 (Kilos)
        FIG. 56 The Middle-East and AfricaNanodiamonds Market, 2016-2026
        FIG. 57 The Middle-East and AfricaNanodiamonds  Market, 2016-2026 (Kilos)
        FIG. 58 GCC CountriesNanodiamonds Market, 2016-2026
        FIG. 59 GCC CountriesNanodiamonds  Market, 2016-2026 (Kilos)
        FIG. 60 South AfricaNanodiamonds Market, 2016-2026
        FIG. 61 South AfricaNanodiamonds  Market, 2016-2026 (Kilos)
        FIG. 62 Rest of Middle-East AfricaNanodiamonds Market, 2016-2026
        FIG. 63 Rest of Middle-East AfricaNanodiamonds  Market, 2016-2026 (Kilos)
        FIG. 64 Global Nanodiamonds production and revenue, 2016-2026 (USD Million) (Kilos)
        FIG. 65 North AmericaNanodiamonds production and revenue, 2016-2026 (USD Million) (Kilos)
        FIG. 66 EuropeNanodiamonds production and revenue, 2016-2026 (USD Million) (Kilos)
        FIG. 67 Asia Pacific Nanodiamonds production and revenue, 2016-2026 (USD Million) (Kilos)
        FIG. 68 Latin America Nanodiamonds production and revenue, 2016-2026 (USD Million) (Kilos)
        FIG. 69 Middle East and Africa Nanodiamonds production and revenue, 2016-2026 (USD Million) (Kilos)
        FIG. 70 Competitor Market Share – Revenue
        FIG. 71 Competitor Market Share – Volume
        FIG. 72 Henan Yuxing Sino-Crystal Micron Diamond Revenue and Growth Rate
        FIG. 73 Henan Yuxing Sino-Crystal Micron Diamond Market Share
        FIG. 74 Diacel Corporation Revenue and Growth Rate
        FIG. 75 Diacel Corporation Market Share
        FIG. 76 Beijing Grish Hitech Co. Revenue and Growth Rate
        FIG. 77 Beijing Grish Hitech Co. Market Share
        FIG. 78 Ltd. Revenue and Growth Rate
        FIG. 79 Ltd. Market Share
        FIG. 80 Henan Union Abrasives Corp Revenue and Growth Rate
        FIG. 81 Henan Union Abrasives Corp Market Share
        FIG. 82 Adamas Technologies Revenue and Growth Rate
        FIG. 83 Adamas Technologies Market Share
        FIG. 84 NanoTech Lubricants Revenue and Growth Rate
        FIG. 85 NanoTech Lubricants Market Share
        FIG. 86 Carbodeon Ltd. Oy Revenue and Growth Rate
        FIG. 87 Carbodeon Ltd. Oy Market Share
        FIG. 88 Microdiamant Revenue and Growth Rate
        FIG. 89 Microdiamant Market Share
        FIG. 90 NanoDiamond Products Limited Revenue and Growth Rate
        FIG. 91 NanoDiamond Products Limited Market Share
        FIG. 92 Ray Techniques Ltd. Revenue and Growth Rate
        FIG. 93 Ray Techniques Ltd. Market Share
        FIG. 94 SINTA Revenue and Growth Rate
        FIG. 95 SINTA Market Share
        FIG. 96 Market Dynamics
        FIG. 97 Global Nanodiamonds – Value Chain Analysis
        FIG. 98 Key Mandates and Regulations
        FIG. 99 Technology Roadmap and Timeline
        FIG. 100 Market Attractiveness Analysis – By Application
        FIG. 101 Market Attractiveness Analysis – By Region
        FIG. 102 Manufacturing Cost Structure of Nanodiamonds
        FIG. 103 Nanodiamonds Industrial Chain Analysis
        FIG. 104 Market Channel
        FIG. 105 Marketing Channel Development Trend
        FIG. 106 Growth in World Gross Product, 2008-2019

        List of Tables

        TABLE 1 Global Nanodiamonds market, 2019& 2026 (USD Million)
        TABLE 2 Global Nanodiamonds market, by Application, 2016-2026 (USD Million)
        TABLE 3 Global Nanodiamonds market, by Application, 2016-2026 (Kilos)
        TABLE 4 Global Nanodiamonds market, by region, 2016-2026 (USD Million)
        TABLE 5 Global Nanodiamonds market, by region, 2016-2026 (Kilos)
        TABLE 6 North AmericaNanodiamonds Market, by Application, 2016-2026 (USD Million)
        TABLE 7 North AmericaNanodiamonds Market, by Application, 2016-2026 (Kilos)
        TABLE 8 EuropeNanodiamonds Market, by Application, 2016-2026 (USD Million)
        TABLE 9 EuropeNanodiamonds Market, by Application, 2016-2026 (Kilos)
        TABLE 10 Asia PacificNanodiamonds Market, by Application, 2016-2026 (USD Million)
        TABLE 11 Asia PacificNanodiamonds Market, by Application, 2016-2026 (Kilos)
        TABLE 12 Latin AmericaNanodiamonds Market, by Application, 2016-2026 (USD Million)
        TABLE 13 Latin AmericaNanodiamonds Market, by Application, 2016-2026 (Kilos)
        TABLE 14 The Middle-East and AfricaNanodiamonds Market, by Application, 2016-2026 (USD Million)
        TABLE 15 The Middle-East and AfricaNanodiamonds Market, by Application, 2016-2026 (Kilos)
        TABLE 16 North America NanodiamondsProduction, Consumption, Export, Import, 2016-2019
        TABLE 17 Europe NanodiamondsProduction, Consumption, Export, Import, 2016-2019
        TABLE 18 Asia Pacific NanodiamondsProduction, Consumption, Export, Import, 2016-2019
        TABLE 19 Latin America NanodiamondsProduction, Consumption, Export, Import, 2016-2019
        TABLE 20 Middle East & Africa NanodiamondsProduction, Consumption, Export, Import, 2016-2019
        TABLE 21 Global Nanodiamonds Market - Company Revenue Analysis 2016-2019 (USD Million)
        TABLE 22 Global Nanodiamonds Market - Company Revenue Share Analysis 2016-2019(%)
        TABLE 23 Global Nanodiamonds Market - Company Volume Analysis 2016-2019 (Kilos)
        TABLE 24 Global Nanodiamonds Market - Company Volume Share Analysis 2016-2019(%)
        TABLE 25 Acquisitions and Mergers
        TABLE 26 New Product/Service Launch
        TABLE 27 Research & Development Activities
        TABLE 28 Market Drivers
        TABLE 29 Market Restraints
        TABLE 30 Market Opportunities
        TABLE 31 Production Base and Market Concentration Rate of Raw Material
        TABLE 32 Key Suppliers of Raw Materials
        TABLE 33 Raw Materials Sources of Nanodiamonds Major Manufacturers in 2016
        TABLE 34 Major Buyers of Nanodiamonds
        TABLE 35 Distributors/Traders of Nanodiamonds by Region

Industry Major Market Players

  • Kent & Yorkshire Gaskets
  • Modus Advanced
  • Silex
  • Warco
  • Fuji Polymer Industries
  • Samco
  • EREFSA
  • Zenith
  • Mosites Rubber
  • Kiran Rubber
  • 3A Rubber
  • MER-Europe
  • Jingdong Rubber
  • Silicone Engineering
  • White Cross Rubber