![]()
Search Market Research Report
LiDAR Market Size, Share Global Analysis Report, 2020–2026

LiDAR Market By Type (Solid-State and Mechanical), By Technology (2D LiDAR, 3D LiDAR, and 4D LiDAR), By Range (Long, Medium, and Short), By Installation Type (Airborne LiDAR and Ground-Based LiDAR), By Component (Navigation & Positioning Systems, Laser Scanners, and Others), By Service (Ground-Based Surveying, Aerial Surveying, GIS Services, Asset Management, and Other Services), By Application (Exploration, ADAS & Driverless Cars, Urban Planning, Corridor Mapping, Environment, Engineering, Meteorology, Cartography, and Other Applications), By End-Use Industry (Consumer Electronics, Automotive & Transportation, Metals & Chemicals, Oil & Gas, Smart Cities & Building Automation, Medical, Power Stations, Food & Beverages, Water & Wastewater, and Mining), And By Region: Global Industry Outlook, Market Size, Business Intelligence, Consumer Preferences, Statistical Surveys, Comprehensive Analysis, Historical Developments, Current Trends, and Forecast 2020–2026
Industry Insights
This specialized and expertise oriented industry research report scrutinizes the technical and commercial business outlook of the global LiDAR industry. The report analyzes and declares the historical and current trends analysis of the global LiDAR industry and subsequently recommends the projected trends anticipated to be observed in the global LiDAR market during the upcoming years.
The global LiDAR market report analyzes and notifies the industry statistics at the global as well as regional and country levels in order to acquire a thorough perspective of the entire global LiDAR market. The historical and past insights are provided for FY 2016 to FY 2019 whereas projected trends are delivered for FY 2020 to FY 2026. The quantitative and numerical data is represented in terms of value (USD Million) from FY 2016 – 2026.
The quantitative data is further underlined and reinforced by comprehensive qualitative data which comprises various across-the-board market dynamics. The rationales which directly or indirectly impact the global LiDAR industry are exemplified through parameters such as growth drivers, restraints, challenges, and opportunities among other impacting factors.
Throughout our research report, we have encompassed all the proven models and tools of industry analysis and extensively illustrated all the key business strategies and business models adopted in the global LiDAR industry. The report provides an all-inclusive and detailed competitive landscape prevalent in the global LiDAR market.
The report utilizes established industry analysis tools and models such as Porter’s Five Forces framework to analyze and recognize critical business strategies adopted by various stakeholders involved in the entire value chain of the global LiDAR industry. The global LiDAR market report additionally employs SWOT analysis and PESTLE analysis models for further in-depth analysis.
The report study further includes an in-depth analysis of industry players' market shares and provides an overview of leading players' market position in the global LiDAR sector. Key strategic developments in the global LiDAR market competitive landscape such as acquisitions & mergers, inaugurations of different products and services, partnerships & joint ventures, MoU agreements, VC & funding activities, R&D activities, and geographic expansion among other noteworthy activities by key players of the global LiDAR market are appropriately highlighted in the report.
LiDAR (light detection and ranging) is a remote sensing technology that makes use of advanced light-detecting sensors to measure ranges. The sensors estimate the range between the source and obstruction through scattered light measurements. Both LiDAR and radar technology follow the same approach, but the former one uses short-wavelength rays for measuring range. LiDAR systems are extensively used in construction, automotive, consumer electronics, mining, and many other sectors. Moreover, the adoption rate of these systems has escalated remarkably with the emergence of 4D LiDAR technology. All the aforementioned factors are propelling the global LiDAR market growth.
The global LiDAR market research report delivers an acute valuation and taxonomy of the global LiDAR industry by practically splitting the market on the basis of different types, technologies, ranges, installation types, components, services, applications, end-use industries, and regions. Through the analysis of the historical and projected trends, all the segments and sub-segments were evaluated through the bottom-up approach, and different market sizes have been projected for FY 2020 to FY 2026. The regional segmentation of the global LiDAR industry includes the complete classification of all the major continents including North America, Latin America, Europe, Asia Pacific, and Middle East & Africa. Further, country-wise data for the global LiDAR industry is provided for the leading economies of the world.
The global LiDAR market is segmented based on the type, technology, range, installation type, component, service, application, end-use industry, and region. The type segments the global LiDAR market into solid-state and mechanical. On the basis of technology, the global industry is categorized into 2D LiDAR, 3D LiDAR, and 4D LiDAR. By installation type, the global sector is bifurcated into airborne LiDAR and ground-based LiDAR. Component-wise, the market is divided into navigation and positioning systems, laser scanners, and others. Based on the service, the global industry is fragmented into ground-based surveying, aerial surveying, GIS services, asset management, and other services. By application, the global sector is scattered into exploration, ADAS & driverless cars, urban planning, corridor mapping, environment, engineering, meteorology, cartography, and other applications. Based on the end-use industry, the global market is partitioned into consumer electronics, automotive & transportation, metals & chemicals, oil & gas, smart cities & building automation, medical, power stations, food & beverages, water & wastewater, and mining.
 Report Scope
Report Attribute |
Details |
Market Size in 2019 |
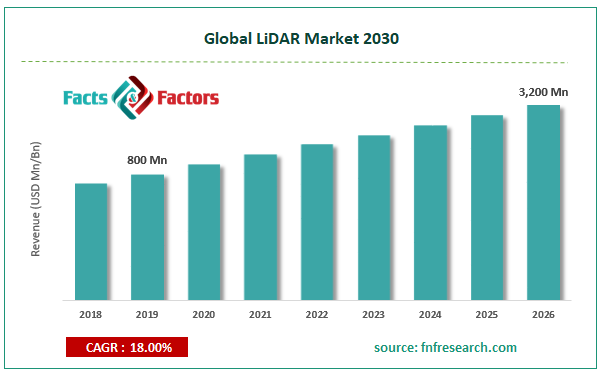
USD 800 Million |
Projected Market Size in 2026 |
USD 3,200 Million |
Growth Rate |
CAGR 18% |
Base Year |
2019 |
Forecast Years |
2020-2026 |
Key Market Players |
Quantum Spatial, VelodyneLidar, Hexagon, RIEGL, YellowScan, SICK AG, Teledyne Technologies, FARO, Beijing Beiketian Technology Co Ltd, Trimble and Others |
Key Segment |
By Type, By Technology, By Range, By Installation Type, By Component, By Service, By Application and By Region |
Major Regions Covered |
North America, Europe, Asia Pacific, Latin America, and the Middle East & Africa |
Purchase Options |
Request customized purchase options to meet your research needs. Explore purchase options |
Some of the essential players operating in the global LiDAR market, but not restricted to include
- Quantum Spatial
- Velodyne Lidar
- Hexagon
- RIEGL
- YellowScan
- SICK AG
- Teledyne Technologies
- FARO
- Beijing Beiketian Technology Co. Ltd.
- Trimble
The taxonomy of the global LiDAR industry by its scope and segmentation is as follows:
Type Segmentation Analysis
- Solid-state
- Mechanical
Technology Segmentation Analysis
- 2D LiDAR
- 3D LiDAR
- 4D LiDAR
Range Segmentation Analysis
- Long
- Medium
- Short
Installation Type Segmentation Analysis
- Airborne LiDAR
- Ground-based LiDAR
Component Segmentation Analysis
- Navigation and positioning systems
- Laser scanners
- Others
Service Segmentation Analysis
- Ground-based surveying
- Aerial surveying
- GIS services
- Asset management
- Other services
Application Segmentation Analysis
- Exploration
- ADAS & driverless cars
- Urban planning
- Corridor mapping
- Environment
- Engineering
- Meteorology
- Cartography
- Other applications
End-Use Industry Segmentation Analysis
- Consumer electronics
- Automotive & transportation
- Metals & chemicals
- Oil & gas
- Smart cities & building automation
- Medical
- Power stations
- Food & beverages
- Water & wastewater
- Mining
Regional Segmentation Analysis
- North America
- The U.S.
- Canada
- Europe
- Germany
- The UK
- France
- Spain
- Italy
- Rest of Europe
- Asia Pacific
- China
- Japan
- India
- South Korea
- Southeast Asia
- Rest of Asia Pacific
- Latin America
- Brazil
- Mexico
- Rest of Latin America
- Middle East & Africa
- GCC
- South Africa
- Rest of Middle East & Africa
Table of Content
Industry Major Market Players
- Quantum Spatial
- Velodyne Lidar
- Hexagon
- RIEGL
- YellowScan
- SICK AG
- Teledyne Technologies
- FARO
- Beijing Beiketian Technology Co. Ltd.
- Trimble


Copyright © 2025 - 2026, All Rights Reserved, Facts and Factors