![]()
Search Market Research Report
Leather Chemicals Market Size, Share Global Analysis Report, 2020–2026

Leather Chemicals Market By Product (Chromium Sulfate, Biocides, Surfactants, Polyurethane Resins, Sodium Bicarbonate, and Others), By Process (Tanning & Dyeing Chemicals, Beamhouse Chemicals, and Finishing Chemicals), By End-Use (Upholstery, Textile & Fashion, Automotive, Furniture, and Leather Goods), and By Region: Global Industry Outlook, Market Size, Business Intelligence, Consumer Preferences, Statistical Surveys, Comprehensive Analysis, Historical Developments, Current Trends, and Forecast 2020–2026
Industry Insights
This specialized and expertise oriented industry research report scrutinizes the technical and commercial business outlook of the Leather Chemicals industry. The report analyzes and declares the historical and current trends analysis of the Leather Chemicals industry and subsequently recommends the projected trends anticipated to be observed in the global Leather Chemicals market during the upcoming years.
The global Leather Chemicals market report analyzes and notifies the industry statistics at the global as well as regional and country levels in order to acquire a thorough perspective of the entire Leather Chemicals market. The historical and past insights are provided for FY 2016 to FY 2019 whereas projected trends are delivered for FY 2020 to FY 2026. The quantitative and numerical data is represented in terms of both volume (Kilo Tons) and value (USD Billion) from FY 2016 – 2026.
The quantitative data is further underlined and reinforced by comprehensive qualitative data which comprises various across-the-board market dynamics. The rationales which directly or indirectly impact the Leather Chemicalsindustry are exemplified through parameters such as growth drivers, restraints, challenges, and opportunities among other impacting factors.
Throughout our research report, we have encompassed all the proven models and tools of industry analysis and extensively illustrated all the key business strategies and business models adopted in the Leather Chemicals industry. The report provides an all-inclusive and detailed competitive landscape prevalent in the global Leather Chemicals market.
The report utilizes established industry analysis tools and models such as Porter’s Five Forces framework to analyze and recognize critical business strategies adopted by various stakeholders involved in the entire value chain of the Leather Chemicals industry. The global Leather Chemicals market report additionally employs SWOT analysis and PESTLE analysis models for further in-depth analysis.
The report study further includes an in-depth analysis of industry players' market shares and provides an overview of leading players' market position in the Leather Chemicals sector. Key strategic developments in the global Leather Chemicals market competitive landscape such as acquisitions & mergers, inaugurations of different products and services, partnerships & joint ventures, MoU agreements, VC & funding activities, R&D activities, and geographic expansion among other noteworthy activities by key players of the global Leather Chemicals market are appropriately highlighted in the report.
Leather chemicals are applied to the hides and skins to eliminate the chances of microorganism-related deteriorations and also to improve the texture of leather, thereby augmenting the growth of the global Leather Chemicals market. These chemicals are used to give leather a rich appeal and to make it long lasting. The leather chemicals are used at different stages of leather production. The processing starts with beamhouse operations tailed by tanning operations. The leather chemicals along with some nanoparticles or microparticles help improve color, texture, water & abrasion resistance, and aesthetic value of the leather.
The increasing use of leather in the automotive upholstery and furnishing industry is anticipated to propel the global Leather Chemicals market during the forecast period. Additionally, the ongoing research and R&D activities for the development of eco-friendly or bio-based products help offer new avenues for the Leather Chemicals market. Furthermore, the high demand for prevention of microorganism-based deterioration prevention and texture improvement is likely to promulgate the market growth. Growing demand for leather in the textile, footwear, furnishing, and other end-user industries coupled with the consumer preferences for fashion-oriented generation will further surge the market growth. However, the stringent government regulations, environmental problems associated with hazardous chemicals, Registration, Evaluation, Authorization and Restriction of Chemical substances (REACH) set regulatory policies, health issues, and surging operational charges may hinder the market growth.
The global Leather Chemicals market research report delivers an acute valuation and taxonomy of the Leather Chemicals industry by practically splitting the market on the basis of different product, process, end-use, and regions. Through the analysis of the historical and projected trends, all the segments and sub-segments were evaluated through the bottom-up approach, and different market sizes have been projected for FY 2020 to FY 2026. The regional segmentation of the Leather Chemicals industry includes the complete classification of all the major continents including North America, Latin America, Europe, Asia Pacific, and Middle East & Africa. Further, country-wise data for the Leather Chemicals industry is provided for the leading economies of the world.
The global Leather Chemicals market is segmented based on Product, Process,and End-Use. On the basis of product segmentation, the market is classified into Chromium Sulfate, Biocides, Surfactants, Polyurethane Resins, Sodium Bicarbonate, and Others. In terms of process, the market for leather chemicals is segregated into Tanning & Dyeing Chemicals, Beamhouse Chemicals and Finishing Chemicals. By end-use, the global Leather Chemicals market is segmented into Upholstery, Textile & Fashion, Automotive, Furniture, and Leather Goods.
 Report Scope
Report Attribute |
Details |
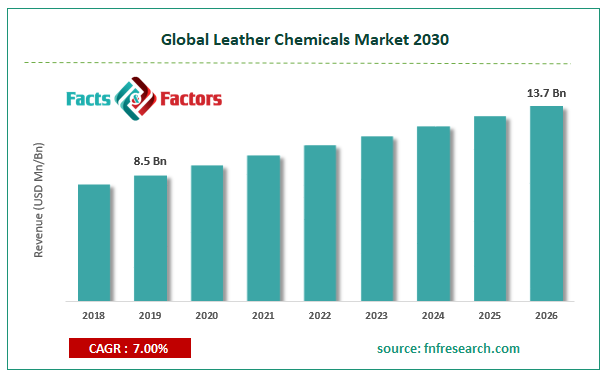
Market Size in 2019 |
USD 8.5 Billion |
Projected Market Size in 2026 |
USD 13.7 Billion |
Growth Rate |
CAGR 7% |
Base Year |
2019 |
Forecast Years |
2020-2026 |
Key Market Players |
Elementis PLC, Dystar Singapore Pte Ltd, Stahl International BV, Schill & Seilacher Gmbh & Co.KG, TEXAPEL, Tytan, Clariant International Ltd., ATC Chemicals, Lanxess, Bayer AG, Chemtan Company, Lanxess AG, TFL Ledertechnik Gmbh & Co.KG, BASF SE and Others |
Key Segment |
By Product, By Process, By End-Use and By Region |
Major Regions Covered |
North America, Europe, Asia Pacific, Latin America, and the Middle East & Africa |
Purchase Options |
Request customized purchase options to meet your research needs. Explore purchase options |
Some of the essential players operating in the global Leather Chemicals market, but not restricted to include
- Elementis PLC
- Dystar Singapore Pte Ltd
- Stahl International BV
- Schill & Seilacher Gmbh & Co.KG
- TEXAPEL
- Tytan
- Clariant International Ltd.
- ATC Chemicals
- Lanxess
- Bayer AG
- Chemtan Company
- Lanxess AG
- TFL Ledertechnik Gmbh & Co.KG
- BASF SE
The taxonomy of the Leather Chemicals industry by its scope and segmentation is as follows:
Product Segmentation Analysis
-
- Biocides
- Surfactants
- Chromium Sulfate
- Polyurethane Resins
- Sodium Bicarbonate
- Others
Process Segmentation Analysis
- Tanning & Dyeing
- Beamhouse
- Biocides
- Surfactant
- Sodium Sulfide
- Formic Acid
- Others
- Finishing
End-Use Segmentation Analysis
- Footwear
- Upholstery
- Textile & Fashion
- Automotive
- Furniture
- Leather Goods
Regional Segmentation Analysis
- North America
- The U.S.
- Canada
- Europe
- Germany
- The UK
- France
- Spain
- Italy
- Rest of Europe
- Asia Pacific
- China
- Japan
- India
- South Korea
- Southeast Asia
- Rest of Asia Pacific
- Latin America
- Brazil
- Mexico
- Rest of Latin America
- Middle East & Africa
- GCC
- South Africa
- Rest of Middle East & Africa
Table of Content
Industry Major Market Players
- Elementis PLC
- Dystar Singapore Pte Ltd
- Stahl International BV
- Schill & Seilacher Gmbh & Co.KG
- TEXAPEL
- Tytan
- Clariant International Ltd.
- ATC Chemicals
- Lanxess
- Bayer AG
- Chemtan Company
- Lanxess AG
- TFL Ledertechnik Gmbh & Co.KG
- BASF SE


Copyright © 2025 - 2026, All Rights Reserved, Facts and Factors