![]()
Search Market Research Report
Hemostats Market Size, Share Global Analysis Report, 2020–2026

Hemostats Market By Product (Gelatin-Based Hemostats, Oxidized Regenerated Cellulose Based Hemostats, Collagen-Based Hemostats, Combination Hemostats, and Thrombin-Based Hemostats), By Formulation (Sponge Hemostats, Matrix & Gel Hemostats, Powder Hemostats, and Sheet & Pad Hemostats), By Application (Neurological Surgery, Gynecological Surgery, Orthopedic Surgery, Cardiovascular Surgery, General Surgery, Reconstructive Surgery, and Other Surgeries), And By Region: Global Industry Outlook, Market Size, Business Intelligence, Consumer Preferences, Statistical Surveys, Comprehensive Analysis, Historical Developments, Current Trends, and Forecast 2020–2026
Industry Insights
This specialized and expertise oriented industry research report scrutinizes the technical and commercial business outlook of the global hemostats industry. The report analyzes and declares the historical and current trends analysis of the global hemostats industry and subsequently recommends the projected trends anticipated to be observed in the global hemostats market during the upcoming years.
The global hemostats market report analyzes and notifies the industry statistics at the global as well as regional and country levels in order to acquire a thorough perspective of the entire global hemostats market. The historical and past insights are provided for FY 2016 to FY 2019 whereas projected trends are delivered for FY 2020 to FY 2026. The quantitative and numerical data is represented in terms of both volume (K Units) and value (USD Billion) from FY 2016 – 2026.
The quantitative data is further underlined and reinforced by comprehensive qualitative data which comprises various across-the-board market dynamics. The rationales which directly or indirectly impact the global hemostatsindustry are exemplified through parameters such as growth drivers, restraints, challenges, and opportunities among other impacting factors.
Throughout our research report, we have encompassed all the proven models and tools of industry analysis and extensively illustrated all the key business strategies and business models adopted in the global hemostats industry. The report provides an all-inclusive and detailed competitive landscape prevalent in the global hemostats market.
The report utilizes established industry analysis tools and models such as Porter’s Five Forces framework to analyze and recognize critical business strategies adopted by various stakeholders involved in the entire value chain of the global hemostats industry. The global hemostats market report additionally employs SWOT analysis and PESTLE analysis models for further in-depth analysis.
The report study further includes an in-depth analysis of industry players' market shares and provides an overview of leading players' market position in the global hemostats sector. Key strategic developments in the global hemostats market competitive landscape such as acquisitions & mergers, inaugurations of different products and services, partnerships & joint ventures, MoU agreements, VC & funding activities, R&D activities, and geographic expansion among other noteworthy activities by key players of the global hemostats market are appropriately highlighted in the report.
A rise in the count of patients undergoing surgical treatments, the proliferation of sports injuries-related incidences, strict regulatory approvals, and mounting focus to combat the blood loss during surgical treatment, are some of the leading factors flourishing the global hemostats market. Moreover, the establishment of surgical centers and hospitals worldwide is likely to generate new opportunities for the leading players associated with the hemostats market in the coming years.
The global hemostats market research report delivers an acute valuation and taxonomy of the global hemostats industry by practically splitting the market on the basis of different products, formulations, applications, and regions. Through the analysis of the historical and projected trends, all the segments and sub-segments were evaluated through the bottom-up approach, and different market sizes have been projected for FY 2020 to FY 2026. The regional segmentation of the global hemostats industry includes the complete classification of all the major continents including North America, Latin America, Europe, Asia Pacific, and Middle East & Africa. Further, country-wise data for the global hemostats industry is provided for the leading economies of the world.
The global hemostats market is segmented based on the product, formulation, application, and region. Based on the product, the global hemostats industry is segmented into gelatin-based hemostats, oxidized regenerated cellulose-based hemostats, collagen-based hemostats, combination hemostats, and thrombin-based hemostats. By formulation, the global market is categorized into sponge hemostats, matrix & gel hemostats, powder hemostats, and sheet & pad hemostats. Application-wise, the global market is bifurcated into neurological surgery, gynecological surgery, orthopedic surgery, cardiovascular surgery, general surgery, reconstructive surgery, and other surgeries.
 Report Scope
Report Attribute |
Details |
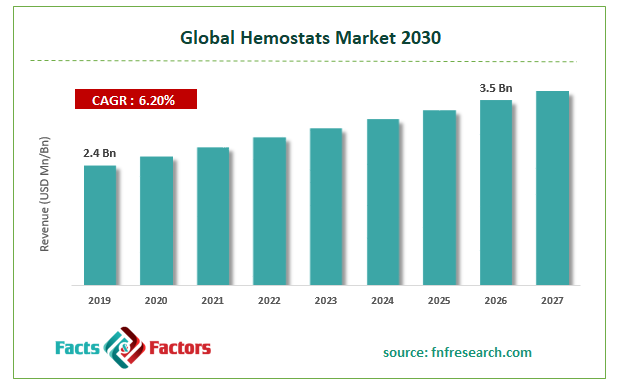
Market Size in 2019 |
USD 2.4 Billion |
Projected Market Size in 2026 |
USD 3.5 Billion |
CAGR Growth Rate |
6.2% CAGR |
Base Year |
2019 |
Forecast Years |
2020–2026 |
Key Market Players |
Marine Polymer Technologies Inc., Pfizer Inc., Baxter International Inc., Gelita Medical GmbH, Teleflex, B. Braun Melsungen AG, Z-Medica LLC, CR Bard Inc., Ethicon Inc., and Integra LifeSciences, among others. |
Key Segment |
By Product, By Formulation, By Application, and By Region |
Major Regions Covered |
North America, Europe, Asia Pacific, Latin America, and the Middle East & Africa |
Purchase Options |
Request customized purchase options to meet your research needs. Explore purchase options |
Some of the essential players operating in the global hemostats market, but not restricted to include
- Marine Polymer Technologies Inc.
- Pfizer Inc.
- Baxter International Inc.
- Gelita Medical GmbH
- Teleflex
- B. Braun Melsungen AG
- Z-Medica LLC
- CR Bard Inc.
- Ethicon Inc.
- Integra LifeSciences
- among others.
The taxonomy of the global hemostats market by its scope and segmentation is as follows:
Product Segmentation Analysis
- Gelatin-Based Hemostats
- Oxidized Regenerated Cellulose Based Hemostats
- Collagen-Based Hemostats
- Combination Hemostats
- Thrombin-Based Hemostats
Formulation Segmentation Analysis
- Sponge Hemostats
- Matrix & Gel Hemostats
- Powder Hemostats
- Sheet & Pad Hemostats
Application Segmentation Analysis
- Neurological Surgery
- Gynecological Surgery
- Orthopedic Surgery
- Cardiovascular Surgery
- General Surgery
- Reconstructive Surgery
- Other Surgeries
Global Hemostats Market: Regional Segmentation Analysis
- North America
- The U.S.
- Canada
- Europe
- Germany
- The UK
- France
- Spain
- Italy
- Rest of Europe
- Asia Pacific
- China
- Japan
- India
- South Korea
- Southeast Asia
- Rest of Asia Pacific
- Latin America
- Brazil
- Mexico
- Rest of Latin America
- Middle East & Africa
- GCC
- South Africa
- Rest of Middle East & Africa
Table of Content
Industry Major Market Players
- Marine Polymer Technologies Inc.
- Pfizer Inc.
- Baxter International Inc.
- Gelita Medical GmbH
- Teleflex
- B. Braun Melsungen AG


Copyright © 2025 - 2026, All Rights Reserved, Facts and Factors