![]()
Search Market Research Report
Ginseng Market Size, Share Global Analysis Report, 2020–2026

Ginseng Market By Dosage Form (Powder, Liquid, and Capsule), By Application (Personal Care & Cosmetics, Food, Dietary Supplement, and Pharmaceuticals), and By Region: Global Industry Outlook, Market Size, Business Intelligence, Consumer Preferences, Statistical Surveys, Comprehensive Analysis, Historical Developments, Current Trends, and Forecast 2020–2026
Industry Insights
This specialized and expertise oriented industry research report scrutinizes the technical and commercial business outlook of the Ginseng industry. The report analyzes and declares the historical and current trends analysis of the Ginseng industry and subsequently recommends the projected trends anticipated to be observed in the global Ginseng market during the upcoming years.
The global Ginseng market report analyzes and notifies the industry statistics at the global as well as regional and country levels in order to acquire a thorough perspective of the entire Ginseng market. The historical and past insights are provided for FY 2016 to FY 2019 whereas projected trends are delivered for FY 2020 to FY 2026. The quantitative and numerical data is represented in terms of both volume (Tons) and value (USD Billion) from FY 2016 – 2026.
The quantitative data is further underlined and reinforced by comprehensive qualitative data which comprises various across-the-board market dynamics. The rationales which directly or indirectly impact the Ginseng industry are exemplified through parameters such as growth drivers, restraints, challenges, and opportunities among other impacting factors.
Throughout our research report, we have encompassed all the proven models and tools of industry analysis and extensively illustrated all the key business strategies and business models adopted in the Ginseng industry. The report provides an all-inclusive and detailed competitive landscape prevalent in the global Ginseng market.
The report utilizes established industry analysis tools and models such as Porter’s Five Forces framework to analyze and recognize critical business strategies adopted by various stakeholders involved in the entire value chain of the Ginseng industry. The global Ginseng market report additionally employs SWOT analysis and PESTLE analysis models for further in-depth analysis.
The report study further includes an in-depth analysis of industry players' market shares and provides an overview of leading players' market position in the Ginseng sector. Key strategic developments in the global Ginseng market competitive landscape such as acquisitions & mergers, inaugurations of different products and services, partnerships & joint ventures, MoU agreements, VC & funding activities, R&D activities, and geographic expansion among other noteworthy activities by key players of the global Ginseng market are appropriately highlighted in the report.
Ginseng is a perennial plant with single stalk, fleshy roots, and green oval-shaped leaves. This herbal supplement is used on a commercial level owing to its excellent characteristics such as anti-cancer, anti-inflammatory, and antioxidant properties. It is used in homeopathic therapies including stress, low libido, attention deficit hyperactivity disorder, and depression.
The beneficial factors such as antioxidant, lowering blood sugar, brain function enhancement, strengthening of the immune system, and tackling tiredness is likely to help the Ginseng market expand during the forecast period. The adaptogenic plant’s essential chemical component ginsenosides are anticipated to increase its application in the various sectors such as food, personal care & cosmetics, dietary supplement, and pharmaceuticals. Furthermore, the growing aged population surges the demand for mitigating the unusual diseases, thereby broadening the opportunities of the Ginseng market. Apart from this, the functional properties such as concentration enhancement, muscle damage prevention, Alzheimer’s disease treatment, and physical stamina improvement of ginseng is projected to bolster the growth of the market. Moreover, the high demand for dietary supplements owing to the growing health consciousness among the consumers will further propel the market. Stringent government regulations promoting medicinal plant cultivation, low manufacturing cost, increasing R&D activities, Internet popularity, and the growing presence of market players is estimated to augment the global Ginseng market growth.
The global Ginseng market research report delivers an acute valuation and taxonomy of the Ginseng industry by practically splitting the market on the basis of different dosage forms, applications, and regions. Through the analysis of the historical and projected trends, all the segments and sub-segments were evaluated through the bottom-up approach, and different market sizes have been projected for FY 2020 to FY 2026. The regional segmentation of the Ginseng industry includes the complete classification of all the major continents including North America, Latin America, Europe, Asia Pacific, and Middle East & Africa. Further, country-wise data for the Ginseng industry is provided for the leading economies of the world.
The global Ginseng market is segmented based on Dosage Form and Application. On the basis of dosage form segmentation, the market is classified into Powder, Liquid, and Capsule. Based on the application, the market for ginseng is divided into Personal Care & Cosmetics, Food, Dietary Supplement, and Pharmaceuticals.
 Report Scope
Report Attribute |
Details |
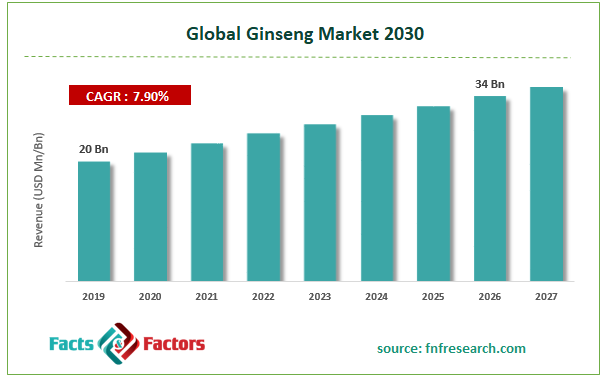
Market Size in 2019 |
USD 20 Billion |
Projected Market Size in 2026 |
USD 34 Billion |
CAGR Growth Rate |
7.9% CAGR |
Base Year |
2019 |
Forecast Years |
2020-2026 |
Key Market Players |
Hangzhou Skyherb Technologies Co., Ltd., KGEC, S.A., RFI ingredient, Shanti Natural, Herbal BioSolutions, Herbal Bioactives LLP, Ginsana,Orkla Health UK, Clariant, and Liuyang Naturalin Bio-Tech Co., Ltd. |
Key Segment |
By Dosage Form, By Application, and By Region |
Major Regions Covered |
North America, Europe, Asia Pacific, Latin America, and the Middle East & Africa |
Purchase Options |
Request customized purchase options to meet your research needs. Explore purchase options |
Some of the essential players operating in the global Ginseng market, but not restricted to include
- Hangzhou Skyherb Technologies Co. Ltd.
- KGEC
- S.A.
- RFI ingredient
- Shanti Natural
- Herbal BioSolutions
- Herbal Bioactives LLP
- Ginsana
- Orkla Health UK
- Clariant
- Liuyang Naturalin Bio-Tech Co. Ltd.
The taxonomy of the Ginseng industry by its scope and segmentation is as follows:
Dosage Form Segmentation Analysis
- Powder
- Liquid
- Capsule
- Others
Application Segmentation Analysis
- Personal Care & Cosmetics
- Food & Beverages
- Dietary Supplement
- Pharmaceuticals
Regional Segmentation Analysis
- North America
- The U.S.
- Canada
- Europe
- Germany
- The UK
- France
- Spain
- Italy
- Rest of Europe
- Asia Pacific
- China
- Japan
- India
- South Korea
- Southeast Asia
- Rest of Asia Pacific
- Latin America
- Brazil
- Mexico
- Rest of Latin America
- Middle East & Africa
- GCC
- South Africa
- Rest of Middle East & Africa
Table of Content
Industry Major Market Players
- Hangzhou Skyherb Technologies Co. Ltd.
- KGEC
- S.A.
- RFI ingredient
- Shanti Natural
- Herbal BioSolutions
- Herbal Bioactives LLP
- Ginsana
- Orkla Health UK
- Clariant
- and Liuyang Naturalin Bio-Tech Co. Ltd


Copyright © 2025 - 2026, All Rights Reserved, Facts and Factors