![]()
Search Market Research Report
Fruit Snacks Market Size, Share Global Analysis Report, 2020–2026

Fruit Snacks Market By Type (Sweets & Savory, Beverages, Dairy, and Others), By Fruit Family (Apple, Mango, Banana, Pineapple, Berry, and Mixed), By Distribution Channel (Mainstream Stores, Specialist Stores, and Online Retailers), and By Region: Global Industry Outlook, Market Size, Business Intelligence, Consumer Preferences, Statistical Surveys, Comprehensive Analysis, Historical Developments, Current Trends, and Forecast 2020–2026
Industry Insights
This specialized and expertise oriented industry research report scrutinizes the technical and commercial business outlook of the Fruit Snacks industry. The report analyzes and declares the historical and current trends analysis of the Fruit Snacks industry and subsequently recommends the projected trends anticipated to be observed in the global Fruit Snacks market during the upcoming years.
The global Fruit Snacks market report analyzes and notifies the industry statistics at the global as well as regional and country levels in order to acquire a thorough perspective of the entire Fruit Snacks market. The historical and past insights are provided for FY 2016 to FY 2019 whereas projected trends are delivered for FY 2020 to FY 2026. The quantitative and numerical data is represented in terms of both volume (Kilo Tons) and value (USD Billion) from FY 2016 – 2026.
The quantitative data is further underlined and reinforced by comprehensive qualitative data which comprises various across-the-board market dynamics. The rationales which directly or indirectly impact the Fruit Snacks industry are exemplified through parameters such as growth drivers, restraints, challenges, and opportunities among other impacting factors.
Throughout our research report, we have encompassed all the proven models and tools of industry analysis and extensively illustrated all the key business strategies and business models adopted in the Fruit Snacks industry. The report provides an all-inclusive and detailed competitive landscape prevalent in the global Fruit Snacks market.
The report utilizes established industry analysis tools and models such as Porter’s Five Forces framework to analyze and recognize critical business strategies adopted by various stakeholders involved in the entire value chain of the Fruit Snacks industry. The global Fruit Snacks market report additionally employs SWOT analysis and PESTLE analysis models for further in-depth analysis.
The report study further includes an in-depth analysis of industry players' market shares and provides an overview of leading players' market position in the Fruit Snacks sector. Key strategic developments in the global Fruit Snacks market competitive landscape such as acquisitions & mergers, inaugurations of different products and services, partnerships & joint ventures, MoU agreements, VC & funding activities, R&D activities, and geographic expansion among other noteworthy activities by key players of the global Fruit Snacks market are appropriately highlighted in the report.
Fruit snacks are similar to gummy candies in terms of sweetness. However, the fruit snacks contain refined sugar processed from fruits. These are the most preferred options among the parents to offer their children at times of snacking.
The growing preference for healthy snacks among the consumers is likely to help boost the growth of the global Fruit Snacks market. Additionally, the convenient on-the-go snacking habits coupled with the changing eating habits and rapid urbanization are anticipated to propel the market growth during the forecast period. The idea of snacking to substitute meals will further expand the industry. The fruit snacks contain minerals, vitamins, fibers, and various other nutrients that can help lower health risks such as heart diseases, obesity, and high blood pressure. Moreover, the hectic lifestyle has led to more concerns over health, thereby changing the eating behavior and accelerating the expansion of the global Fruit Snacks market. The high demand for nutrient-rich beverages, foods, and processed foods will accentuate the fruit snacks industry. Most importantly the growing younger and geriatric population, rising consumer spending power on food and health, and high disposable income surge the adoption of fruit snacks across the world. Apart from this, the online availability of fruit snacks and their health benefits along with the stringent government norms concerned with labeling & nutrient intake escalates the sales of healthy snacking choices which, in turn, will fuel the market growth. Additionally, technological advancement in the manufacturing and packaging sector will help avoid GMO or unsafe synthetic ingredients and introduce healthy products to attract consumers to support business growth. However, the expense of fruit snacks and quality concerns regarding strict regulatory standards may hinder the global Fruit Snacks market growth.
The global Fruit Snacks market research report delivers an acute valuation and taxonomy of the Fruit Snacks industry by practically splitting the market on the basis of different types, fruit families, distribution channels, and regions. Through the analysis of the historical and projected trends, all the segments and sub-segments were evaluated through the bottom-up approach, and different market sizes have been projected for FY 2020 to FY 2026. The regional segmentation of the Fruit Snacks industry includes the complete classification of all the major continents including North America, Latin America, Europe, Asia Pacific, and Middle East & Africa. Further, country-wise data for the Fruit Snacks industry is provided for the leading economies of the world.
The global Fruit Snacks market is segmented based on Type, Fruit Family, and Distribution Channel. On the basis of type segmentation, the market is classified into Sweets & Savory, Beverages, Dairy, and Others. By fruit family, the market for fruit snacks is divided into Apple, Mango, Banana, Pineapple, Berry, and Mixed. In terms of distribution channels, the global Fruit Snacks market is segregated into Mainstream Stores, Specialist Stores, and Online Retailers.
 Report Scope
Report Attribute |
Details |
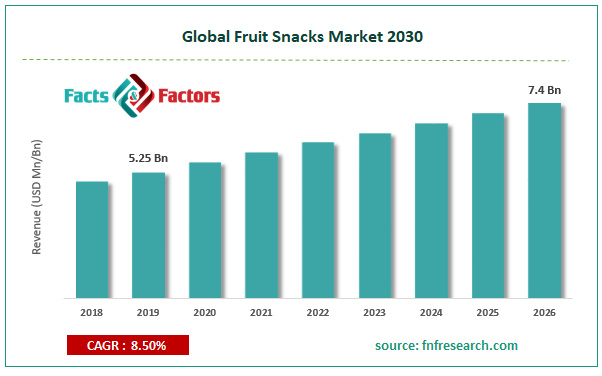
Market Size in 2019 |
USD 5.25 Billion |
Projected Market Size in 2026 |
USD 7.4 Billion |
CAGR Growth Rate |
8.5% CAGR |
Base Year |
2019 |
Forecast Years |
2020-2026 |
Key Market Players |
Sunkist Growers, Whitewave Services, General Mills, Kellogg, SunOpta, Bare Foods, Crunchies Natural Food, Nutty Godness, Crispy Green, Flaper, Welch's, Mount Franklin Foods, Paradise, Tropical Foods, and others. |
Key Segment |
By Type, By Fruit Family, By Distribution Channel, and By Region |
Major Regions Covered |
North America, Europe, Asia Pacific, Latin America, and the Middle East & Africa |
Purchase Options |
Request customized purchase options to meet your research needs. Explore purchase options |
Some of the essential players operating in the global Fruit Snacks market, but not restricted to include
- Sunkist Growers
- Whitewave Services
- General Mills
- Kellogg
- SunOpta
- Bare Foods
- Crunchies Natural Food
- Nutty Godness
- Crispy Green
- Flaper
- Welch's
- Mount Franklin Foods
- Paradise
Tropical Foods
The taxonomy of the Fruit Snacks industry by its scope and segmentation is as follows:
Type Segmentation Analysis
- Sweets & Savoury
- Freeze Dried
- Extruded Strips
- Others
- Beverages
- Dairy
Fruit Family Segmentation Analysis
- Apple
- Mango
- Banana
- Pineapple
- Berry
- Mixed
Distribution Channel Segmentation Analysis
- Mainstream Stores
- Specialist Stores
- Online Retailers
Regional Segmentation Analysis
- North America
- The U.S.
- Canada
- Europe
- Germany
- The UK
- France
- Spain
- Italy
- Rest of Europe
- Asia Pacific
- China
- Japan
- India
- South Korea
- Southeast Asia
- Rest of Asia Pacific
- Latin America
- Brazil
- Mexico
- Rest of Latin America
- Middle East & Africa
- GCC
- South Africa
- Rest of Middle East & Africa
Table of Content
Industry Major Market Players
- Sunkist Growers
- Whitewave Services
- General Mills
- Kellogg
- SunOpta
- Bare Foods
- Crunchies Natural Food
- Nutty Godness
- Crispy Green
- Flaper
- Welch's
- Mount Franklin Foods
- Paradise
Tropical Foods


Copyright © 2025 - 2026, All Rights Reserved, Facts and Factors