Search Market Research Report

Discover Our Latest Reports
Discover Our Featured Reports
Discover Top Selling Reports

Flavors and Fragrance Market Size, Share Global Analysis Report, 2021 – 2026

report img

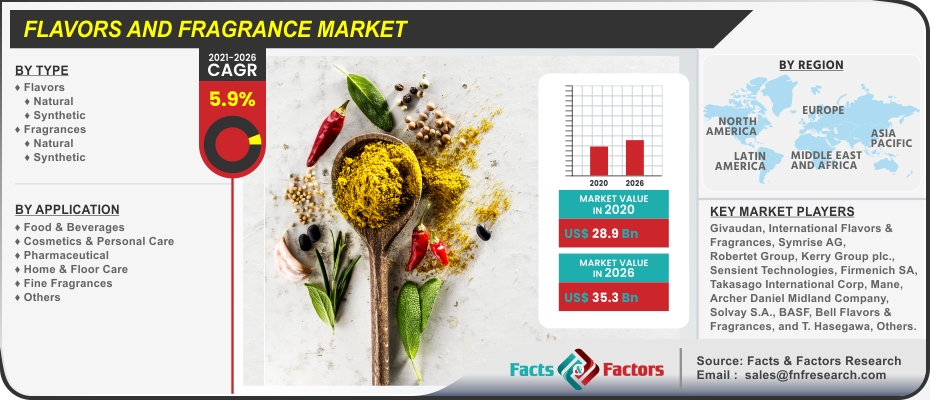
Flavors and Fragrance Market By Type (Flavors & Fragrances), By Application (Food & Beverages, Cosmetics & Personal Care, Pharmaceutical, Home & Floor Care, Fine Fragrances, & Others), And By Regions - Global & Regional Industry Perspective, Comprehensive Analysis, and Forecast 2021 – 2026

Industry Insights

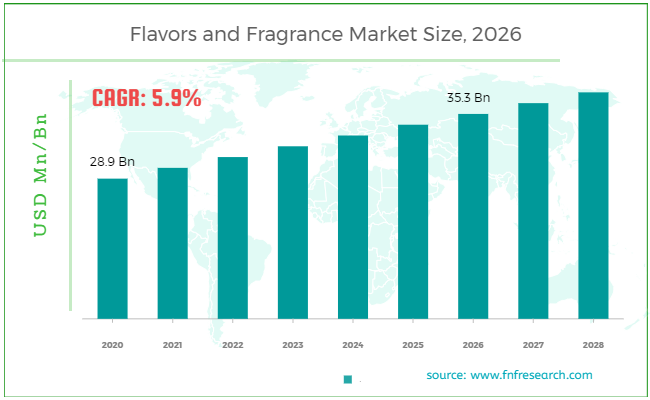
[209+ Pages Report] The latest market study surrounding the Global Flavors and Fragrance Market published by Facts & Factors offers complete market statistics and analytics. We at Facts & Factors estimate that the global flavors and fragrance market will reach a projected value of USD 35.3 Billion by 2026 growing at a CAGR of 5.9% from an initial value of USD 28.9 Billion in 2020.

Flavors and Fragrance Market Size

To know more about this report | Request Free Sample Copy

logoMarket Overview

Flavor or flavor is the perception of taste that a food article leaves on the tongue and is detected primarily by the chemical senses that are triggered by the gustatory and the olfactory systems in the human anatomy. The basic tastes are sweet, sour, bitter, salty, and umami and these tastes can be achieved artificially. The fragrance is an aroma compound that is also referred to as odorant or aroma and is the class of chemicals that deals with the ability to give the user a sense of smell or fragrance.

logoIndustry Growth Factors

The global flavors and fragrance market is expected to be occupied by contributing factors such as the rising targeted population from emerging economies coupled with the rising awareness among consumers owing to added benefits of the ingredients in food articles to name a few. Additionally, shifting consumers preferences to convenience foods coupled with increasing demand for consumer-based products is expected to increase the footprint of the global flavors and fragrance market during the forecast period. However, increased consumer participation in processed & packaged food products coupled with a rising working population is expected to boost the growth of the global flavors and fragrance market during the forecast period.

The global flavors and fragrance market is expected to be driven by factors such as the increasing digitization of the retail industry coupled with the increasing presence of the online food sector to name a few.  Moreover, the increased focus of key market participants in the development of regional and novel flavors and fragrances is expected to fuel the growth of the global flavors and fragrance market during the advent of the forecast. However, the rising compliance pertaining to quality and increasing regulatory standards imposed by various governing bodies is expected to hamper the growth of the global flavors and fragrance market during the forecast period.

Flavors and Fragrance Market

To know more about this report | Request Free Sample Copy

logoSegmentation Analysis

The global flavors and fragrance market is segmented into type, application, and region.

On the basis of type, the global flavors and fragrance market is divided into natural and synthetic. The segment pertaining to flavors is expected to witness the largest market share during the advent of the forecast owing to increasing demands from various sectors such as pharmaceutical and cosmetics coupled with rising functionality in terms of integration with various snacks, sodas, savories & dairy products to name a few. Additionally, factors pertaining to increased capability in terms of altering the taste of the products are expected to cement the dominant market position of the latter during the forecast period. On the basis of application, the global flavors and fragrance market is categorized into food & beverages, cosmetics & personal care, pharmaceutical, home & floor care, fine fragrances, and others. The food & beverages segment is expected to occupy the largest market share during the advent of the forecast owing to the integration of attractive taste and smell coupled with an increasing number of different flavors in hot beverages, soups, and tobacco products to name a few. Moreover, large-scale consumption of flavors from increasing consumer demand coupled with increased demand for home & floor care products is expected to cement the dominant market position of the latter during the forecast period.

logoReport Scope

Report Attribute

Details

Market Size in 2020

USD 28.9 Billion

Projected Market Size in 2026

USD 35.3 Billion

CAGR Growth Rate

5.9% CAGR

Base Year

2020

Forecast Years

2021-2026

Key Market Players

Givaudan, International Flavors & Fragrances, Symrise AG, Robertet Group, Kerry Group plc., Sensient Technologies, Firmenich SA, Takasago International Corp, Mane, Archer Daniel Midland Company, Solvay S.A., BASF, Bell Flavors & Fragrances, and T. Hasegawa, among others.

Key Segment

By Type, Application, and Region

Major Regions Covered

North America, Europe, Asia Pacific, Latin America, and the Middle East & Africa

Purchase Options

Request customized purchase options to meet your research needs.Explore purchase options

logo Regional Analysis

Europe is expected to witness the largest market share during the advent of the forecast owing to a larger established food and beverage sector in the region coupled with increased uptake abilities in terms of manufacturing capabilities to name a few. Additionally, the presence of key market players in the region coupled with increased usage among liquid-based drinks is expected to increase the footprint of the flavors and fragrance market during the forecast period. Asia-Pacific is expected to witness the largest market share during the advent of the forecast owing to increased availability of raw materials for the production of flavors and fragrances-based products coupled with increased demands for processing, pharmaceuticals, dietary supplementary, and nutraceuticals to name a few. Additionally, changing consumer preference for exotic-based scents coupled with increasing demand from the sector of personal care, cosmetics, home care, and oral care, to name a few.

logo Competitive Players

The key market participants for the global flavors and fragrance market are :

  • Givaudan
  • International Flavors & Fragrances
  • Symrise AG
  • Robertet Group
  • Kerry Group plc.
  • Sensient Technologies
  • Firmenich SA
  • Takasago International Corp
  • Mane
  • Archer Daniel Midland Company
  • Solvay S.A.
  • BASF
  • Bell Flavors & Fragrances
  • T. Hasegawa

logo By Type Segment Analysis

  • Flavors
    • Natural
    • Synthetic
  • Fragrances
    • Natural
    • Synthetic

logo By Application Segment Analysis

  • Food & Beverages
  • Cosmetics & Personal Care
  • Pharmaceutical
  • Home & Floor Care
  • Fine Fragrances
  • Others

Table of Content

  1. Chapter 1 Executive Summary
    1. 1.1. Introduction of Flavors and Fragrance
    2. 1.2. Global Flavors and Fragrance Market, 2019 & 2026 (USD Billion)
    3. 1.3. Global Flavors and Fragrance Market, 2016 – 2026 (USD Billion)
    4. 1.4. Global Flavors and Fragrance Market Absolute Revenue Opportunity, 2016 – 2026 (USD Billion)
    5. 1.5. Global Flavors and Fragrance Market Incremental Revenue Opportunity, 2020 – 2026 (USD Billion)
  2. Chapter 2 Flavors and Fragrance Market – Type Analysis
    1. 2.1. Global Flavors and Fragrance Market – Type Overview
    2. 2.2. Global Flavors and Fragrance Market Share, by Type, 2019 & 2026 (USD Billion)
    3. 2.3. Flavors
      1. 2.3.1. Global Flavors Flavors and Fragrance Market, 2016 – 2026 (USD Billion)
    4. 2.4. Fragrances
      1. 2.4.1. Global Fragrances Flavors and Fragrance Market, 2016 – 2026 (USD Billion)
  3. Chapter 3 Flavors and Fragrance Market – Application Analysis
    1. 3.1. Global Flavors and Fragrance Market – Application Overview
    2. 3.2. Global Flavors and Fragrance Market Share, by Application, 2019 & 2026 (USD Billion)
    3. 3.3. Food & Beverages
      1. 3.3.1. Global Food & Beverages Flavors and Fragrance Market, 2016 – 2026 (USD Billion)
    4. 3.4. Cosmetics & Personal Care
      1. 3.4.1. Global Cosmetics & Personal Care Flavors and Fragrance Market, 2016 – 2026 (USD Billion)
    5. 3.5. Pharmaceutical
      1. 3.5.1. Global Pharmaceutical Flavors and Fragrance Market, 2016 – 2026 (USD Billion)
    6. 3.6. Home & Floor Care
      1. 3.6.1. Global Home & Floor Care Flavors and Fragrance Market, 2016 – 2026 (USD Billion)
    7. 3.7. Fine Fragrances
      1. 3.7.1. Global Fine Fragrances Flavors and Fragrance Market, 2016 – 2026 (USD Billion)
    8. 3.8. Others
      1. 3.8.1. Global Others Flavors and Fragrance Market, 2016 – 2026 (USD Billion)
  4. Chapter 4 Flavors and Fragrance Market – Regional Analysis
    1. 4.1. Global Flavors and Fragrance Market Regional Overview
    2. 4.2. Global Flavors and Fragrance Market Share, by Region, 2019 & 2026 (USD Billion)
    3. 4.3. North America
      1. 4.3.1. North America Flavors and Fragrance Market, 2016 – 2026 (USD Billion)
        1. 4.3.1.1. North America Flavors and Fragrance Market, by Country, 2016 - 2026 (USD Billion)
      2. 4.3.2. North America Flavors and Fragrance Market, by Type, 2016 – 2026
        1. 4.3.2.1. North America Flavors and Fragrance Market, by Type, 2016 – 2026 (USD Billion)
      3. 4.3.3. North America Flavors and Fragrance Market, by Application, 2016 – 2026
        1. 4.3.3.1. North America Flavors and Fragrance Market, by Application, 2016 – 2026 (USD Billion)
      4. 4.3.4. U.S.
        1. 4.3.4.1. U.S. Flavors and Fragrance Market, 2016 – 2026 (USD Billion)
      5. 4.3.5. Canada
        1. 4.3.5.1. Canada Flavors and Fragrance Market, 2016 – 2026 (USD Billion)
    4. 4.4. Europe
      1. 4.4.1. Europe Flavors and Fragrance Market, 2016 – 2026 (USD Billion)
        1. 4.4.1.1. Europe Flavors and Fragrance Market, by Country, 2016 - 2026 (USD Billion)
      2. 4.4.2. Europe Flavors and Fragrance Market, by Type, 2016 – 2026
        1. 4.4.2.1. Europe Flavors and Fragrance Market, by Type, 2016 – 2026 (USD Billion)
      3. 4.4.3. Europe Flavors and Fragrance Market, by Application, 2016 – 2026
        1. 4.4.3.1. Europe Flavors and Fragrance Market, by Application, 2016 – 2026 (USD Billion)
      4. 4.4.4. Germany
        1. 4.4.4.1. Germany Flavors and Fragrance Market, 2016 – 2026 (USD Billion)
      5. 4.4.5. France
        1. 4.4.5.1. France Flavors and Fragrance Market, 2016 – 2026 (USD Billion)
      6. 4.4.6. U.K.
        1. 4.4.6.1. U.K. Flavors and Fragrance Market, 2016 – 2026 (USD Billion)
      7. 4.4.7. Italy
        1. 4.4.7.1. Italy Flavors and Fragrance Market, 2016 – 2026 (USD Billion)
      8. 4.4.8. Spain
        1. 4.4.8.1. Spain Flavors and Fragrance Market, 2016 – 2026 (USD Billion)
      9. 4.4.9. Rest of Europe
        1. 4.4.9.1. Rest of Europe Flavors and Fragrance Market, 2016 – 2026 (USD Billion)
    5. 4.5. Asia Pacific
      1. 4.5.1. Asia Pacific Flavors and Fragrance Market, 2016 – 2026 (USD Billion)
        1. 4.5.1.1. Asia Pacific Flavors and Fragrance Market, by Country, 2016 - 2026 (USD Billion)
      2. 4.5.2. Asia Pacific Flavors and Fragrance Market, by Type, 2016 – 2026
        1. 4.5.2.1. Asia Pacific Flavors and Fragrance Market, by Type, 2016 – 2026 (USD Billion)
      3. 4.5.3. Asia Pacific Flavors and Fragrance Market, by Application, 2016 – 2026
        1. 4.5.3.1. Asia Pacific Flavors and Fragrance Market, by Application, 2016 – 2026 (USD Billion)
      4. 4.5.4. China
        1. 4.5.4.1. China Flavors and Fragrance Market, 2016 – 2026 (USD Billion)
      5. 4.5.5. Japan
        1. 4.5.5.1. Japan Flavors and Fragrance Market, 2016 – 2026 (USD Billion)
      6. 4.5.6. India
        1. 4.5.6.1. India Flavors and Fragrance Market, 2016 – 2026 (USD Billion)
      7. 4.5.7. South Korea
        1. 4.5.7.1. South Korea Flavors and Fragrance Market, 2016 – 2026 (USD Billion)
      8. 4.5.8. South-East Asia
        1. 4.5.8.1. South-East Asia Flavors and Fragrance Market, 2016 – 2026 (USD Billion)
      9. 4.5.9. Rest of Asia Pacific
        1. 4.5.9.1. Rest of Asia Pacific Flavors and Fragrance Market, 2016 – 2026 (USD Billion)
    6. 4.6. Latin America
      1. 4.6.1. Latin America Flavors and Fragrance Market, 2016 – 2026 (USD Billion)
        1. 4.6.1.1. Latin America Flavors and Fragrance Market, by Country, 2016 - 2026 (USD Billion)
      2. 4.6.2. Latin America Flavors and Fragrance Market, by Type, 2016 – 2026
        1. 4.6.2.1. Latin America Flavors and Fragrance Market, by Type, 2016 – 2026 (USD Billion)
      3. 4.6.3. Latin America Flavors and Fragrance Market, by Application, 2016 – 2026
        1. 4.6.3.1. Latin America Flavors and Fragrance Market, by Application, 2016 – 2026 (USD Billion)
      4. 4.6.4. Brazil
        1. 4.6.4.1. Brazil Flavors and Fragrance Market, 2016 – 2026 (USD Billion)
      5. 4.6.5. Mexico
        1. 4.6.5.1. Mexico Flavors and Fragrance Market, 2016 – 2026 (USD Billion)
      6. 4.6.6. Rest of Latin America
        1. 4.6.6.1. Rest of Latin America Flavors and Fragrance Market, 2016 – 2026 (USD Billion)
    7. 4.7. The Middle-East and Africa
      1. 4.7.1. The Middle-East and Africa Flavors and Fragrance Market, 2016 – 2026 (USD Billion)
        1. 4.7.1.1. The Middle-East and Africa Flavors and Fragrance Market, by Country, 2016 - 2026 (USD Billion)
      2. 4.7.2. The Middle-East and Africa Flavors and Fragrance Market, by Type, 2016 – 2026
        1. 4.7.2.1. The Middle-East and Africa Flavors and Fragrance Market, by Type, 2016 – 2026 (USD Billion)
      3. 4.7.3. The Middle-East and Africa Flavors and Fragrance Market, by Application, 2016 – 2026
        1. 4.7.3.1. The Middle-East and Africa Flavors and Fragrance Market, by Application, 2016 – 2026 (USD Billion)
      4. 4.7.4. GCC Countries
        1. 4.7.4.1. GCC Countries Flavors and Fragrance Market, 2016 – 2026 (USD Billion)
      5. 4.7.5. South Africa
        1. 4.7.5.1. South Africa Flavors and Fragrance Market, 2016 – 2026 (USD Billion)
      6. 4.7.6. Rest of Middle-East Africa
        1. 4.7.6.1. Rest of Middle-East Africa Flavors and Fragrance Market, 2016 – 2026 (USD Billion)
  5. Chapter 5 Flavors and Fragrance Market – Competitive Landscape
    1. 5.1. Competitor Market Share – Revenue
    2. 5.2. Market Concentration Rate Analysis, Top 3 and Top 5 Players
    3. 5.3. Strategic Developments
      1. 5.3.1. Acquisitions and Mergers
      2. 5.3.2. New Products
      3. 5.3.3. Research & Development Activities
  6. Chapter 6 Company Profiles
    1. 6.1. Givaudan
      1. 6.1.1. Company Overview
      2. 6.1.2. Product/Service Portfolio
      3. 6.1.3. Givaudan Sales, Revenue, and Gross Margin
      4. 6.1.4. Givaudan Revenue and Growth Rate
      5. 6.1.5. Givaudan Market Share
      6. 6.1.6. Recent Initiatives, Funding/VC Activities, and Technological Innovations
    2. 6.2. International Flavors & Fragrances
      1. 6.2.1. Company Overview
      2. 6.2.2. Product/Service Portfolio
      3. 6.2.3. International Flavors & Fragrances Sales, Revenue, and Gross Margin
      4. 6.2.4. International Flavors & Fragrances Revenue and Growth Rate
      5. 6.2.5. International Flavors & Fragrances Market Share
      6. 6.2.6. Recent Initiatives, Funding/VC Activities, and Technological Innovations
    3. 6.3. Symrise AG
      1. 6.3.1. Company Overview
      2. 6.3.2. Product/Service Portfolio
      3. 6.3.3. Symrise AG Sales, Revenue, and Gross Margin
      4. 6.3.4. Symrise AG Revenue and Growth Rate
      5. 6.3.5. Symrise AG Market Share
      6. 6.3.6. Recent Initiatives, Funding/VC Activities, and Technological Innovations
    4. 6.4. Robertet Group
      1. 6.4.1. Company Overview
      2. 6.4.2. Product/Service Portfolio
      3. 6.4.3. Robertet Group Sales, Revenue, and Gross Margin
      4. 6.4.4. Robertet Group Revenue and Growth Rate
      5. 6.4.5. Robertet Group Market Share
      6. 6.4.6. Recent Initiatives, Funding/VC Activities, and Technological Innovations
    5. 6.5. Kerry Group plc
      1. 6.5.1. Company Overview
      2. 6.5.2. Product/Service Portfolio
      3. 6.5.3. Kerry Group plc Sales, Revenue, and Gross Margin
      4. 6.5.4. Kerry Group plc Revenue and Growth Rate
      5. 6.5.5. Kerry Group plc Market Share
      6. 6.5.6. Recent Initiatives, Funding/VC Activities, and Technological Innovations
    6. 6.6. Sensient Technologies
      1. 6.6.1. Company Overview
      2. 6.6.2. Product/Service Portfolio
      3. 6.6.3. Sensient Technologies Sales, Revenue, and Gross Margin
      4. 6.6.4. Sensient Technologies Revenue and Growth Rate
      5. 6.6.5. Sensient Technologies Market Share
      6. 6.6.6. Recent Initiatives, Funding/VC Activities, and Technological Innovations
    7. 6.7. Firmenich SA
      1. 6.7.1. Company Overview
      2. 6.7.2. Product/Service Portfolio
      3. 6.7.3. Firmenich SA Sales, Revenue, and Gross Margin
      4. 6.7.4. Firmenich SA Revenue and Growth Rate
      5. 6.7.5. Firmenich SA Market Share
      6. 6.7.6. Recent Initiatives, Funding/VC Activities, and Technological Innovations
    8. 6.8. Takasago International Corp
      1. 6.8.1. Company Overview
      2. 6.8.2. Product/Service Portfolio
      3. 6.8.3. Takasago International Corp Sales, Revenue, and Gross Margin
      4. 6.8.4. Takasago International Corp Revenue and Growth Rate
      5. 6.8.5. Takasago International Corp Market Share
      6. 6.8.6. Recent Initiatives, Funding/VC Activities, and Technological Innovations
    9. 6.9. Mane
      1. 6.9.1. Company Overview
      2. 6.9.2. Product/Service Portfolio
      3. 6.9.3. Mane Sales, Revenue, and Gross Margin
      4. 6.9.4. Mane Revenue and Growth Rate
      5. 6.9.5. Mane Market Share
      6. 6.9.6. Recent Initiatives, Funding/VC Activities, and Technological Innovations
    10. 6.10. Archer Daniel Midland Company
      1. 6.10.1. Company Overview
      2. 6.10.2. Product/Service Portfolio
      3. 6.10.3. Archer Daniel Midland Company Sales, Revenue, and Gross Margin
      4. 6.10.4. Archer Daniel Midland Company Revenue and Growth Rate
      5. 6.10.5. Archer Daniel Midland Company Market Share
      6. 6.10.6. Recent Initiatives, Funding/VC Activities, and Technological Innovations
    11. 6.11. Solvay S.A
      1. 6.11.1. Company Overview
      2. 6.11.2. Product/Service Portfolio
      3. 6.11.3. Solvay S.A Sales, Revenue, and Gross Margin
      4. 6.11.4. Solvay S.A Revenue and Growth Rate
      5. 6.11.5. Solvay S.A Market Share
      6. 6.11.6. Recent Initiatives, Funding/VC Activities, and Technological Innovations
    12. 6.12. BASF
      1. 6.12.1. Company Overview
      2. 6.12.2. Product/Service Portfolio
      3. 6.12.3. BASF Sales, Revenue, and Gross Margin
      4. 6.12.4. BASF Revenue and Growth Rate
      5. 6.12.5. BASF Market Share
      6. 6.12.6. Recent Initiatives, Funding/VC Activities, and Technological Innovations
    13. 6.13. Bell Flavors & Fragrances
      1. 6.13.1. Company Overview
      2. 6.13.2. Product/Service Portfolio
      3. 6.13.3. Bell Flavors & Fragrances Sales, Revenue, and Gross Margin
      4. 6.13.4. Bell Flavors & Fragrances Revenue and Growth Rate
      5. 6.13.5. Bell Flavors & Fragrances Market Share
      6. 6.13.6. Recent Initiatives, Funding/VC Activities, and Technological Innovations
      7. 6.14. T. Hasegawa
      8. 6.14.1. Company Overview
      9. 6.14.2. Product/Service Portfolio
        1. 6.14.3. T. Hasegawa Sales, Revenue, and Gross Margin
        2. 6.14.4. T. Hasegawa Revenue and Growth Rate
        3. 6.14.5. T. Hasegawa Market Share
      10. 6.14.6. Recent Initiatives, Funding/VC Activities, and Technological Innovations
  7. Chapter 7 Flavors and Fragrance — Industry Analysis
    1. 7.1. Introduction and Taxonomy
    2. 7.2. Flavors and Fragrance Market – Key Trends
      1. 7.2.1. Market Drivers
      2. 7.2.2. Market Restraints
      3. 7.2.3. Market Opportunities
    3. 7.3. Value Chain Analysis
    4. 7.4. Key Mandates and Regulations
    5. 7.5. Technology Roadmap and Timeline
    6. 7.6. Flavors and Fragrance Market – Attractiveness Analysis
      1. 7.6.1. By Type
      2. 7.6.2. By Application
      3. 7.6.3. By Region
  8. Chapter 8 Industrial Chain, Sourcing Strategy, and Downstream Buyers
    1. 8.1. Flavors and Fragrance Industrial Chain Analysis
    2. 8.2. Downstream Buyers
    3. 8.3. Distributors/Traders List
  9. Chapter 9 Marketing Strategy Analysis
    1. 9.1. Marketing Channel
    2. 9.2. Direct Marketing
    3. 9.3. Indirect Marketing
    4. 9.4. Marketing Channel Development Trends
    5. 9.5. Economic/Political Environmental Change
  10. Chapter 10 Report Conclusion & Key Insights
    1. 10.1. Key Insights from Primary Interviews & Surveys Respondents
    2. 10.2. Key Takeaways from Analysts, Consultants, and Industry Leaders
  11. Chapter 11 Research Approach & Methodology
    1. 11.1. Report Description
    2. 11.2. Research Scope
    3. 11.3. Research Methodology
      1. 11.3.1. Secondary Research
      2. 11.3.2. Primary Research
      3. 11.3.3. Statistical Models
        1. 11.3.3.1. Company Share Analysis Model
        2. 11.3.3.2. Revenue Based Modeling
      4. 11.3.4. Research Limitations

      List of Figures

      Fig.1	Product Picture of Flavors and Fragrance
      Fig.2	Global Flavors and Fragrance Market, 2016 – 2026 (USD Billion)
      Fig.3	Global Flavors and Fragrance Market Absolute Revenue Opportunity, 2016 – 2026 (USD Billion)
      Fig.4	Global Flavors and Fragrance Market Incremental Revenue Opportunity, 2020 – 2026 (USD Billion)
      Fig.5	Global Flavors and Fragrance Market Share, by Type, 2019 & 2026 (USD Billion)
      Fig.6	Global Flavors   Flavors and Fragrance Market, 2016 – 2026 (USD Billion)
      Fig.7	Global Fragrances Flavors and Fragrance Market, 2016 – 2026 (USD Billion)
      Fig.8	Global Flavors and Fragrance Market Share, by Application, 2019 & 2026 (USD Billion)
      Fig.9	Global Food & Beverages Flavors and Fragrance Market, 2016 – 2026 (USD Billion)
      Fig.10	Global Cosmetics & Personal Care  Flavors and Fragrance Market, 2016 – 2026 (USD Billion)
      Fig.11	Global Pharmaceutical Flavors and Fragrance Market, 2016 – 2026 (USD Billion)
      Fig.12	Global Home & Floor Care Flavors and Fragrance Market, 2016 – 2026 (USD Billion)
      Fig.13	Global Fine Fragrances  Flavors and Fragrance Market, 2016 – 2026 (USD Billion)
      Fig.14	Global Others Flavors and Fragrance Market, 2016 – 2026 (USD Billion)
      Fig.15	Global Flavors and Fragrance Market Share, by Region, 2019 & 2026 (USD Billion)
      Fig.16	North America Flavors and Fragrance Market, 2016 – 2026 (USD Billion)
      Fig.17	U.S. Flavors and Fragrance Market, 2016 – 2026 (USD Billion)
      Fig.18	Canada Flavors and Fragrance Market, 2016 – 2026 (USD Billion)
      Fig.19	Europe Flavors and Fragrance Market, 2016 – 2026 (USD Billion)
      Fig.20	Germany Flavors and Fragrance Market, 2016 – 2026 (USD Billion)
      Fig.21	France Flavors and Fragrance Market, 2016 – 2026 (USD Billion)
      Fig.22	U.K. Flavors and Fragrance Market, 2016 – 2026 (USD Billion)
      Fig.23	Italy Flavors and Fragrance Market, 2016 – 2026 (USD Billion)
      Fig.24	Spain Flavors and Fragrance Market, 2016 – 2026 (USD Billion)
      Fig.25	Rest of Europe Flavors and Fragrance Market, 2016 – 2026 (USD Billion)
      Fig.26	Asia Pacific Flavors and Fragrance Market, 2016 – 2026 (USD Billion)
      Fig.27	China Flavors and Fragrance Market, 2016 – 2026 (USD Billion)
      Fig.28	Japan Flavors and Fragrance Market, 2016 – 2026 (USD Billion)
      Fig.29	India Flavors and Fragrance Market, 2016 – 2026 (USD Billion)
      Fig.30	South  Korea Flavors and Fragrance Market, 2016 – 2026 (USD Billion)
      Fig.31	South-East Asia Flavors and Fragrance Market, 2016 – 2026 (USD Billion)
      Fig.32	Rest of Asia Pacific Flavors and Fragrance Market, 2016 – 2026 (USD Billion)
      Fig.33	Latin America Flavors and Fragrance Market, 2016 – 2026 (USD Billion)
      Fig.34	Brazil Flavors and Fragrance Market, 2016 – 2026 (USD Billion)
      Fig.35	Mexico Flavors and Fragrance Market, 2016 – 2026 (USD Billion)
      Fig.36	Rest of Latin America Flavors and Fragrance Market, 2016 – 2026 (USD Billion)
      Fig.37	The Middle-East and Africa Flavors and Fragrance Market, 2016 – 2026 (USD Billion)
      Fig.38	GCC Countries Flavors and Fragrance Market, 2016 – 2026 (USD Billion)
      Fig.39	South Africa Flavors and Fragrance Market, 2016 – 2026 (USD Billion)
      Fig.40	Rest of Middle-East Africa Flavors and Fragrance Market, 2016 – 2026 (USD Billion)
      Fig.41	Competitor Market Share – Revenue
      Fig.42	Givaudan Revenue and Growth Rate
      Fig.43	Givaudan Market Share
      Fig.44	International Flavors & Fragrances Revenue and Growth Rate
      Fig.45	International Flavors & Fragrances Market Share
      Fig.46	Symrise AG Revenue and Growth Rate
      Fig.47	Symrise AG Market Share
      Fig.48	Robertet Group Revenue and Growth Rate
      Fig.49	Robertet Group Market Share
      Fig.50	Kerry Group plc Revenue and Growth Rate
      Fig.51	Kerry Group plc Market Share
      Fig.52	Sensient Technologies Revenue and Growth Rate
      Fig.53	Sensient Technologies Market Share
      Fig.54	Firmenich SA Revenue and Growth Rate
      Fig.55	Firmenich SA Market Share
      Fig.56	Takasago International Corp Revenue and Growth Rate
      Fig.57	Takasago International Corp Market Share
      Fig.58	Mane Revenue and Growth Rate
      Fig.59	Mane Market Share
      Fig.60	Archer Daniel Midland Company Revenue and Growth Rate
      Fig.61	Archer Daniel Midland Company Market Share
      Fig.62	Solvay S.A Revenue and Growth Rate
      Fig.63	Solvay S.A Market Share
      Fig.64	BASF Revenue and Growth Rate
      Fig.65	BASF Market Share
      Fig.66	Bell Flavors & Fragrances Revenue and Growth Rate
      Fig.67	Bell Flavors & Fragrances Market Share
      Fig.68	T. Hasegawa Revenue and Growth Rate
      Fig.69	T. Hasegawa Market Share
      Fig.70	Market Dynamics
      Fig.71	Global Flavors and Fragrance – Value Chain Analysis
      Fig.72	Key Mandates and Regulations
      Fig.73	Technology Roadmap and Timeline
      Fig.74	Market Attractiveness Analysis – By Type
      Fig.75	Market Attractiveness Analysis – By Application
      Fig.76	Market Attractiveness Analysis – By Region
      Fig.77	Flavors and Fragrance Industrial Chain Analysis
      Fig.78	Market Channels
      Fig.79	Marketing Channel Development Trend
      Fig.80	Growth in World Gross Product, 2008-2018
      

      List of Tables

      Table 1	Global Flavors and Fragrance Market, 2019 & 2026 (USD Billion)
      Table 2	Global Flavors and Fragrance Market, by Type, 2016 – 2026 (USD Billion)
      Table 3	Global Flavors and Fragrance Market, by Application, 2016 – 2026 (USD Billion)
      Table 4	Global Flavors and Fragrance Market, by Region, 2016 – 2026 (USD Billion)
      Table 5	North America Flavors and Fragrance Market, by Country, 2016 – 2026 (USD Billion)
      Table 6	North America Flavors and Fragrance Market, by Type, 2016 – 2026 (USD Billion)
      Table 7	North America Flavors and Fragrance Market, by Application, 2016 – 2026 (USD Billion)
      Table 8	Europe Flavors and Fragrance Market, by Country, 2016 – 2026 (USD Billion)
      Table 9	Europe Flavors and Fragrance Market, by Type, 2016 – 2026 (USD Billion)
      Table 10 Europe Flavors and Fragrance Market, by Application, 2016 – 2026 (USD Billion)
      Table 11 Asia Pacific Flavors and Fragrance Market, by Country, 2016 – 2026 (USD Billion)
      Table 12 Asia Pacific Flavors and Fragrance Market, by Type, 2016 – 2026 (USD Billion)
      Table 13 Asia Pacific Flavors and Fragrance Market, by Application, 2016 – 2026 (USD Billion)
      Table 14 Latin America Flavors and Fragrance Market, by Country, 2016 – 2026 (USD Billion)
      Table 15 Latin America Flavors and Fragrance Market, by Type, 2016 – 2026 (USD Billion)
      Table 16 Latin America Flavors and Fragrance Market, by Application, 2016 – 2026 (USD Billion)
      Table 17 The Middle-East and Africa Flavors and Fragrance Market, by Country, 2016 – 2026 (USD Billion)
      Table 18 The Middle-East and Africa Flavors and Fragrance Market, by Type, 2016 – 2026 (USD Billion)
      Table 19 The Middle-East and Africa Flavors and Fragrance Market, by Application, 2016 – 2026 (USD Billion)
      Table 20 Global Flavors and Fragrance Market - Company Revenue Analysis, 2016 – 2019 (USD Billion)
      Table 21 Global Flavors and Fragrance Market - Company Revenue Share Analysis, 2016 – 2019 (%)
      Table 22 Acquisitions and Mergers
      Table 23 Market Drivers – Impact Analysis
      Table 24 Market Restraints
      Table 25 Market Opportunities
      Table 26 Major Buyers of Flavors and Fragrance
      Table 27 Distributors/Traders of Flavors and Fragrance by Region
      

Industry Major Market Players

  • Givaudan
  • International Flavors & Fragrances
  • Symrise AG
  • Robertet Group
  • Kerry Group plc.
  • Sensient Technologies
  • Firmenich SA
  • Takasago International Corp
  • Mane
  • Archer Daniel Midland Company
  • Solvay S.A.
  • BASF
  • Bell Flavors & Fragrances
  • T. Hasegawa