Search Market Research Report

Discover Our Latest Reports
Discover Our Featured Reports
Discover Top Selling Reports

Fenpropimorph Market Size, Share Global Analysis Report, 2023 – 2030

report img

Fenpropimorph Market Size, Share, Growth Analysis Report By Crop Type (Fruits & Vegetables, Oilseeds & Pulses, Cereals & Grains, and Others), By End-user (Agriculture, Forestry, and Others), and By Region - Global and Regional Industry Insights, Overview, Comprehensive Analysis, Trends, Statistical Research, Market Intelligence, Historical Data and Forecast 2023 – 2030

Industry Insights

[184+ Pages Report] According to the report published by Facts and Factors, the global Fenpropimorph market size was worth around USD 197 million in 2022 and is predicted to surpass around USD 269 million by 2030 with a compound annual growth rate (CAGR) of roughly 4.55% between 2023 and 2030. The report analyses the global Fenpropimorph market drivers, restraints/challenges, and the impact they have on the demands during the projection period. In addition, the report explores emerging opportunities in the Fenpropimorph market.
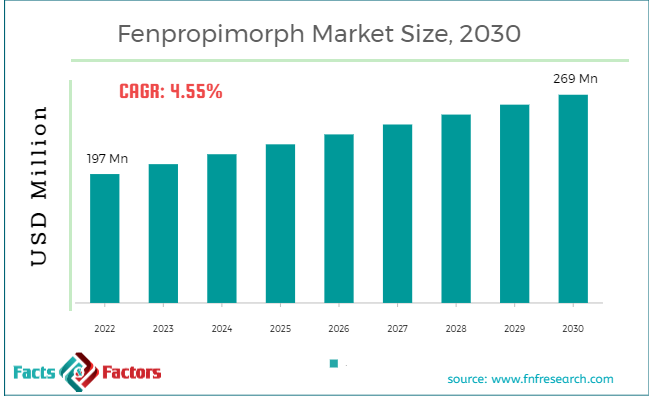
global Fenpropimorph market size

To know more about this report | Request Free Sample Copy

Our report offers a detailed analysis of the Fenpropimorph market along with extensive market forecasts. It also covers the key market and technological trends in the Fenpropimorph market. The market-oriented report further offers a complete analysis of the factors influencing the supply & demand for Fenpropimorph and the opportunities & challenges faced by major market players. The research report will prove to be an essential study for the companies or start-ups willing to capitalize on the opportunities and develop new business strategies. Our research analysts provide insights into technological developments, the whole value chain, cost analysis, etc.

Our analysts have used analytical tools to make a comprehensive analysis of the global Fenpropimorph market size which is valued in terms of USD Million. All the market stimulators, drivers, growth & development trends, and market share are clearly provided in the report. The challenges and opportunities faced by the industrial players along with the regional demand and growth trends that help the market expand are presented in the report.

The report includes SWOT analysis, Porter’s Five Forces, and PESTEL analysis to study the market. Porter’s Five Forces helped study the competitive market participants and SWOT analysis offers challenges and opportunities for the market and organization. PESTEL analysis helps provide the factors impacting the firm’s performance. Thus, these tools along with the secondary sources help identify and collect information useful for this extensive techno-commercial study.

logoReport Scope

Report Attribute

Details

Market Size in 2022

USD 197 Million

Projected Market Size in 2030

USD 269 Million

CAGR Growth Rate

4.55% CAGR

Base Year

2022

Forecast Years

2023-2030

Key Market Players

Bayer AG, BASF SE, Corteva, Inc., Syngenta AG, BioWorks Inc., Sumitomo Chemical, Nufarm Limited, Adama Agricultural Solutions, Arysta Lifescience, and DHM Agrochemicals Ltd.

Key Segment

By Crop Type, End-user, and Region

Major Regions Covered

North America, Europe, Asia Pacific, Latin America, and the Middle East & Africa

Purchase Options

Request customized purchase options to meet your research needs. Explore purchase options

Fenpropimorph is classified under systemic fungicides as they can be absorbed by the plant and spread throughout the plant body. This fungicide is known to act from inside the plant.  Fenpropimorph is majorly used in cereal crops such as barley and wheat so as to protect the crops from fungal diseases like Septoria leaf spots and yellow rust. The increasing use of fenpropimorph and other such fungicides in the plantation is expected to boost the global fenpropimorph market. The government initiatives in underdeveloped and developing countries to bring the population above the poverty line owing to the greater agricultural product demand influences market growth.

The government initiatives for creating more awareness about the appropriate usage of agricultural tools and techniques will further help enhance the market growth over the forecast period. The requirement of high yield of crops along with demand for low pathogenic attack will help the global Fenpropimorph market grow during the forecast timeline. However, the high toxicity of fenpropimorph and its effects on living beings including animals and humans has a negative impact on market growth.

In terms of crop type, the global Fenpropimorph market is segregated by Fruits & Vegetables, Oilseeds & Pulses, Cereals & Grains, and Others. By the end-users, the market is divided into Agriculture, Forestry, and Others. Based on the regions, the industry is sectored into North America, the Middle East & Africa, Latin America, Asia-Pacific, and Europe.

logoTop Market Players

Some of the key players in the global Fenpropimorph market include :

  • Bayer AG
  • BASF SE
  • Corteva Inc.
  • Syngenta AG
  • BioWorks Inc.
  • Sumitomo Chemical
  • Nufarm Limited
  • Adama Agricultural Solutions
  • Arysta Lifescience
  • DHM Agrochemicals Ltd.

The global Fenpropimorph market is segmented into:

logo By Crop Type

  • Cereals & Grains
  • Oilseeds & Pulses
  • Fruits & Vegetables
  • Others

logo By End-users

  • Agriculture
  • Forestry
  • Others

logo By Region

  • North America
    • The U.S.
    • Canada
    • Mexico
  • Europe
    • France
    • The UK
    • Spain
    • Germany
    • Italy
    • Nordic Countries
      • Denmark
      • Sweden
      • Norway
    • Benelux Union
      • Belgium
      • The Netherlands
      • Luxembourg
    • Rest of Europe
  • Asia Pacific
    • China
    • Japan
    • India
    • Australia
    • South Korea
    • Southeast Asia
      • Indonesia
      • Thailand
      • Malaysia
      • Singapore
      • Rest of Southeast Asia
    • Rest of Asia Pacific
  • The Middle East & Africa
    • Saudi Arabia
    • UAE
    • Egypt
    • South Africa
    • Rest of the Middle East & Africa
  • Latin America
    • Brazil
    • Argentina
    • Rest of Latin America


Table of Content

  1. CHAPTER 1. Executive Summary
  2. CHAPTER 2. Fenpropimorph market – Crop Type Analysis
    1. 2.1. Global Fenpropimorph Market – Crop Type Overview
    2. 2.2. Global Fenpropimorph Market Share, by Crop Type, 2023 & 2030 (USD Million)
    3. 2.3. Fruits & Vegetables
      1. 2.3.1. Global Fruits & Vegetables Fenpropimorph Market, 2020-2030 (USD Million)
    4. 2.4. Oilseeds & Pulses
      1. 2.4.1. Global Oilseeds & Pulses Fenpropimorph Market, 2020-2030 (USD Million)
    5. 2.5. Cereals & Grains
      1. 2.5.1. Global Cereals & Grains Fenpropimorph Market, 2020-2030 (USD Million)
    6. 2.6. Others
      1. 2.6.1. Global Others Fenpropimorph Market, 2020-2030 (USD Million)
  3. CHAPTER 3. Fenpropimorph market – End-user Analysis
    1. 3.1. Global Fenpropimorph Market – End-user Overview
    2. 3.2. Global Fenpropimorph Market Share, by End-user, 2023 & 2030 (USD Million)
    3. 3.3. Agriculture
      1. 3.3.1. Global Agriculture Fenpropimorph Market, 2020-2030 (USD Million)
    4. 3.4. Forestry
      1. 3.4.1. Global Forestry Fenpropimorph Market, 2020-2030 (USD Million)
    5. 3.5. Others
      1. 3.5.1. Global Others Fenpropimorph Market, 2020-2030 (USD Million)
  4. CHAPTER 4. Fenpropimorph market – Regional Analysis
    1. 4.1. Global Fenpropimorph Market Regional Overview
    2. 4.2. Global Fenpropimorph Market Share, by Region, 2023 & 2030 (Value)
    3. 4.3. North America
      1. 4.3.1. North America Fenpropimorph Market size and forecast, 2020-2030
      2. 4.3.2. North America Fenpropimorph Market, by Country, 2023 & 2030 (USD Million)
      3. 4.3.3. North America Fenpropimorph Market, by Crop Type, 2020-2030
        1. 4.3.3.1. North America Fenpropimorph Market, by Crop Type, 2020-2030 (USD Million)
      4. 4.3.4. North America Fenpropimorph Market, by End-user, 2020-2030
        1. 4.3.4.1. North America Fenpropimorph Market, by End-user, 2020-2030 (USD Million)
      5. 4.3.5. U.S.
        1. 4.3.5.1. U.S. Market size and forecast, 2020-2030 (USD Million)
      6. 4.3.6. Canada
        1. 4.3.6.1. Canada Market size and forecast, 2020-2030 (USD Million)
      7. 4.3.7. Mexico
        1. 4.3.7.1. Mexico Market size and forecast, 2020-2030 (USD Million)
    4. 4.4. Europe
      1. 4.4.1. Europe Fenpropimorph Market size and forecast, 2020-2030
      2. 4.4.2. Europe Fenpropimorph Market, by Country, 2023 & 2030 (USD Million)
      3. 4.4.3. Europe Fenpropimorph Market, by Crop Type, 2020-2030
        1. 4.4.3.1. Europe Fenpropimorph Market, by Crop Type, 2020-2030 (USD Million)
      4. 4.4.4. Europe Fenpropimorph Market, by End-user, 2020-2030
        1. 4.4.4.1. Europe Fenpropimorph Market, by End-user, 2020-2030 (USD Million)
      5. 4.4.5. Germany
        1. 4.4.5.1. Germany Market size and forecast, 2020-2030 (USD Million)
      6. 4.4.6. France
        1. 4.4.6.1. France Market size and forecast, 2020-2030 (USD Million)
      7. 4.4.7. U.K.
        1. 4.4.7.1. U.K. Market size and forecast, 2020-2030 (USD Million)
      8. 4.4.8. Italy
        1. 4.4.8.1. Italy Market size and forecast, 2020-2030 (USD Million)
      9. 4.4.9. Spain
        1. 4.4.9.1. Spain Market size and forecast, 2020-2030 (USD Million)
      10. 4.4.10. Nordic Countries
        1. 4.4.10.1. Nordic Countries Market size and forecast, 2020-2030 (USD Million)
      11. 4.4.11. Benelux Union
        1. 4.4.11.1. Benelux Union Market size and forecast, 2020-2030 (USD Million)
      12. 4.4.12. Rest of Europe
        1. 4.4.12.1. Rest of Europe Market size and forecast, 2020-2030 (USD Million)
    5. 4.5. Asia Pacific
      1. 4.5.1. Asia Pacific Fenpropimorph Market size and forecast, 2020-2030
      2. 4.5.2. Asia Pacific Fenpropimorph Market, by Country, 2023 & 2030 (USD Million)
      3. 4.5.3. Asia Pacific Fenpropimorph Market, by Crop Type, 2020-2030
        1. 4.5.3.1. Asia Pacific Fenpropimorph Market, by Crop Type, 2020-2030 (USD Million)
      4. 4.5.4. Asia Pacific Fenpropimorph Market, by End-user, 2020-2030
        1. 4.5.4.1. Asia Pacific Fenpropimorph Market, by End-user, 2020-2030 (USD Million)
      5. 4.5.5. China
        1. 4.5.5.1. China Market size and forecast, 2020-2030 (USD Million)
      6. 4.5.6. Japan
        1. 4.5.6.1. Japan Market size and forecast, 2020-2030 (USD Million)
      7. 4.5.7. India
        1. 4.5.7.1. India Market size and forecast, 2020-2030 (USD Million)
      8. 4.5.8. New Zealand
        1. 4.5.8.1. New Zealand Market size and forecast, 2020-2030 (USD Million)
      9. 4.5.9. Australia
        1. 4.5.9.1. Australia Market size and forecast, 2020-2030 (USD Million)
      10. 4.5.10. South Korea
        1. 4.5.10.1. South Korea Market size and forecast, 2020-2030 (USD Million)
      11. 4.5.11. South-East Asia
        1. 4.5.11.1. South-East Asia Market size and forecast, 2020-2030 (USD Million)
      12. 4.5.12. Rest of Asia Pacific
        1. 4.5.12.1. Rest of Asia Pacific Market size and forecast, 2020-2030 (USD Million)
    6. 4.6. Latin America
      1. 4.6.1. Latin America Fenpropimorph Market size and forecast, 2020-2030
      2. 4.6.2. Latin America Fenpropimorph Market, by Country, 2023 & 2030 (USD Million)
      3. 4.6.3. Latin America Fenpropimorph Market, by Crop Type, 2020-2030
        1. 4.6.3.1. Latin America Fenpropimorph Market, by Crop Type, 2020-2030 (USD Million)
      4. 4.6.4. Latin America Fenpropimorph Market, by End-user, 2020-2030
        1. 4.6.4.1. Latin America Fenpropimorph Market, by End-user, 2020-2030 (USD Million)
      5. 4.6.5. Brazil
        1. 4.6.5.1. Brazil Market size and forecast, 2020-2030 (USD Million)
      6. 4.6.6. Argentina
        1. 4.6.6.1. Argentina Market size and forecast, 2020-2030 (USD Million)
      7. 4.6.7. Rest of Latin America
        1. 4.6.7.1. Rest of Latin America Market size and forecast, 2020-2030 (USD Million)
    7. 4.7. The Middle-East and Africa
      1. 4.7.1. The Middle-East and Africa Fenpropimorph Market size and forecast, 2020-2030
      2. 4.7.2. The Middle-East and Africa Fenpropimorph Market, by Country, 2023 & 2030 (USD Million)
      3. 4.7.3. The Middle-East and Africa Fenpropimorph Market, by Crop Type, 2020-2030
        1. 4.7.3.1. The Middle-East and Africa Fenpropimorph Market, by Crop Type, 2020-2030 (USD Million)
      4. 4.7.4. The Middle-East and Africa Fenpropimorph Market, by End-user, 2020-2030
        1. 4.7.4.1. The Middle-East and Africa Fenpropimorph Market, by End-user, 2020-2030 (USD Million)
      5. 4.7.5. Saudi Arabia
        1. 4.7.5.1. Saudi Arabia Market size and forecast, 2020-2030 (USD Million)
      6. 4.7.6. UAE
        1. 4.7.6.1. UAE Market size and forecast, 2020-2030 (USD Million)
      7. 4.7.7. Egypt
        1. 4.7.7.1. Egypt Market size and forecast, 2020-2030 (USD Million)
      8. 4.7.8. Kuwait
        1. 4.7.8.1. Kuwait Market size and forecast, 2020-2030 (USD Million)
      9. 4.7.9. South Africa
        1. 4.7.9.1. South Africa Market size and forecast, 2020-2030 (USD Million)
      10. 4.7.10. Rest of Middle-East Africa
        1. 4.7.10.1. Rest of Middle-East Africa Market size and forecast, 2020-2030 (USD Million)
  5. CHAPTER 5. Fenpropimorph market – Competitive Landscape
    1. 5.1. Competitor Market Share – Revenue
    2. 5.2. Market Concentration Rate Analysis, Top 3 and Top 5 Players
    3. 5.3. Strategic Development
      1. 5.3.1. Acquisitions and Mergers
      2. 5.3.2. New Products
      3. 5.3.3. Research & Development Activities
  6. CHAPTER 6. Company Profiles
    1. 6.1. Bayer AG
      1. 6.1.1. Company Overview
      2. 6.1.2. Bayer AG Revenue and Gross Margin
      3. 6.1.3. Product portfolio
      4. 6.1.4. Recent initiatives
    2. 6.2. BASF SE
      1. 6.2.1. Company Overview
      2. 6.2.2. BASF SE Revenue and Gross Margin
      3. 6.2.3. Product portfolio
      4. 6.2.4. Recent initiatives
    3. 6.3. Corteva Inc.
      1. 6.3.1. Company Overview
      2. 6.3.2. Corteva Inc. Revenue and Gross Margin
      3. 6.3.3. Product portfolio
      4. 6.3.4. Recent initiatives
    4. 6.4. Syngenta AG
      1. 6.4.1. Company Overview
      2. 6.4.2. Syngenta AG Revenue and Gross Margin
      3. 6.4.3. Product portfolio
      4. 6.4.4. Recent initiatives
    5. 6.5. BioWorks Inc.
      1. 6.5.1. Company Overview
      2. 6.5.2. BioWorks Inc. Revenue and Gross Margin
      3. 6.5.3. Product portfolio
      4. 6.5.4. Recent initiatives
    6. 6.6. Sumitomo Chemical
      1. 6.6.1. Company Overview
      2. 6.6.2. Sumitomo Chemical Revenue and Gross Margin
      3. 6.6.3. Product portfolio
      4. 6.6.4. Recent initiatives
    7. 6.7. Nufarm Limited
      1. 6.7.1. Company Overview
      2. 6.7.2. Nufarm Limited Revenue and Gross Margin
      3. 6.7.3. Product portfolio
      4. 6.7.4. Recent initiatives
    8. 6.8. Adama Agricultural Solutions
      1. 6.8.1. Company Overview
      2. 6.8.2. Adama Agricultural Solutions Revenue and Gross Margin
      3. 6.8.3. Product portfolio
      4. 6.8.4. Recent initiatives
    9. 6.9. Arysta Lifescience
      1. 6.9.1. Company Overview
      2. 6.9.2. Arysta Lifescience Revenue and Gross Margin
      3. 6.9.3. Product portfolio
      4. 6.9.4. Recent initiatives
    10. 6.10. DHM Agrochemicals Ltd.
      1. 6.10.1. Company Overview
      2. 6.10.2. DHM Agrochemicals Ltd. Revenue and Gross Margin
      3. 6.10.3. Product portfolio
      4. 6.10.4. Recent initiatives
  7. CHAPTER 7. Fenpropimorph — Industry Analysis
    1. 7.1. Fenpropimorph Market – Key Trends
      1. 7.1.1. Market Drivers
      2. 7.1.2. Market Restraints
      3. 7.1.3. Market Opportunities
    2. 7.2. Value Chain Analysis
    3. 7.3. Technology Roadmap and Timeline
    4. 7.4. Fenpropimorph Market – Attractiveness Analysis
      1. 7.4.1. By Crop Type
      2. 7.4.2. By End-user
      3. 7.4.3. By Region
  8. CHAPTER 8. Marketing Strategy Analysis, Distributors
    1. 8.1. Marketing Channel
    2. 8.2. Direct Marketing
    3. 8.3. Indirect Marketing
    4. 8.4. Marketing Channel Development Trend
    5. 8.5. Economic/Political Environmental Change
  9. CHAPTER 9. Report Conclusion
  10. CHAPTER 10. Research Approach & Methodology
    1. 10.1. Report Description
    2. 10.2. Research Scope
    3. 10.3. Research Methodology
      1. 10.3.1. Secondary Research
      2. 10.3.2. Primary Research
      3. 10.3.3. Models
        1. 10.3.3.1. Company Share Analysis Model
        2. 10.3.3.2. Revenue Based Modeling
        3. 10.3.3.3. Research Limitations

        List of Figures

        FIG. 1 Global Fenpropimorph Market, 2020-2030 (USD Million)
        FIG. 2 Global Fenpropimorph Market Share, by Crop Type, 2023 & 2030 (USD Million)
        FIG. 3 Global Fruits & Vegetables Fenpropimorph Market, 2020-2030 (USD Million)
        FIG. 4 Global Oilseeds & Pulses Fenpropimorph Market, 2020-2030 (USD Million)
        FIG. 5 Global Cereals & Grains Fenpropimorph Market, 2020-2030 (USD Million)
        FIG. 6 Global Others Fenpropimorph Market, 2020-2030 (USD Million)
        FIG. 7 Global Fenpropimorph Market Share, by End-user, 2023 & 2030 (USD Million)
        FIG. 8 Global Agriculture Fenpropimorph Market, 2020-2030 (USD Million)
        FIG. 9 Global Forestry Fenpropimorph Market, 2020-2030 (USD Million)
        FIG. 10 Global Others Fenpropimorph Market, 2020-2030 (USD Million)
        FIG. 11 Global Fenpropimorph Market Share, by Region, 2023 & 2030
        FIG. 12 North America Fenpropimorph Market, 2020-2030
        FIG. 13 U.S. Fenpropimorph Market, 2020-2030
        FIG. 14 Canada Fenpropimorph Market, 2020-2030
        FIG. 15 Mexico Fenpropimorph Market, 2020-2030
        FIG. 16 Europe Fenpropimorph Market, 2020-2030
        FIG. 17 Germany Fenpropimorph Market, 2020-2030
        FIG. 18 France Fenpropimorph Market, 2020-2030
        FIG. 19 U.K. Fenpropimorph Market, 2020-2030
        FIG. 20 Italy Fenpropimorph Market, 2020-2030
        FIG. 21 Spain Fenpropimorph Market, 2020-2030
        FIG. 22 Nordic Countries Fenpropimorph Market, 2020-2030
        FIG. 23 Benelux Union Fenpropimorph Market, 2020-2030
        FIG. 24 Rest of Europe Fenpropimorph Market, 2020-2030
        FIG. 25 Asia Pacific Fenpropimorph Market, 2020-2030
        FIG. 26 China Fenpropimorph Market, 2020-2030
        FIG. 27 Japan Fenpropimorph Market, 2020-2030
        FIG. 28 India Fenpropimorph Market, 2020-2030
        FIG. 29 New Zealand Fenpropimorph Market, 2020-2030
        FIG. 30 Australia Fenpropimorph Market, 2020-2030
        FIG. 31 South  Korea Fenpropimorph Market, 2020-2030
        FIG. 32 South-East Asia Fenpropimorph Market, 2020-2030
        FIG. 33 Rest of Asia Pacific Fenpropimorph Market, 2020-2030
        FIG. 34 Latin America Fenpropimorph Market, 2020-2030
        FIG. 35 Brazil Fenpropimorph Market, 2020-2030
        FIG. 36 Argentina Fenpropimorph Market, 2020-2030
        FIG. 37 Rest of Latin America Fenpropimorph Market, 2020-2030
        FIG. 38 The Middle-East and Africa Fenpropimorph Market, 2020-2030
        FIG. 39 Saudi Arabia Fenpropimorph Market, 2020-2030
        FIG. 40 UAE Fenpropimorph Market, 2020-2030
        FIG. 41 Egypt Fenpropimorph Market, 2020-2030
        FIG. 42 Kuwait Fenpropimorph Market, 2020-2030
        FIG. 43 South Africa Fenpropimorph Market, 2020-2030
        FIG. 44 Rest of Middle-East Africa Fenpropimorph Market, 2020-2030
        FIG. 45 Competitor Market Share – Revenue
        FIG. 46 Bayer AG Revenue and Growth Rate
        FIG. 47 Bayer AG Market Share
        FIG. 48 BASF SE Revenue and Growth Rate
        FIG. 49 BASF SE Market Share
        FIG. 50 Corteva Inc. Revenue and Growth Rate
        FIG. 51 Corteva Inc. Market Share
        FIG. 52 Syngenta AG Revenue and Growth Rate
        FIG. 53 Syngenta AG Market Share
        FIG. 54 BioWorks Inc. Revenue and Growth Rate
        FIG. 55 BioWorks Inc. Market Share
        FIG. 56 Sumitomo Chemical Revenue and Growth Rate
        FIG. 57 Sumitomo Chemical Market Share
        FIG. 58 Nufarm Limited Revenue and Growth Rate
        FIG. 59 Nufarm Limited Market Share
        FIG. 60 Adama Agricultural Solutions Revenue and Growth Rate 
        FIG. 61 Adama Agricultural Solutions Market Share 
        FIG. 62 Arysta Lifescience Revenue and Growth Rate 
        FIG. 63 Arysta Lifescience Market Share 
        FIG. 64 DHM Agrochemicals Ltd. Revenue and Growth Rate 
        FIG. 65 DHM Agrochemicals Ltd. Market Share 
        FIG. 66 Market Dynamics 
        FIG. 67 Global Fenpropimorph – Value Chain Analysis 
        FIG. 68 Technology Roadmap and Timeline 
        FIG. 69 Market Attractiveness Analysis – By Crop Type 
        FIG. 70 Market Attractiveness Analysis – By End-user 
        FIG. 71 Market Attractiveness Analysis – By Region 
        FIG. 72 Market Channel 
        FIG. 73 Marketing Channel Development Trend 
        FIG. 74 Growth in World Gross Product, 2008-2018 


        List of Tables

        TABLE 1 Global Fenpropimorph Market, 2023 & 2030 (USD Million)
        TABLE 2 Global Fenpropimorph market, by Crop Type, 2020-2030 (USD Million)
        TABLE 3 Global Fenpropimorph market, by End-user, 2020-2030 (USD Million)
        TABLE 4 Global Fenpropimorph market, by Region, 2020-2030 (USD Million)
        TABLE 5 North America Fenpropimorph Market, by Crop Type, 2020-2030 (USD Million)
        TABLE 6 North America Fenpropimorph Market, by End-user, 2020-2030 (USD Million)
        TABLE 7 Europe Fenpropimorph Market, by Crop Type, 2020-2030 (USD Million)
        TABLE 8 Europe Fenpropimorph Market, by End-user, 2020-2030 (USD Million)
        TABLE 9 Asia Pacific Fenpropimorph Market, by Crop Type, 2020-2030 (USD Million)
        TABLE 10 Asia Pacific Fenpropimorph Market, by End-user, 2020-2030 (USD Million)
        TABLE 11 Latin America Fenpropimorph Market, by Crop Type, 2020-2030 (USD Million)
        TABLE 12 Latin America Fenpropimorph Market, by End-user, 2020-2030 (USD Million)
        TABLE 13 The Middle-East and Africa Fenpropimorph Market, by Crop Type, 2020-2030 (USD Million)
        TABLE 14 The Middle-East and Africa Fenpropimorph Market, by End-user, 2020-2030 (USD Million)
        TABLE 15 Global Fenpropimorph Market - Company Revenue Analysis 2020-2022 (USD Million)
        TABLE 16 Global Fenpropimorph Market - Company Revenue Share Analysis 2020-2022(%)
        TABLE 17 Acquisitions and Mergers
        TABLE 18 New Product/Service Launch
        TABLE 19 Research & Development Activities
        TABLE 20 Market Drivers 
        TABLE 21 Market Restraints 
        TABLE 22 Market Opportunities 
         

Industry Major Market Players

  • Bayer AG
  • BASF SE
  • Corteva Inc.
  • Syngenta AG
  • BioWorks Inc.
  • Sumitomo Chemical
  • Nufarm Limited
  • Adama Agricultural Solutions
  • Arysta Lifescience
  • DHM Agrochemicals Ltd.