![]()
Search Market Research Report
Essential Oils Market Size, Share Global Analysis Report, 2020–2026

Essential Oils Market By Product (Orange, Eucalyptus, Cornmint, Peppermint, Citronella, Lemon, Lime, Clove, Spearmint, and Others), By Application (Cleaning and Home, Medical, Food and Beverages, Spa and Relaxation, and Others), and By Region: Global Industry Outlook, Market Size, Business Intelligence, Consumer Preferences, Statistical Surveys, Comprehensive Analysis, Historical Developments, Current Trends, and Forecast 2020–2026
Industry Insights
This specialized and expertise oriented industry research report scrutinizes the technical and commercial business outlook of the Essential Oils industry. The report analyzes and declares the historical and current trends analysis of the Essential Oils industry and subsequently recommends the projected trends anticipated to be observed in the global Essential Oils market during the upcoming years.
The Essential Oils market report analyzes and notifies the industry statistics at the global as well as regional and country levels in order to acquire a thorough perspective of the entire Essential Oils market. The historical and past insights are provided for FY 2016 to FY 2019 whereas projected trends are delivered for FY 2020 to FY 2026. The quantitative and numerical data is represented in terms of both volume (Kilotons) and value (USD Billion) from FY 2016 – 2026.
The quantitative data is further underlined and reinforced by comprehensive qualitative data which comprises various across-the-board market dynamics. The rationales which directly or indirectly impact the Essential Oils industry are exemplified through parameters such as growth drivers, restraints, challenges, and opportunities among other impacting factors.
Throughout our research report, we have encompassed all the proven models and tools of industry analysis and extensively illustrated all the key business strategies and business models adopted in the Essential Oils industry. The report provides an all-inclusive and detailed competitive landscape prevalent in the global Essential Oils market.
The report utilizes established industry analysis tools and models such as Porter’s Five Forces framework to analyze and recognize critical business strategies adopted by various stakeholders involved in the entire value chain of the Essential Oils industry. The global Essential Oils market report additionally employs SWOT analysis and PESTLE analysis models for further in-depth analysis.
The report study further includes an in-depth analysis of industry players' market shares and provides an overview of leading players' market position in the Essential Oils sector. Key strategic developments in the global Essential Oils market competitive landscape such as acquisitions & mergers, inaugurations of different products and services, partnerships & joint ventures, MoU agreements, VC & funding activities, R&D activities, and geographic expansion among other noteworthy activities by key players of the global Essential Oils market are appropriately highlighted in the report.
The essential oils are liquids extracted from the stems, leaves, seeds, roots, or flowers of the specific plant. Some of the common essential oil sources include tea tree, lavender, orange, lemon, peppermint, and others. The essential oils are considered to possess antibacterial, antifungal, antiviral, and antimicrobial properties. Furthermore, the ability of essential oils to by-pass the digestive system has increased its use in improving digestion. It is also used in infants to help swallow capsules or tablets and also for improving the oxygenation in some individuals.
The growth of the Essential Oils market is basically due to the rising utilization of essential oils in myriad applications such as aromatherapies, flavor & fragrance, etc. Additionally, the healing properties of essential oils are likely to further help propel the growth of the global Essential Oils market during the forecast period. The growing acceptance of essential oils in the commercial, residential, and industrial application helps expand the market. The surging demand for natural preservatives is anticipated to increase the sales of essential oils, as well as provide new opportunities, during the forecast period. However, the high costs of essential oils are one of the key factors predicted to hamper the Essential Oils market.
The global Essential Oils market research report delivers an acute valuation and taxonomy of the Essential Oils industry by practically splitting the market on the basis of different products, applications, and regions. Through the analysis of the historical and projected trends, all the segments and sub-segments were evaluated through the bottom-up approach, and different market sizes have been projected for FY 2020 to FY 2026.
 Report Scope
Report Attribute |
Details |
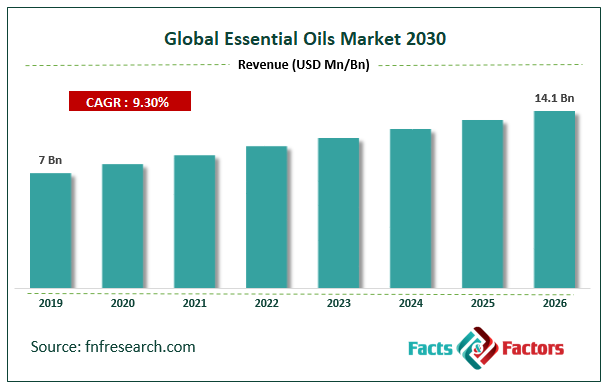
Market Size in 2019 |
USD 7 Billion |
Projected Market Size in 2026/td> |
USD 14.1 Billion |
CAGR Growth Rate |
9.3% CAGR |
Base Year |
2019 |
Forecast Years |
2020-2026 |
Key Market Players |
H.Reynaude & Fils, Sydney Essential Oils Co. Pty Ltd., Biolandes, Farotti SRL, The Lebermuth Company, Moksha Lifestyle Products, Young Living Essential Oils, doTERRA International, West India Species, Inc., and Essential Oils of New Zealand., and Others |
Key Segment |
By Product, Application, and Region |
Major Regions Covered |
North America, Europe, Asia Pacific, Latin America, and the Middle East & Africa |
Purchase Options |
Request customized purchase options to meet your research needs.Explore purchase options |
The regional segmentation of the Essential Oils industry includes the complete classification of all the major continents including North America, Latin America, Europe, Asia Pacific, and Middle East & Africa. Further, country-wise data for the Essential Oils industry is provided for the leading economies of the world.
The global Essential Oils market is segmented based on Product and Application. By product, the global Essential Oils market is sectored into Orange, Eucalyptus, Cornmint, Peppermint, Citronella, Lemon, Lime, Clove, Spearmint, and Others. On the basis of application, the market is segregated into Cleaning and Home, Medical, Food and Beverages, Spa and Relaxation, and Others.
Some of the essential players operating in the global Essential Oils market, but not restricted to include
- H.Reynaude & Fils
- Sydney Essential Oils Co. Pty Ltd.
- Biolandes
- Farotti SRL
- The Lebermuth Company
- Moksha Lifestyle Products
- Young Living Essential Oils
- doTERRA International
- West India Species Inc.
- Essential Oils of New Zealand.
The taxonomy of the Essential Oils Market by its scope and segmentation is as follows:
Product Segmentation Analysis
- Orange
- Eucalyptus
- Cornmint
- Peppermint
- Citronella
- Lemon
- Lime
- Clove
- Spearmint
- Others
Application Segmentation Analysis
- Food and Beverages
- Medical
- Cleaning and Home
- Spa and Relaxation
- Others
Regional Segmentation Analysis
- North America
- The U.S.
- Canada
- Europe
- Germany
- The UK
- France
- Spain
- Italy
- Rest of Europe
- Asia Pacific
- China
- Japan
- India
- South Korea
- Southeast Asia
- Rest of Asia Pacific
- Latin America
- Brazil
- Mexico
- Rest of Latin America
- Middle East & Africa
- GCC
- South Africa
- Rest of Middle East & Africa
Table of Content
Industry Major Market Players
- H.Reynaude & Fils
- Sydney Essential Oils Co. Pty Ltd.
- Biolandes
- Farotti SRL
- The Lebermuth Company
- Moksha Lifestyle Products
- Young Living Essential Oils
- doTERRA International
- West India Species Inc.
- Essential Oils of New Zealand.


Copyright © 2025 - 2026, All Rights Reserved, Facts and Factors