Search Market Research Report

Discover Our Latest Reports
Discover Our Featured Reports
Discover Top Selling Reports

[Latest] Global Electric Bus Market Size & Share Analysis Forecast 2020-2026

report img

Electric Bus Market By Bus Type (Less than 9m, 9-14m, and Above 14m), By Battery Capacity (Less than 50kWh, 50–250kWh, and Above 250kWh), By Range (Less than 150 miles, 150–300 miles, and Above 300 miles), By Propulsion Type (PHEV, BEV, and FCEV), By Component (Battery, Motor, Ultra-Capacitor, and Fuel Cell Stack), By Consumer Segment (Fleet Operator and Government), By Application (Intercity and Intracity), And By Region: Global Industry Outlook, Market Size, Business Intelligence, Consumer Preferences, Statistical Surveys, Comprehensive Analysis, Historical Developments, Current Trends, and Forecast 2020–2026

Industry Insights

[220+ Page Report] According to the report published by Facts & Factors, the global electric bus market size was worth 135 thousand units in 2019 and is predicted to reach 600 thousand units by the end of 2026. The market is expected to grow with a CAGR of 25% during the forecast period. The report analyzes the global electric bus market’s growth drivers, restraints, and impact on demand during the forecast period. It will also help navigate and explore the arising opportunities in the electric bus industry.

This specialized and expertise-oriented industry research report scrutinizes the technical and commercial business outlook of the global electric bus industry. The report analyzes and declares the historical and current trends analysis of the global electric bus industry and subsequently recommends the projected trends anticipated to be observed in the global electric bus market during the upcoming years.

To know more about this report | Request Free Sample Copy

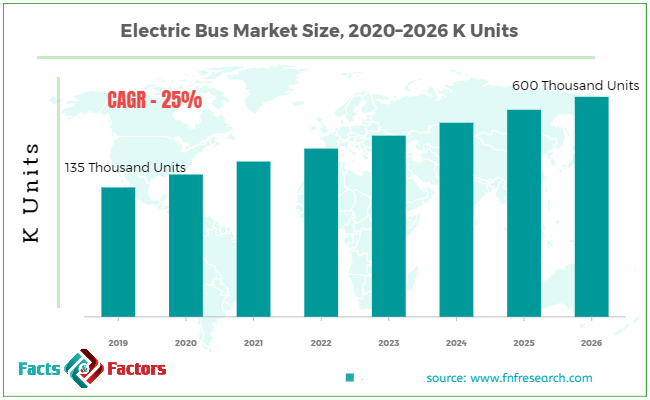
The global electric bus market report analyzes and notifies the industry statistics at the global as well as regional and country levels in order to acquire a thorough perspective of the entire global electric bus market. The historical and past insights are provided for FY 2016 to FY 2019 whereas projected trends are delivered for FY 2020 to FY 2026. The quantitative and numerical data is represented in terms of volume (K Units) from FY 2016 – 2026.

The quantitative data is further underlined and reinforced by comprehensive qualitative data which comprises various across-the-board market dynamics. The rationales which directly or indirectly impact the global electric bus industry are exemplified through parameters such as growth drivers, restraints, challenges, and opportunities among other impacting factors.

Throughout our research report, we have encompassed all the proven models and tools of industry analysis and extensively illustrated all the key business strategies and business models adopted in the global electric bus industry. The report provides an all-inclusive and detailed competitive landscape prevalent in the global electric bus market.

The report utilizes established industry analysis tools and models such as Porter’s Five Forces framework to analyze and recognize critical business strategies adopted by various stakeholders involved in the entire value chain of the global electric bus industry. The global electric bus market report additionally employs SWOT analysis and PESTLE analysis models for further in-depth analysis.

The report further includes an in-depth analysis of industry players' market shares and provides an overview of leading players' market position in the global electric bus sector. Key strategic developments in the global electric bus market competitive landscape such as acquisitions & mergers, inaugurations of different products and services, partnerships & joint ventures, MoU agreements, VC & funding activities, R&D activities, and geographic expansion among other noteworthy activities by key players of the global electric bus market are appropriately highlighted in the report.

Gasoline-based vehicles are the leading cause of air pollution worldwide. The increasing carbon and other hazardous gases emission due to fuel combustion have been leveling up the global warming effect. Several government agencies and policymakers are seeking to launch low and zero-emission vehicles to combat such a situation. Although natural gas-based public transport system is succeeded to some extent in controlling the swiftly rising air pollution, electric buses are gaining prominence to eradicate this global concern owing to their zero-emission characteristic. Thus, the demand for electric buses in different regions across the globe is flourishing substantially and propelling the global electric bus market.

Besides, the major amount of the globally extracted crude oil is consumed by public transportation systems in several regions. All the countries are focused to slash the import and consumption rate of oil. Thus, the adoption of electric vehicles is an effective alternative for this condition. However, electric buses are quite expensive compared to gasoline-based vehicles, which is likely to hamper the global electric bus market.

logoReport Scope

Report Attribute

Details

Market Size in 2019

 135 Thousand Units

Projected Market Size in 2026

 600 Thousand Units

CAGR Growth Rate

25% CAGR

Base Year

2019

Forecast Years

2020-2026

Key Market Players

Daimler AG, Solaris Bus & Coach S.A., New Flyer Industries Inc., Proterra Inc., EBUSCO, Zhengzhou Yutong Group Co. Ltd., AB Volvo, and BYD Company Limited, among others.

Key Segment

By Bus Type, Battery Capacity, Range, Propulsion Type, Component, Consumer Segment, Application, and Region

Major Regions Covered

North America, Europe, Asia Pacific, Latin America, and the Middle East & Africa

Purchase Options

Request customized purchase options to meet your research needs. Explore purchase options

The global electric bus market research report delivers an acute valuation and taxonomy of the global electric bus industry by practically splitting the market on the basis of bus type, battery capacity, range, propulsion type, component, consumer segment, application, and regions. Through the analysis of the historical and projected trends, all the segments and sub-segments were evaluated through the bottom-up approach, and different market sizes have been projected for FY 2020 to FY 2026. The regional segmentation of the global electric bus industry includes the complete classification of all the major continents including North America, Latin America, Europe, Asia Pacific, and Middle East & Africa. Further, country-wise data for the global electric bus industry is provided for the leading economies of the world.

The global electric bus market is segmented based on the bus type, battery capacity, range, propulsion type, component, consumer segment, application, and region. On the basis of the bus type, the global electric bus market is bifurcated into less than 9 m, 9−14 m, and above 14 m. By battery capacity, the global industry is categorized into less than 50 kWh, 50–250 kWh, and above 250 kWh. The range segment divides the global market into less than 150 miles, 150–300 miles, and above 300 miles. Based on the propulsion type, the global market is classified into PHEV, BEV, and FCEV. Component-wise, the industry is sectored into the battery, motor, ultra-capacitor, and fuel cell stack. Based on the consumer segment, the market is fragmented into fleet operators and government. Application-wise, the market is fragmented into intercity and intracity.

logoSome of the essential players operating in the global electric bus market, but not restricted to include

  •  Daimler AG
  •  Solaris Bus & Coach S.A.
  •  New Flyer Industries Inc.
  •  Proterra Inc.
  •  EBUSCO
  •  Zhengzhou Yutong Group Co. Ltd.
  •  AB Volvo
  •  BYD Company Limited

The taxonomy of the global electric bus industry by its scope and segmentation is as follows:

logoBus Type Segmentation Analysis

  • Less than 9 m
  • 9−14 m
  • Above 14 m

logoBattery Capacity Segmentation Analysis

  • Less than 50 kWh
  • 50–250 kWh
  • Above 250 kWh

logoRange Segmentation Analysis

  • Less than 150 miles
  • 150–300 miles
  • Above 300 miles

logoPropulsion Type Segmentation Analysis

  • PHEV
  • BEV
  • FCEV

logoComponent Segmentation Analysis

  • Battery
  • Motor
  • Ultra-capacitor
  • Fuel Cell Stack

logoConsumer Segment Segmentation Analysis

  • Fleet Operator
  • Government

logoApplication Segmentation Analysis

  • Intercity
  • Intracity

logoRegional Segmentation Analysis

  • North America
    • The U.S.
    • Canada
  • Europe
    • Germany
    • The UK
    • France
    • Spain
    • Italy
    • Rest of Europe
  • Asia Pacific
    • China
    • Japan
    • India
    • South Korea
    • Southeast Asia
    • Rest of Asia Pacific
  • Latin America
    • Brazil
    • Mexico
    • Rest of Latin America
  • Middle East & Africa
    • GCC
    • South Africa
    • Rest of Middle East & Africa

Table of Content

  1. CHAPTER 1. Executive Summary
  2. CHAPTER 2. Electric Bus market – Bus Type Analysis
    1. 2.1. Global Electric Bus Market – Bus Type Overview
    2. 2.2. Global Electric Bus Market Share, by Bus Type, 2018 & 2025 (USD Billion)
    3. 2.3. Global Electric Bus Market share, by Bus Type, 2018 & 2025 (K Units)
    4. 2.4. Less than 9m
      1. 2.4.1. Global Less than 9m Electric Bus Market, 2016-2026 (USD Billion)
      2. 2.4.2. Global Less than 9m Electric Bus Market, 2016-2026 (K Units)
    5. 2.5. 9-14m
      1. 2.5.1. Global 9-14m Electric Bus Market, 2016-2026 (USD Billion)
      2. 2.5.2. Global 9-14m Electric Bus Market, 2016-2026 (K Units)
    6. 2.6. Above 14m
      1. 2.6.1. Global Above 14m Electric Bus Market, 2016-2026 (USD Billion)
      2. 2.6.2. Global Above 14m Electric Bus Market, 2016-2026 (K Units)
  3. CHAPTER 3. Electric Bus market – Battery Capacity Analysis
    1. 3.1. Global Electric Bus Market – Battery Capacity Overview
    2. 3.2. Global Electric Bus Market Share, by Battery Capacity, 2018 & 2025 (USD Billion)
    3. 3.3. Global Electric Bus Market share, by Battery Capacity, 2018 & 2025 (K Units)
    4. 3.4. Less than 50kWh
      1. 3.4.1. Global Less than 50kWh Electric Bus Market, 2016-2026 (USD Billion)
      2. 3.4.2. Global Less than 50kWh Electric Bus Market, 2016-2026 (K Units)
    5. 3.5. 50–250kWh
      1. 3.5.1. Global 50–250kWh Electric Bus Market, 2016-2026 (USD Billion)
      2. 3.5.2. Global 50–250kWh Electric Bus Market, 2016-2026 (K Units)
    6. 3.6. Above 250kWh
      1. 3.6.1. Global Above 250kWh Electric Bus Market, 2016-2026 (USD Billion)
      2. 3.6.2. Global Above 250kWh Electric Bus Market, 2016-2026 (K Units)
  4. CHAPTER 4. Electric Bus market – Range Analysis
    1. 4.1. Global Electric Bus Market – Range Overview
    2. 4.2. Global Electric Bus Market Share, by Range, 2018 & 2025 (USD Billion)
    3. 4.3. Global Electric Bus Market share, by Range, 2018 & 2025 (K Units)
    4. 4.4. Less than 150 miles
      1. 4.4.1. Global Less than 150 miles Electric Bus Market, 2016-2026 (USD Billion)
      2. 4.4.2. Global Less than 150 miles Electric Bus Market, 2016-2026 (K Units)
    5. 4.5. 150–300 miles
      1. 4.5.1. Global 150–300 miles Electric Bus Market, 2016-2026 (USD Billion)
      2. 4.5.2. Global 150–300 miles Electric Bus Market, 2016-2026 (K Units)
    6. 4.6. Above 300 miles
      1. 4.6.1. Global Above 300 miles Electric Bus Market, 2016-2026 (USD Billion)
      2. 4.6.2. Global Above 300 miles Electric Bus Market, 2016-2026 (K Units)
  5. CHAPTER 5. Electric Bus market – Propulsion Type Analysis
    1. 5.1. Global Electric Bus Market – Propulsion Type Overview
    2. 5.2. Global Electric Bus Market Share, by Propulsion Type, 2018 & 2025 (USD Billion)
    3. 5.3. Global Electric Bus Market share, by Propulsion Type, 2018 & 2025 (K Units)
    4. 5.4. PHEV
      1. 5.4.1. Global PHEV Electric Bus Market, 2016-2026 (USD Billion)
      2. 5.4.2. Global PHEV Electric Bus Market, 2016-2026 (K Units)
    5. 5.5. BEV
      1. 5.5.1. Global BEV Electric Bus Market, 2016-2026 (USD Billion)
      2. 5.5.2. Global BEV Electric Bus Market, 2016-2026 (K Units)
    6. 5.6. FCEV
      1. 5.6.1. Global FCEV Electric Bus Market, 2016-2026 (USD Billion)
      2. 5.6.2. Global FCEV Electric Bus Market, 2016-2026 (K Units)
  6. CHAPTER 6. Electric Bus market – Component Analysis
    1. 6.1. Global Electric Bus Market – Component Overview
    2. 6.2. Global Electric Bus Market Share, by Component, 2018 & 2025 (USD Billion)
    3. 6.3. Global Electric Bus Market share, by Component, 2018 & 2025 (K Units)
    4. 6.4. Battery
      1. 6.4.1. Global Battery Electric Bus Market, 2016-2026 (USD Billion)
      2. 6.4.2. Global Battery Electric Bus Market, 2016-2026 (K Units)
    5. 6.5. Motor
      1. 6.5.1. Global Motor Electric Bus Market, 2016-2026 (USD Billion)
      2. 6.5.2. Global Motor Electric Bus Market, 2016-2026 (K Units)
    6. 6.6. Ultra-Capacitor
      1. 6.6.1. Global Ultra-Capacitor Electric Bus Market, 2016-2026 (USD Billion)
      2. 6.6.2. Global Ultra-Capacitor Electric Bus Market, 2016-2026 (K Units)
    7. 6.7. Fuel Cell Stack
      1. 6.7.1. Global Fuel Cell Stack Electric Bus Market, 2016-2026 (USD Billion)
      2. 6.7.2. Global Fuel Cell Stack Electric Bus Market, 2016-2026 (K Units)
  7. CHAPTER 7. Electric Bus market – Consumer Segment Analysis
    1. 7.1. Global Electric Bus Market – Consumer Segment Overview
    2. 7.2. Global Electric Bus Market Share, by Consumer Segment, 2018 & 2025 (USD Billion)
    3. 7.3. Global Electric Bus Market share, by Consumer Segment, 2018 & 2025 (K Units)
    4. 7.4. Fleet Operator
      1. 7.4.1. Global Fleet Operator Electric Bus Market, 2016-2026 (USD Billion)
      2. 7.4.2. Global Fleet Operator Electric Bus Market, 2016-2026 (K Units)
    5. 7.5. Government
      1. 7.5.1. Global Government Electric Bus Market, 2016-2026 (USD Billion)
      2. 7.5.2. Global Government Electric Bus Market, 2016-2026 (K Units)
  8. CHAPTER 8. Electric Bus market – Application Analysis
    1. 8.1. Global Electric Bus Market – Application Overview
    2. 8.2. Global Electric Bus Market Share, by Application, 2018 & 2025 (USD Billion)
    3. 8.3. Global Electric Bus Market share, by Application, 2018 & 2025 (K Units)
    4. 8.4. Intercity
      1. 8.4.1. Global Intercity Electric Bus Market, 2016-2026 (USD Billion)
      2. 8.4.2. Global Intercity Electric Bus Market, 2016-2026 (K Units)
    5. 8.5. Intracity
      1. 8.5.1. Global Intracity Electric Bus Market, 2016-2026 (USD Billion)
      2. 8.5.2. Global Intracity Electric Bus Market, 2016-2026 (K Units)
  9. CHAPTER 9. Electric Bus market – Regional Analysis
    1. 9.1. Global Electric Bus Market Regional Overview
    2. 9.2. Global Electric Bus Market Share, by Region, 2018 & 2025 (Value)
    3. 9.3. Global Electric Bus Market Share, by Region, 2018 & 2025 (Volume)
    4. 9.4. North America
      1. 9.4.1. North America Electric Bus Market size and forecast, 2016-2026
      2. 9.4.2. North America Electric Bus Market, by Country, 2018 - 2025 (USD Billion)
      3. 9.4.3. North America Market size and forecast, 2016-2026 (K Units)
      4. 9.4.4. North America Electric Bus Market, by Country, 2018 - 2025 (K Units)
      5. 9.4.5. North America Electric Bus Market, by Bus Type, 2016-2026
        1. 9.4.5.1. North America Electric Bus Market, by Bus Type, 2016-2026 (USD Billion)
        2. 9.4.5.2. North America Electric Bus Market, by Bus Type, 2016-2026 (K Units)
      6. 9.4.6. North America Electric Bus Market, by Battery Capacity, 2016-2026
        1. 9.4.6.1. North America Electric Bus Market, by Battery Capacity, 2016-2026 (USD Billion)
        2. 9.4.6.2. North America Electric Bus Market, by Battery Capacity, 2016-2026 (K Units)
      7. 9.4.7. North America Electric Bus Market, by Range, 2016-2026
        1. 9.4.7.1. North America Electric Bus Market, by Range, 2016-2026 (USD Billion)
        2. 9.4.7.2. North America Electric Bus Market, by Range, 2016-2026 (K Units)
      8. 9.4.8. North America Electric Bus Market, by Propulsion Type, 2016-2026
        1. 9.4.8.1. North America Electric Bus Market, by Propulsion Type, 2016-2026 (USD Billion)
        2. 9.4.8.2. North America Electric Bus Market, by Propulsion Type, 2016-2026 (K Units)
      9. 9.4.9. North America Electric Bus Market, by Component, 2016-2026
        1. 9.4.9.1. North America Electric Bus Market, by Component, 2016-2026 (USD Billion)
        2. 9.4.9.2. North America Electric Bus Market, by Component, 2016-2026 (K Units)
      10. 9.4.10. North America Electric Bus Market, by Consumer Segment, 2016-2026
        1. 9.4.10.1. North America Electric Bus Market, by Consumer Segment, 2016-2026 (USD Billion)
        2. 9.4.10.2. North America Electric Bus Market, by Consumer Segment, 2016-2026 (K Units)
      11. 9.4.11. North America Electric Bus Market, by Application, 2016-2026
        1. 9.4.11.1. North America Electric Bus Market, by Application, 2016-2026 (USD Billion)
        2. 9.4.11.2. North America Electric Bus Market, by Application, 2016-2026 (K Units)
      12. 9.4.12. U.S.
        1. 9.4.12.1. U.S. Market size and forecast, 2016-2026 (USD Billion)
        2. 9.4.12.2. U.S. Market size and forecast, 2016-2026 (K Units)
      13. 9.4.13. Canada
        1. 9.4.13.1. Canada Market size and forecast, 2016-2026 (USD Billion)
        2. 9.4.13.2. Canada Market size and forecast, 2016-2026 (K Units)
    5. 9.5. Europe
      1. 9.5.1. Europe Electric Bus Market size and forecast, 2016-2026
      2. 9.5.2. Europe Electric Bus Market, by Country, 2018 - 2025 (USD Billion)
      3. 9.5.3. Europe Market size and forecast, 2016-2026 (K Units)
      4. 9.5.4. Europe Electric Bus Market, by Country, 2018 - 2025 (K Units)
      5. 9.5.5. Europe Electric Bus Market, by Bus Type, 2016-2026
        1. 9.5.5.1. Europe Electric Bus Market, by Bus Type, 2016-2026 (USD Billion)
        2. 9.5.5.2. Europe Electric Bus Market, by Bus Type, 2016-2026 (K Units)
      6. 9.5.6. Europe Electric Bus Market, by Battery Capacity, 2016-2026
        1. 9.5.6.1. Europe Electric Bus Market, by Battery Capacity, 2016-2026 (USD Billion)
        2. 9.5.6.2. Europe Electric Bus Market, by Battery Capacity, 2016-2026 (K Units)
      7. 9.5.7. Europe Electric Bus Market, by Range, 2016-2026
        1. 9.5.7.1. Europe Electric Bus Market, by Range, 2016-2026 (USD Billion)
        2. 9.5.7.2. Europe Electric Bus Market, by Range, 2016-2026 (K Units)
      8. 9.5.8. Europe Electric Bus Market, by Propulsion Type, 2016-2026
        1. 9.5.8.1. Europe Electric Bus Market, by Propulsion Type, 2016-2026 (USD Billion)
        2. 9.5.8.2. Europe Electric Bus Market, by Propulsion Type, 2016-2026 (K Units)
      9. 9.5.9. Europe Electric Bus Market, by Component, 2016-2026
        1. 9.5.9.1. Europe Electric Bus Market, by Component, 2016-2026 (USD Billion)
        2. 9.5.9.2. Europe Electric Bus Market, by Component, 2016-2026 (K Units)
      10. 9.5.10. Europe Electric Bus Market, by Consumer Segment, 2016-2026
        1. 9.5.10.1. Europe Electric Bus Market, by Consumer Segment, 2016-2026 (USD Billion)
        2. 9.5.10.2. Europe Electric Bus Market, by Consumer Segment, 2016-2026 (K Units)
      11. 9.5.11. Europe Electric Bus Market, by Application, 2016-2026
        1. 9.5.11.1. Europe Electric Bus Market, by Application, 2016-2026 (USD Billion)
        2. 9.5.11.2. Europe Electric Bus Market, by Application, 2016-2026 (K Units)
      12. 9.5.12. Germany
        1. 9.5.12.1. Germany Market size and forecast, 2016-2026 (USD Billion)
        2. 9.5.12.2. Germany Market size and forecast, 2016-2026 (K Units)
      13. 9.5.13. France
        1. 9.5.13.1. France Market size and forecast, 2016-2026 (USD Billion)
        2. 9.5.13.2. France Market size and forecast, 2016-2026 (K Units)
      14. 9.5.14. U.K.
        1. 9.5.14.1. U.K. Market size and forecast, 2016-2026 (USD Billion)
        2. 9.5.14.2. U.K. Market size and forecast, 2016-2026 (K Units)
      15. 9.5.15. Italy
        1. 9.5.15.1. Italy Market size and forecast, 2016-2026 (USD Billion)
        2. 9.5.15.2. Italy Market size and forecast, 2016-2026 (K Units)
      16. 9.5.16. Spain
        1. 9.5.16.1. Spain Market size and forecast, 2016-2026 (USD Billion)
        2. 9.5.16.2. Spain Market size and forecast, 2016-2026 (K Units)
      17. 9.5.17. Rest of Europe
        1. 9.5.17.1. Rest of Europe Market size and forecast, 2016-2026 (USD Billion)
        2. 9.5.17.2. Rest of Europe Market size and forecast, 2016-2026 (K Units)
    6. 9.6. Asia Pacific
      1. 9.6.1. Asia Pacific Electric Bus Market size and forecast, 2016-2026
      2. 9.6.2. Asia Pacific Electric Bus Market, by Country, 2018 - 2025 (USD Billion)
      3. 9.6.3. Asia Pacific Market size and forecast, 2016-2026 (K Units)
      4. 9.6.4. Asia Pacific Electric Bus Market, by Country, 2018 - 2025 (K Units)
      5. 9.6.5. Asia Pacific Electric Bus Market, by Bus Type, 2016-2026
        1. 9.6.5.1. Asia Pacific Electric Bus Market, by Bus Type, 2016-2026 (USD Billion)
        2. 9.6.5.2. Asia Pacific Electric Bus Market, by Bus Type, 2016-2026 (K Units)
      6. 9.6.6. Asia Pacific Electric Bus Market, by Battery Capacity, 2016-2026
        1. 9.6.6.1. Asia Pacific Electric Bus Market, by Battery Capacity, 2016-2026 (USD Billion)
        2. 9.6.6.2. Asia Pacific Electric Bus Market, by Battery Capacity, 2016-2026 (K Units)
      7. 9.6.7. Asia Pacific Electric Bus Market, by Range, 2016-2026
        1. 9.6.7.1. Asia Pacific Electric Bus Market, by Range, 2016-2026 (USD Billion)
        2. 9.6.7.2. Asia Pacific Electric Bus Market, by Range, 2016-2026 (K Units)
      8. 9.6.8. Asia Pacific Electric Bus Market, by Propulsion Type, 2016-2026
        1. 9.6.8.1. Asia Pacific Electric Bus Market, by Propulsion Type, 2016-2026 (USD Billion)
        2. 9.6.8.2. Asia Pacific Electric Bus Market, by Propulsion Type, 2016-2026 (K Units)
      9. 9.6.9. Asia Pacific Electric Bus Market, by Component, 2016-2026
        1. 9.6.9.1. Asia Pacific Electric Bus Market, by Component, 2016-2026 (USD Billion)
        2. 9.6.9.2. Asia Pacific Electric Bus Market, by Component, 2016-2026 (K Units)
      10. 9.6.10. Asia Pacific Electric Bus Market, by Consumer Segment, 2016-2026
        1. 9.6.10.1. Asia Pacific Electric Bus Market, by Consumer Segment, 2016-2026 (USD Billion)
        2. 9.6.10.2. Asia Pacific Electric Bus Market, by Consumer Segment, 2016-2026 (K Units)
      11. 9.6.11. Asia Pacific Electric Bus Market, by Application, 2016-2026
        1. 9.6.11.1. Asia Pacific Electric Bus Market, by Application, 2016-2026 (USD Billion)
        2. 9.6.11.2. Asia Pacific Electric Bus Market, by Application, 2016-2026 (K Units)
      12. 9.6.12. China
        1. 9.6.12.1. China Market size and forecast, 2016-2026 (USD Billion)
        2. 9.6.12.2. China Market size and forecast, 2016-2026 (K Units)
      13. 9.6.13. Japan
        1. 9.6.13.1. Japan Market size and forecast, 2016-2026 (USD Billion)
        2. 9.6.13.2. Japan Market size and forecast, 2016-2026 (K Units)
      14. 9.6.14. India
        1. 9.6.14.1. India Market size and forecast, 2016-2026 (USD Billion)
        2. 9.6.14.2. India Market size and forecast, 2016-2026 (K Units)
      15. 9.6.15. South Korea
        1. 9.6.15.1. South Korea Market size and forecast, 2016-2026 (USD Billion)
        2. 9.6.15.2. South Korea Market size and forecast, 2016-2026 (K Units)
      16. 9.6.16. South-East Asia
        1. 9.6.16.1. South-East Asia Market size and forecast, 2016-2026 (USD Billion)
        2. 9.6.16.2. South-East Asia Market size and forecast, 2016-2026 (K Units)
      17. 9.6.17. Rest of Asia Pacific
        1. 9.6.17.1. Rest of Asia Pacific Market size and forecast, 2016-2026 (USD Billion)
        2. 9.6.17.2. Rest of Asia Pacific Market size and forecast, 2016-2026 (K Units)
    7. 9.7. Latin America
      1. 9.7.1. Latin America Electric Bus Market size and forecast, 2016-2026
      2. 9.7.2. Latin America Electric Bus Market, by Country, 2018 - 2025 (USD Billion)
      3. 9.7.3. Latin America Market size and forecast, 2016-2026 (K Units)
      4. 9.7.4. Latin America Electric Bus Market, by Country, 2018 - 2025 (K Units)
      5. 9.7.5. Latin America Electric Bus Market, by Bus Type, 2016-2026
        1. 9.7.5.1. Latin America Electric Bus Market, by Bus Type, 2016-2026 (USD Billion)
        2. 9.7.5.2. Latin America Electric Bus Market, by Bus Type, 2016-2026 (K Units)
      6. 9.7.6. Latin America Electric Bus Market, by Battery Capacity, 2016-2026
        1. 9.7.6.1. Latin America Electric Bus Market, by Battery Capacity, 2016-2026 (USD Billion)
        2. 9.7.6.2. Latin America Electric Bus Market, by Battery Capacity, 2016-2026 (K Units)
      7. 9.7.7. Latin America Electric Bus Market, by Range, 2016-2026
        1. 9.7.7.1. Latin America Electric Bus Market, by Range, 2016-2026 (USD Billion)
        2. 9.7.7.2. Latin America Electric Bus Market, by Range, 2016-2026 (K Units)
      8. 9.7.8. Latin America Electric Bus Market, by Propulsion Type, 2016-2026
        1. 9.7.8.1. Latin America Electric Bus Market, by Propulsion Type, 2016-2026 (USD Billion)
        2. 9.7.8.2. Latin America Electric Bus Market, by Propulsion Type, 2016-2026 (K Units)
      9. 9.7.9. Latin America Electric Bus Market, by Component, 2016-2026
        1. 9.7.9.1. Latin America Electric Bus Market, by Component, 2016-2026 (USD Billion)
        2. 9.7.9.2. Latin America Electric Bus Market, by Component, 2016-2026 (K Units)
      10. 9.7.10. Latin America Electric Bus Market, by Consumer Segment, 2016-2026
        1. 9.7.10.1. Latin America Electric Bus Market, by Consumer Segment, 2016-2026 (USD Billion)
        2. 9.7.10.2. Latin America Electric Bus Market, by Consumer Segment, 2016-2026 (K Units)
      11. 9.7.11. Latin America Electric Bus Market, by Application, 2016-2026
        1. 9.7.11.1. Latin America Electric Bus Market, by Application, 2016-2026 (USD Billion)
        2. 9.7.11.2. Latin America Electric Bus Market, by Application, 2016-2026 (K Units)
      12. 9.7.12. Brazil
        1. 9.7.12.1. Brazil Market size and forecast, 2016-2026 (USD Billion)
        2. 9.7.12.2. Brazil Market size and forecast, 2016-2026 (K Units)
      13. 9.7.13. Mexico
        1. 9.7.13.1. Mexico Market size and forecast, 2016-2026 (USD Billion)
        2. 9.7.13.2. Mexico Market size and forecast, 2016-2026 (K Units)
      14. 9.7.14. Rest of Latin America
        1. 9.7.14.1. Rest of Latin America Market size and forecast, 2016-2026 (USD Billion)
        2. 9.7.14.2. Rest of Latin America Market size and forecast, 2016-2026 (K Units)
    8. 9.8. The Middle-East and Africa
      1. 9.8.1. The Middle-East and Africa Electric Bus Market size and forecast, 2016-2026
      2. 9.8.2. The Middle-East and Africa Electric Bus Market, by Country, 2018 - 2025 (USD Billion)
      3. 9.8.3. The Middle-East and Africa Market size and forecast, 2016-2026 (K Units)
      4. 9.8.4. The Middle-East and Africa Electric Bus Market, by Country, 2018 - 2025 (K Units)
      5. 9.8.5. The Middle-East and Africa Electric Bus Market, by Bus Type, 2016-2026
        1. 9.8.5.1. The Middle-East and Africa Electric Bus Market, by Bus Type, 2016-2026 (USD Billion)
        2. 9.8.5.2. The Middle-East and Africa Electric Bus Market, by Bus Type, 2016-2026 (K Units)
      6. 9.8.6. The Middle-East and Africa Electric Bus Market, by Battery Capacity, 2016-2026
        1. 9.8.6.1. The Middle-East and Africa Electric Bus Market, by Battery Capacity, 2016-2026 (USD Billion)
        2. 9.8.6.2. The Middle-East and Africa Electric Bus Market, by Battery Capacity, 2016-2026 (K Units)
      7. 9.8.7. The Middle-East and Africa Electric Bus Market, by Range, 2016-2026
        1. 9.8.7.1. The Middle-East and Africa Electric Bus Market, by Range, 2016-2026 (USD Billion)
        2. 9.8.7.2. The Middle-East and Africa Electric Bus Market, by Range, 2016-2026 (K Units)
      8. 9.8.8. The Middle-East and Africa Electric Bus Market, by Propulsion Type, 2016-2026
        1. 9.8.8.1. The Middle-East and Africa Electric Bus Market, by Propulsion Type, 2016-2026 (USD Billion)
        2. 9.8.8.2. The Middle-East and Africa Electric Bus Market, by Propulsion Type, 2016-2026 (K Units)
      9. 9.8.9. The Middle-East and Africa Electric Bus Market, by Component, 2016-2026
        1. 9.8.9.1. The Middle-East and Africa Electric Bus Market, by Component, 2016-2026 (USD Billion)
        2. 9.8.9.2. The Middle-East and Africa Electric Bus Market, by Component, 2016-2026 (K Units)
      10. 9.8.10. The Middle-East and Africa Electric Bus Market, by Consumer Segment, 2016-2026
        1. 9.8.10.1. The Middle-East and Africa Electric Bus Market, by Consumer Segment, 2016-2026 (USD Billion)
        2. 9.8.10.2. The Middle-East and Africa Electric Bus Market, by Consumer Segment, 2016-2026 (K Units)
      11. 9.8.11. The Middle-East and Africa Electric Bus Market, by Application, 2016-2026
        1. 9.8.11.1. The Middle-East and Africa Electric Bus Market, by Application, 2016-2026 (USD Billion)
        2. 9.8.11.2. The Middle-East and Africa Electric Bus Market, by Application, 2016-2026 (K Units)
      12. 9.8.12. GCC Countries
        1. 9.8.12.1. GCC Countries Market size and forecast, 2016-2026 (USD Billion)
        2. 9.8.12.2. GCC Countries Market size and forecast, 2016-2026 (K Units)
      13. 9.8.13. South Africa
        1. 9.8.13.1. South Africa Market size and forecast, 2016-2026 (USD Billion)
        2. 9.8.13.2. South Africa Market size and forecast, 2016-2026 (K Units)
      14. 9.8.14. Rest of Middle-East Africa
        1. 9.8.14.1. Rest of Middle-East Africa Market size and forecast, 2016-2026 (USD Billion)
        2. 9.8.14.2. Rest of Middle-East Africa Market size and forecast, 2016-2026 (K Units)
  10. CHAPTER 10. Electric Bus Production, Consumption, Export, Import by Regions
    1. 10.1. Global Electric Bus production and revenue, 2015-2025 (USD Billion) (K Units)
    2. 10.2. Global Import and Export Analysis, by Region
  11. CHAPTER 11. Electric Bus market – Competitive Landscape
    1. 11.1. Competitor Market Share – Revenue
    2. 11.2. Market Concentration Rate Analysis, Top 3 and Top 5 Players
    3. 11.3. Competitor Market Share – Volume
    4. 11.4. Strategic Development
      1. 11.4.1. Acquisitions and Mergers
      2. 11.4.2. New Products
      3. 11.4.3. Research & Development Activities
  12. CHAPTER 12. Company Profiles
    1. 12.1. Daimler AG
      1. 12.1.1. Company Overview
      2. 12.1.2. Daimler AG Sales, Revenue, Price, and Gross Margin
      3. 12.1.3. Product portfolio
      4. 12.1.4. Recent initiatives
    2. 12.2. Solaris Bus & Coach S.A.
      1. 12.2.1. Company Overview
      2. 12.2.2. Solaris Bus & Coach S.A. Sales, Revenue, Price, and Gross Margin
      3. 12.2.3. Product portfolio
      4. 12.2.4. Recent initiatives
    3. 12.3. New Flyer Industries Inc.
      1. 12.3.1. Company Overview
      2. 12.3.2. New Flyer Industries Inc. Sales, Revenue, Price, and Gross Margin
      3. 12.3.3. Product portfolio
      4. 12.3.4. Recent initiatives
    4. 12.4. Proterra Inc.
      1. 12.4.1. Company Overview
      2. 12.4.2. Proterra Inc. Sales, Revenue, Price, and Gross Margin
      3. 12.4.3. Product portfolio
      4. 12.4.4. Recent initiatives
    5. 12.5. EBUSCO
      1. 12.5.1. Company Overview
      2. 12.5.2. EBUSCO Sales, Revenue, Price, and Gross Margin
      3. 12.5.3. Product portfolio
      4. 12.5.4. Recent initiatives
    6. 12.6. Zhengzhou Yutong Group Co. Ltd.
      1. 12.6.1. Company Overview
      2. 12.6.2. Zhengzhou Yutong Group Co. Ltd. Sales, Revenue, Price, and Gross Margin
      3. 12.6.3. Product portfolio
      4. 12.6.4. Recent initiatives
    7. 12.7. AB Volvo
      1. 12.7.1. Company Overview
      2. 12.7.2. AB Volvo Sales, Revenue, Price, and Gross Margin
      3. 12.7.3. Product portfolio
      4. 12.7.4. Recent initiatives
    8. 12.8. BYD Company Limited
      1. 12.8.1. Company Overview
      2. 12.8.2. BYD Company Limited Sales, Revenue, Price, and Gross Margin
      3. 12.8.3. Product portfolio
      4. 12.8.4. Recent initiatives
  13. CHAPTER 13. Electric Bus — Industry Analysis
    1. 13.1. Introduction and Taxonomy
    2. 13.2. Electric Bus Market – Key Trends
      1. 13.2.1. Market Drivers
      2. 13.2.2. Market Restraints
      3. 13.2.3. Market Opportunities
    3. 13.3. Value Chain Analysis
    4. 13.4. Key Mandates and Regulations
    5. 13.5. Technology Roadmap and Timeline
    6. 13.6. Electric Bus market – Attractiveness Analysis
      1. 13.6.1. By Bus Type
      2. 13.6.2. By Battery Capacity
      3. 13.6.3. By Range
      4. 13.6.4. By Propulsion Type
      5. 13.6.5. By Component
      6. 13.6.6. By Consumer Segment
      7. 13.6.7. By Application
      8. 13.6.8. By Region
  14. CHAPTER 14. Raw Material analysis
    1. 14.1. Electric Bus Key Raw Material Analysis
      1. 14.1.1. Key Raw Materials
      2. 14.1.2. Price Trend of Key Raw Materials
    2. 14.2. Key Suppliers of Raw Materials
    3. 14.3. Proportion of Manufacturing Cost Structure
      1. 14.3.1. Raw Materials
      2. 14.3.2. Labor Cost
    4. 14.4. Manufacturing Expenses Analysis of Electric Bus
  15. CHAPTER 15. Industrial Chain, Sourcing Strategy and Downstream Buyers
    1. 15.1. Electric Bus Industrial Chain Analysis
    2. 15.2. Upstream Raw Materials Sourcing
      1. 15.2.1. Risk Mitigation:
      2. 15.2.2. Supplier Relationships:
      3. 15.2.3. Business Processes:
      4. 15.2.4. Securing the Product:
    3. 15.3. Raw Materials Sources of Electric Bus Major Manufacturers in 2016
    4. 15.4. Downstream Buyers
    5. 15.5. Distributors/Traders List
  16. CHAPTER 16. Marketing Strategy Analysis, Distributors
    1. 16.1. Marketing Channel
    2. 16.2. Direct Marketing
    3. 16.3. Indirect Marketing
    4. 16.4. Marketing Channel Development Trend
    5. 16.5. Economic/Political Environmental Change
  17. CHAPTER 17. Report Conclusion
  18. CHAPTER 18. Research Approach & Methodology
    1. 18.1. Report Description
    2. 18.2. Research Scope
    3. 18.3. Research Methodology
      1. 18.3.1. Secondary Research
      2. 18.3.2. Primary Research
      3. 18.3.3. Models
        1. 18.3.3.1. Company Share Analysis Model
        2. 18.3.3.2. Revenue Based Modeling
        3. 18.3.3.3. Research Limitations

        List of Figures

        FIG. 1 Global Electric Bus Market, 2016-2026 (USD Billion)
        FIG. 2 Global Electric Bus Market Share, by Bus Type, 2018 & 2025 (USD Billion)
        FIG. 3 Global Electric Bus Market share, by Bus Type, 2018 & 2025 (K Units)
        FIG. 4 Global Less than 9m Electric Bus Market, 2016-2026 (USD Billion)
        FIG. 5 Global Less than 9m Electric Bus  Market, 2016-2026 (K Units)
        FIG. 6 Global 9-14m Electric Bus Market, 2016-2026 (USD Billion)
        FIG. 7 Global 9-14m Electric Bus  Market, 2016-2026 (K Units)
        FIG. 8 Global Above 14m Electric Bus Market, 2016-2026 (USD Billion)
        FIG. 9 Global Above 14m Electric Bus  Market, 2016-2026 (K Units)
        FIG. 10 Global Electric Bus Market Share, by Battery Capacity, 2018 & 2025 (USD Billion)
        FIG. 11 Global Electric Bus Market share, by Battery Capacity, 2018 & 2025 (K Units)
        FIG. 12 Global Less than 50kWh Electric Bus Market, 2016-2026 (USD Billion)
        FIG. 13 Global Less than 50kWh Electric Bus  Market, 2016-2026 (K Units)
        FIG. 14 Global 50–250kWh Electric Bus Market, 2016-2026 (USD Billion)
        FIG. 15 Global 50–250kWh Electric Bus  Market, 2016-2026 (K Units)
        FIG. 16 Global Above 250kWh Electric Bus Market, 2016-2026 (USD Billion)
        FIG. 17 Global Above 250kWh Electric Bus  Market, 2016-2026 (K Units)
        FIG. 18 Global Electric Bus Market Share, by Range, 2018 & 2025 (USD Billion)
        FIG. 19 Global Electric Bus Market share, by Range, 2018 & 2025 (K Units)
        FIG. 20 Global Less than 150 miles Electric Bus Market, 2016-2026 (USD Billion)
        FIG. 21 Global Less than 150 miles Electric Bus  Market, 2016-2026 (K Units)
        FIG. 22 Global 150–300 miles Electric Bus Market, 2016-2026 (USD Billion)
        FIG. 23 Global 150–300 miles Electric Bus  Market, 2016-2026 (K Units)
        FIG. 24 Global Above 300 miles Electric Bus Market, 2016-2026 (USD Billion)
        FIG. 25 Global Above 300 miles Electric Bus  Market, 2016-2026 (K Units)
        FIG. 26 Global Electric Bus Market Share, by Propulsion Type, 2018 & 2025 (USD Billion)
        FIG. 27 Global Electric Bus Market share, by Propulsion Type, 2018 & 2025 (K Units)
        FIG. 28 Global PHEV Electric Bus Market, 2016-2026 (USD Billion)
        FIG. 29 Global PHEV Electric Bus  Market, 2016-2026 (K Units)
        FIG. 30 Global BEV Electric Bus Market, 2016-2026 (USD Billion)
        FIG. 31 Global BEV Electric Bus  Market, 2016-2026 (K Units)
        FIG. 32 Global FCEV Electric Bus Market, 2016-2026 (USD Billion)
        FIG. 33 Global FCEV Electric Bus  Market, 2016-2026 (K Units)
        FIG. 34 Global Electric Bus Market Share, by Component, 2018 & 2025 (USD Billion)
        FIG. 35 Global Electric Bus Market share, by Component, 2018 & 2025 (K Units)
        FIG. 36 Global Battery Electric Bus Market, 2016-2026 (USD Billion)
        FIG. 37 Global Battery Electric Bus  Market, 2016-2026 (K Units)
        FIG. 38 Global Motor Electric Bus Market, 2016-2026 (USD Billion)
        FIG. 39 Global Motor Electric Bus  Market, 2016-2026 (K Units)
        FIG. 40 Global Ultra-Capacitor Electric Bus Market, 2016-2026 (USD Billion)
        FIG. 41 Global Ultra-Capacitor Electric Bus  Market, 2016-2026 (K Units)
        FIG. 42 Global Fuel Cell Stack Electric Bus Market, 2016-2026 (USD Billion)
        FIG. 43 Global Fuel Cell Stack Electric Bus  Market, 2016-2026 (K Units)
        FIG. 44 Global Electric Bus Market Share, by Consumer Segment, 2018 & 2025 (USD Billion)
        FIG. 45 Global Electric Bus Market share, by Consumer Segment, 2018 & 2025 (K Units)
        FIG. 46 Global Fleet Operator Electric Bus Market, 2016-2026 (USD Billion)
        FIG. 47 Global Fleet Operator Electric Bus  Market, 2016-2026 (K Units)
        FIG. 48 Global Government Electric Bus Market, 2016-2026 (USD Billion)
        FIG. 49 Global Government Electric Bus  Market, 2016-2026 (K Units)
        FIG. 50 Global Electric Bus Market Share, by Application, 2018 & 2025 (USD Billion)
        FIG. 51 Global Electric Bus Market share, by Application, 2018 & 2025 (K Units)
        FIG. 52 Global Intercity Electric Bus Market, 2016-2026 (USD Billion)
        FIG. 53 Global Intercity Electric Bus  Market, 2016-2026 (K Units)
        FIG. 54 Global Intracity Electric Bus Market, 2016-2026 (USD Billion)
        FIG. 55 Global Intracity Electric Bus  Market, 2016-2026 (K Units)
        FIG. 56 Global Electric Bus Market Share, by Region, 2018 & 2025
        FIG. 57 Global Electric Bus Market Share, by Region, 2018 & 2025
        FIG. 58 North America Electric Bus Market, 2016-2026
        FIG. 59 North America Electric Bus  Market, 2016-2026 (K Units)
        FIG. 60 U.S. Electric Bus Market, 2016-2026
        FIG. 61 U.S. Electric Bus  Market, 2016-2026 (K Units)
        FIG. 62 Canada Electric Bus Market, 2016-2026
        FIG. 63 Canada Electric Bus  Market, 2016-2026 (K Units)
        FIG. 64 Europe Electric Bus Market, 2016-2026
        FIG. 65 Europe Electric Bus  Market, 2016-2026 (K Units)
        FIG. 66 Germany Electric Bus Market, 2016-2026
        FIG. 67 Germany Electric Bus  Market, 2016-2026 (K Units)
        FIG. 68 France Electric Bus Market, 2016-2026
        FIG. 69 France Electric Bus  Market, 2016-2026 (K Units)
        FIG. 70 U.K. Electric Bus Market, 2016-2026
        FIG. 71 U.K. Electric Bus  Market, 2016-2026 (K Units)
        FIG. 72 Italy Electric Bus Market, 2016-2026
        FIG. 73 Italy Electric Bus  Market, 2016-2026 (K Units)
        FIG. 74 Spain Electric Bus Market, 2016-2026
        FIG. 75 Spain Electric Bus  Market, 2016-2026 (K Units)
        FIG. 76 Rest of Europe Electric Bus Market, 2016-2026
        FIG. 77 Rest of Europe Electric Bus  Market, 2016-2026 (K Units)
        FIG. 78 Asia Pacific Electric Bus Market, 2016-2026
        FIG. 79 Asia Pacific Electric Bus  Market, 2016-2026 (K Units)
        FIG. 80 China Electric Bus Market, 2016-2026
        FIG. 81 China Electric Bus  Market, 2016-2026 (K Units)
        FIG. 82 Japan Electric Bus Market, 2016-2026
        FIG. 83 Japan Electric Bus  Market, 2016-2026 (K Units)
        FIG. 84 India Electric Bus Market, 2016-2026
        FIG. 85 India Electric Bus  Market, 2016-2026 (K Units)
        FIG. 86 South  Korea Electric Bus Market, 2016-2026
        FIG. 87 South  Korea Electric Bus  Market, 2016-2026 (K Units)
        FIG. 88 South-East Asia Electric Bus Market, 2016-2026
        FIG. 89 South-East Asia Electric Bus  Market, 2016-2026 (K Units)
        FIG. 90 Rest of Asia Pacific Electric Bus Market, 2016-2026
        FIG. 91 Rest of Asia Pacific Electric Bus  Market, 2016-2026 (K Units)
        FIG. 92 Latin America Electric Bus Market, 2016-2026
        FIG. 93 Latin America Electric Bus  Market, 2016-2026 (K Units)
        FIG. 94 Brazil Electric Bus Market, 2016-2026
        FIG. 95 Brazil Electric Bus  Market, 2016-2026 (K Units)
        FIG. 96 Mexico Electric Bus Market, 2016-2026
        FIG. 97 Mexico Electric Bus  Market, 2016-2026 (K Units)
        FIG. 98 Rest of Latin America Electric Bus Market, 2016-2026
        FIG. 99 Rest of Latin America Electric Bus  Market, 2016-2026 (K Units)
        FIG. 100 The Middle-East and Africa Electric Bus Market, 2016-2026
        FIG. 101 The Middle-East and Africa Electric Bus  Market, 2016-2026 (K Units)
        FIG. 102 GCC Countries Electric Bus Market, 2016-2026
        FIG. 103 GCC Countries Electric Bus  Market, 2016-2026 (K Units)
        FIG. 104 South Africa Electric Bus Market, 2016-2026
        FIG. 105 South Africa Electric Bus  Market, 2016-2026 (K Units)
        FIG. 106 Rest of Middle-East Africa Electric Bus Market, 2016-2026
        FIG. 107 Rest of Middle-East Africa Electric Bus  Market, 2016-2026 (K Units)
        FIG. 108 Global Electric Bus production and revenue, 2015-2025 (USD Billion) (K Units)
        FIG. 109 North America Electric Bus production and revenue, 2015-2025 (USD Billion) (K Units)
        FIG. 110 Europe Electric Bus production and revenue, 2015-2025 (USD Billion) (K Units)
        FIG. 111 Asia Pacific Electric Bus production and revenue, 2015-2025 (USD Billion) (K Units)
        FIG. 112 Latin America Electric Bus production and revenue, 2015-2025 (USD Billion) (K Units)
        FIG. 113 Middle East and Africa Electric Bus production and revenue, 2015-2025 (USD Billion) (K Units)
        FIG. 114 Competitor Market Share – Revenue
        FIG. 115 Competitor Market Share – Volume
        FIG. 116 Daimler AG Revenue and Growth Rate
        FIG. 117 Daimler AG Market Share
        FIG. 118 Solaris Bus & Coach S.A. Revenue and Growth Rate
        FIG. 119 Solaris Bus & Coach S.A. Market Share
        FIG. 120 New Flyer Industries Inc. Revenue and Growth Rate
        FIG. 121 New Flyer Industries Inc. Market Share
        FIG. 122 Proterra Inc. Revenue and Growth Rate
        FIG. 123 Proterra Inc. Market Share
        FIG. 124 EBUSCO Revenue and Growth Rate
        FIG. 125 EBUSCO Market Share
        FIG. 126 Zhengzhou Yutong Group Co. Ltd. Revenue and Growth Rate
        FIG. 127 Zhengzhou Yutong Group Co. Ltd. Market Share
        FIG. 128 AB Volvo Revenue and Growth Rate
        FIG. 129 AB Volvo Market Share
        FIG. 130 BYD Company Limited Revenue and Growth Rate
        FIG. 131 BYD Company Limited Market Share
        FIG. 132 Market Dynamics
        FIG. 133 Global Electric Bus – Value Chain Analysis
        FIG. 134 Key Mandates and Regulations
        FIG. 135 Technology Roadmap and Timeline
        FIG. 136 Market Attractiveness Analysis – By Bus Type
        FIG. 137 Market Attractiveness Analysis – By Battery Capacity
        FIG. 138 Market Attractiveness Analysis – By Range
        FIG. 139 Market Attractiveness Analysis – By Propulsion Type
        FIG. 140 Market Attractiveness Analysis – By Component
        FIG. 141 Market Attractiveness Analysis – By Consumer Segment
        FIG. 142 Market Attractiveness Analysis – By Application
        FIG. 143 Market Attractiveness Analysis – By Region
        FIG. 144 Manufacturing Cost Structure of Electric Bus
        FIG. 145 Electric Bus Industrial Chain Analysis
        FIG. 146 Market Channel
        FIG. 147 Marketing Channel Development Trend
        FIG. 148 Growth in World Gross Product, 2008-2018

        List of Tables

        TABLE 1 Global Electric Bus market, 2018 & 2025 (USD Billion)
        TABLE 2 Global Electric Bus market, by Bus Type, 2016-2026 (USD Billion)
        TABLE 3 Global Electric Bus market, by Bus Type, 2016-2026 (K Units)
        TABLE 4 Global Electric Bus market, by Battery Capacity, 2016-2026 (USD Billion)
        TABLE 5 Global Electric Bus market, by Battery Capacity, 2016-2026 (K Units)
        TABLE 6 Global Electric Bus market, by Range, 2016-2026 (USD Billion)
        TABLE 7 Global Electric Bus market, by Range, 2016-2026 (K Units)
        TABLE 8 Global Electric Bus market, by Propulsion Type, 2016-2026 (USD Billion)
        TABLE 9 Global Electric Bus market, by Propulsion Type, 2016-2026 (K Units)
        TABLE 10 Global Electric Bus market, by Component, 2016-2026 (USD Billion)
        TABLE 11 Global Electric Bus market, by Component, 2016-2026 (K Units)
        TABLE 12 Global Electric Bus market, by Consumer Segment, 2016-2026 (USD Billion)
        TABLE 13 Global Electric Bus market, by Consumer Segment, 2016-2026 (K Units)
        TABLE 14 Global Electric Bus market, by Application, 2016-2026 (USD Billion)
        TABLE 15 Global Electric Bus market, by Application, 2016-2026 (K Units)
        TABLE 16 Global Electric Bus market, by region, 2016-2026 (USD Billion)
        TABLE 17 Global Electric Bus market, by region, 2016-2026 (K Units)
        TABLE 18 North America Electric Bus Market, by Bus Type, 2016-2026 (USD Billion)
        TABLE 19 North America Electric Bus Market, by Bus Type, 2016-2026 (K Units)
        TABLE 20 North America Electric Bus Market, by Battery Capacity, 2016-2026 (USD Billion)
        TABLE 21 North America Electric Bus Market, by Battery Capacity, 2016-2026 (K Units)
        TABLE 22 North America Electric Bus Market, by Range, 2016-2026 (USD Billion)
        TABLE 23 North America Electric Bus Market, by Range, 2016-2026 (K Units)
        TABLE 24 North America Electric Bus Market, by Propulsion Type, 2016-2026 (USD Billion)
        TABLE 25 North America Electric Bus Market, by Propulsion Type, 2016-2026 (K Units)
        TABLE 26 North America Electric Bus Market, by Component, 2016-2026 (USD Billion)
        TABLE 27 North America Electric Bus Market, by Component, 2016-2026 (K Units)
        TABLE 28 North America Electric Bus Market, by Consumer Segment, 2016-2026 (USD Billion)
        TABLE 29 North America Electric Bus Market, by Consumer Segment, 2016-2026 (K Units)
        TABLE 30 North America Electric Bus Market, by Application, 2016-2026 (USD Billion)
        TABLE 31 North America Electric Bus Market, by Application, 2016-2026 (K Units)
        TABLE 32 Europe Electric Bus Market, by Bus Type, 2016-2026 (USD Billion)
        TABLE 33 Europe Electric Bus Market, by Bus Type, 2016-2026 (K Units)
        TABLE 34 Europe Electric Bus Market, by Battery Capacity, 2016-2026 (USD Billion)
        TABLE 35 Europe Electric Bus Market, by Battery Capacity, 2016-2026 (K Units)
        TABLE 36 Europe Electric Bus Market, by Range, 2016-2026 (USD Billion)
        TABLE 37 Europe Electric Bus Market, by Range, 2016-2026 (K Units)
        TABLE 38 Europe Electric Bus Market, by Propulsion Type, 2016-2026 (USD Billion)
        TABLE 39 Europe Electric Bus Market, by Propulsion Type, 2016-2026 (K Units)
        TABLE 40 Europe Electric Bus Market, by Component, 2016-2026 (USD Billion)
        TABLE 41 Europe Electric Bus Market, by Component, 2016-2026 (K Units)
        TABLE 42 Europe Electric Bus Market, by Consumer Segment, 2016-2026 (USD Billion)
        TABLE 43 Europe Electric Bus Market, by Consumer Segment, 2016-2026 (K Units)
        TABLE 44 Europe Electric Bus Market, by Application, 2016-2026 (USD Billion)
        TABLE 45 Europe Electric Bus Market, by Application, 2016-2026 (K Units)
        TABLE 46 Asia Pacific Electric Bus Market, by Bus Type, 2016-2026 (USD Billion)
        TABLE 47 Asia Pacific Electric Bus Market, by Bus Type, 2016-2026 (K Units)
        TABLE 48 Asia Pacific Electric Bus Market, by Battery Capacity, 2016-2026 (USD Billion)
        TABLE 49 Asia Pacific Electric Bus Market, by Battery Capacity, 2016-2026 (K Units)
        TABLE 50 Asia Pacific Electric Bus Market, by Range, 2016-2026 (USD Billion)
        TABLE 51 Asia Pacific Electric Bus Market, by Range, 2016-2026 (K Units)
        TABLE 52 Asia Pacific Electric Bus Market, by Propulsion Type, 2016-2026 (USD Billion)
        TABLE 53 Asia Pacific Electric Bus Market, by Propulsion Type, 2016-2026 (K Units)
        TABLE 54 Asia Pacific Electric Bus Market, by Component, 2016-2026 (USD Billion)
        TABLE 55 Asia Pacific Electric Bus Market, by Component, 2016-2026 (K Units)
        TABLE 56 Asia Pacific Electric Bus Market, by Consumer Segment, 2016-2026 (USD Billion)
        TABLE 57 Asia Pacific Electric Bus Market, by Consumer Segment, 2016-2026 (K Units)
        TABLE 58 Asia Pacific Electric Bus Market, by Application, 2016-2026 (USD Billion)
        TABLE 59 Asia Pacific Electric Bus Market, by Application, 2016-2026 (K Units)
        TABLE 60 Latin America Electric Bus Market, by Bus Type, 2016-2026 (USD Billion)
        TABLE 61 Latin America Electric Bus Market, by Bus Type, 2016-2026 (K Units)
        TABLE 62 Latin America Electric Bus Market, by Battery Capacity, 2016-2026 (USD Billion)
        TABLE 63 Latin America Electric Bus Market, by Battery Capacity, 2016-2026 (K Units)
        TABLE 64 Latin America Electric Bus Market, by Range, 2016-2026 (USD Billion)
        TABLE 65 Latin America Electric Bus Market, by Range, 2016-2026 (K Units)
        TABLE 66 Latin America Electric Bus Market, by Propulsion Type, 2016-2026 (USD Billion)
        TABLE 67 Latin America Electric Bus Market, by Propulsion Type, 2016-2026 (K Units)
        TABLE 68 Latin America Electric Bus Market, by Component, 2016-2026 (USD Billion)
        TABLE 69 Latin America Electric Bus Market, by Component, 2016-2026 (K Units)
        TABLE 70 Latin America Electric Bus Market, by Consumer Segment, 2016-2026 (USD Billion)
        TABLE 71 Latin America Electric Bus Market, by Consumer Segment, 2016-2026 (K Units)
        TABLE 72 Latin America Electric Bus Market, by Application, 2016-2026 (USD Billion)
        TABLE 73 Latin America Electric Bus Market, by Application, 2016-2026 (K Units)
        TABLE 74 The Middle-East and Africa Electric Bus Market, by Bus Type, 2016-2026 (USD Billion)
        TABLE 75 The Middle-East and Africa Electric Bus Market, by Bus Type, 2016-2026 (K Units)
        TABLE 76 The Middle-East and Africa Electric Bus Market, by Battery Capacity, 2016-2026 (USD Billion)
        TABLE 77 The Middle-East and Africa Electric Bus Market, by Battery Capacity, 2016-2026 (K Units)
        TABLE 78 The Middle-East and Africa Electric Bus Market, by Range, 2016-2026 (USD Billion)
        TABLE 79 The Middle-East and Africa Electric Bus Market, by Range, 2016-2026 (K Units)
        TABLE 80 The Middle-East and Africa Electric Bus Market, by Propulsion Type, 2016-2026 (USD Billion)
        TABLE 81 The Middle-East and Africa Electric Bus Market, by Propulsion Type, 2016-2026 (K Units)
        TABLE 82 The Middle-East and Africa Electric Bus Market, by Component, 2016-2026 (USD Billion)
        TABLE 83 The Middle-East and Africa Electric Bus Market, by Component, 2016-2026 (K Units)
        TABLE 84 The Middle-East and Africa Electric Bus Market, by Consumer Segment, 2016-2026 (USD Billion)
        TABLE 85 The Middle-East and Africa Electric Bus Market, by Consumer Segment, 2016-2026 (K Units)
        TABLE 86 The Middle-East and Africa Electric Bus Market, by Application, 2016-2026 (USD Billion)
        TABLE 87 The Middle-East and Africa Electric Bus Market, by Application, 2016-2026 (K Units)
        TABLE 88 North America Electric Bus Production, Consumption, Export, Import, 2016-2019
        TABLE 89 Europe Electric Bus Production, Consumption, Export, Import, 2016-2019
        TABLE 90 Asia Pacific Electric Bus Production, Consumption, Export, Import, 2016-2019
        TABLE 91 Latin America Electric Bus Production, Consumption, Export, Import, 2016-2019
        TABLE 92 Middle East & Africa Electric Bus Production, Consumption, Export, Import, 2016-2019
        TABLE 93 Global Electric Bus Market - Company Revenue Analysis 2016-2019 (USD Billion)
        TABLE 94 Global Electric Bus Market - Company Revenue Share Analysis 2016-2019(%)
        TABLE 95 Global Electric Bus Market - Company Volume Analysis 2016-2019 (K Units)
        TABLE 96 Global Electric Bus Market - Company Volume Share Analysis 2016-2019(%)
        TABLE 97 Acquisitions and Mergers
        TABLE 98 New Product/Service Launch
        TABLE 99 Research & Development Activities
        TABLE 100 Market Drivers
        TABLE 101 Market Restraints
        TABLE 102 Market Opportunities
        TABLE 103 Production Base and Market Concentration Rate of Raw Material
        TABLE 104 Key Suppliers of Raw Materials
        TABLE 105 Raw Materials Sources of Electric Bus Major Manufacturers in 2016
        TABLE 106 Major Buyers of Electric Bus
        TABLE 107 Distributors/Traders of Electric Bus by Region

Industry Major Market Players

  •  Daimler AG
  •  Solaris Bus & Coach S.A.
  •  New Flyer Industries Inc.
  •  Proterra Inc.
  •  EBUSCO
  •  Zhengzhou Yutong Group Co. Ltd.
  •  AB Volvo
  •  BYD Company Limited