Search Market Research Report

Discover Our Latest Reports
Discover Our Featured Reports
Discover Top Selling Reports

Dried Blueberries Market Size, Share Global Analysis Report, 2023 – 2030

report img

Dried Blueberries Market Size, Share, Growth Analysis Report By Form (Whole Dried Fruits, Granules & Slices, and Powder), By Nature (Conventional and Organic), By Distribution Channel (Convenience Stores, Independent Small Groceries, Supermarkets, Online Retailing, Forecourt Retailers, Specialty Stores, Hypermarkets, and Others), By End-User (Bakery Products, Dairy Products, Dietary Supplements, Foodservice Providers, Confectionaries, Cereals & Snack Bars, Beverages, Personal Care & Cosmetic Products, Retailer, and Others), and By Region - Global and Regional Industry Insights, Overview, Comprehensive Analysis, Trends, Statistical Research, Market Intelligence, Historical Data and Forecast 2023 – 2030

Industry Insights

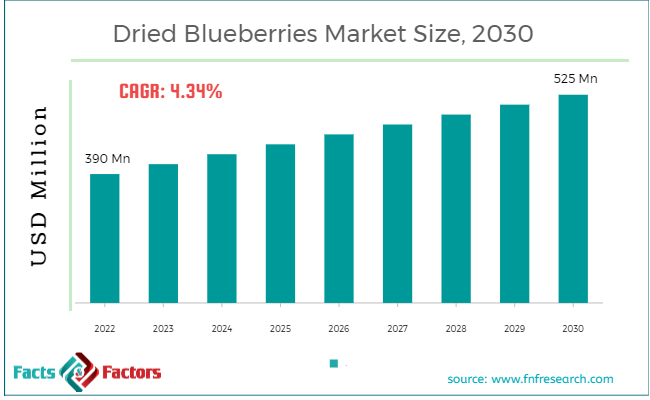
[174+ Pages Report] According to the report published by Facts and Factors, the global Dried Blueberries market size was valued around USD 390 million in 2022 and is predicted to grow around USD 525 million by 2030 with a compound annual growth rate (CAGR) of roughly 4.24% between 2023 and 2030. The report analyses the global Dried Blueberries market drivers, restraints/challenges, and the effect they have on the demands during the forecast period. In addition, the report analyses emerging opportunities in the Dried Blueberries market.

dried-blueberries-market-size

To know more about this report | Request Free Sample Copy

The data published in the global dried blueberries market report illustrates all-encompassing information related to the market comprising analysis and forecast. The analysts provide the market's historical data from 2019 to 2021, forecasted market growth trend from 2023–2030, and the predictive Dried Blueberries Market size by the end of the forecasted period in terms of revenue (USD Million). The analysts employed multiple market research tools and statistical techniques such as PESTEL analysis, Porter's Five Forces, and SWOT analysis for the effectual analysis of the market on a global and regional basis.

The analysts used both primary and secondary resources to collate the information and evaluate the current size of the global dried blueberries market. The report provides descriptive information regarding the key drivers & restraints that are affecting the market growth along with its demand & supply chain, geographical segmentation, and key market players.

Escalating health concerns among the consumers have transformed into massive demand for nutritive blueberries enriched in vitamins, magnesium, iron, and antioxidants, thereby steering the growth of the dried bluerries market. In addition, the easy accessibility of dried blueberries at an online marketplace significantly boosts the global market. However, volatile production and the constantly rising market price of the dried blueberries impede the market growth.

logoReport Scope

Report Attribute

Details

Market Size in 2022

USD 390 Million

Projected Market Size in 2030

USD 525 Million

CAGR Growth Rate

4.34% CAGR

Base Year

2022

Forecast Years

2023-2030

Key Market Players

Eden Foods, OSKRI Corporation, CAL-SAN Enterprises, Ltd, Kiantama Oy, True Blue Farms, Bergin Fruit and Nut Company, Del Monte Food, Inc., MEDURI FARMS, Traina Foods, KAREN'S NATURALS, Oregon Berry Packing Inc., Shoreline Fruit, Naturipe Farms LLC., Angas Park Fruit Co., Helsu foods, Tesco.com, Graceland Fruit, Beprepared, and Royal Nut Company, among others.

Key Segment

By Form, Nature, Distribution Channel, End-User, and Region

Major Regions Covered

North America, Europe, Asia Pacific, Latin America, and the Middle East & Africa

Purchase Options

Request customized purchase options to meet your research needs. Explore purchase options

logoSegmental Overview:

The global dried blueberries market report segments the market based on the form, nature, distribution channel, end-user, and region. By form, the global market is bifurcated into whole dried fruits, granules & slices, and powder. By nature, the market is categorized into conventional and organic. By distribution channel, the market is divided into convenience stores, independent small groceries, supermarkets, online retailing, forecourt retailers, specialty stores, hypermarkets, and others. By the end-user, the market is classified into bakery products, dairy products, dietary supplements, foodservice providers, confectionaries, cereals & snack bars, beverages, personal care & cosmetic products, retail, and others.

logoMajor Key Players

The key players involved in the global dried blueberries market are :

  • Eden Foods
  • OSKRI Corporation
  • CAL-SAN Enterprises Ltd.
  • Kiantama Oy
  • True Blue Farms
  • Bergin Fruit and Nut Company
  • Del Monte Food Inc.
  • MEDURI FARMS
  • Traina Foods
  • KAREN'S NATURALS
  • Oregon Berry Packing Inc.
  • Shoreline Fruit
  • Naturipe Farms LLC.
  • Angas Park Fruit Co.
  • Helsu Foods
  • Tesco.com
  • Graceland Fruit
  • Beprepared
  • Royal Nut Company

The global dried blueberries market is segmented as:

logo By Form

  • Whole Dried Fruits
  • Granules & Slices
  • Powder

logo By Nature

  • Conventional
  • Organic

logo By Distribution Channel

  • Convenience Stores
  • Independent Small Groceries
  • Supermarkets
  • Online Retailing
  • Forecourt Retailers
  • Specialty Stores
  • Hypermarkets
  • Others

logo By End-User

  • Bakery Products
  • Dairy Products
  • Dietary Supplements
  • Foodservice Providers
  • Confectionaries
  • Cereal & Snack Bars
  • Beverages
  • Personal Care& Cosmetics Products
  • Retail
  • Others

logo By Region

  • North America
    • The U.S.
    • Canada
    • Mexico
  • Europe
    • France
    • The UK
    • Spain
    • Germany
    • Italy
    • Nordic Countries
      • Denmark
      • Sweden
      • Norway
    • Benelux Union
      • Belgium
      • The Netherlands
      • Luxembourg
    • Rest of Europe
  • Asia Pacific
    • China
    • Japan
    • India
    • Australia
    • South Korea
    • Southeast Asia
      • Indonesia
      • Thailand
      • Malaysia
      • Singapore
      • Rest of Southeast Asia
    • Rest of Asia Pacific
  • The Middle East & Africa
    • Saudi Arabia
    • UAE
    • Egypt
    • South Africa
    • Rest of the Middle East & Africa
  • Latin America
    • Brazil
    • Argentina
    • Rest of Latin America

Table of Content

  1. CHAPTER 1. Executive Summary
  2. CHAPTER 2. Dried Blueberries market – Form Analysis
    1. 2.1. Global Dried Blueberries Market – Form Overview
    2. 2.2. Global Dried Blueberries Market Share, by Form, 2023 & 2030 (USD Million)
    3. 2.3. Whole Dried Fruits
      1. 2.3.1. Global Whole Dried Fruits Dried Blueberries Market, 2020-2030 (USD Million)
    4. 2.4. Granules & Slices
      1. 2.4.1. Global Granules & Slices Dried Blueberries Market, 2020-2030 (USD Million)
    5. 2.5. Powder
      1. 2.5.1. Global Powder Dried Blueberries Market, 2020-2030 (USD Million)
  3. CHAPTER 3. Dried Blueberries market – Nature Analysis
    1. 3.1. Global Dried Blueberries Market – Nature Overview
    2. 3.2. Global Dried Blueberries Market Share, by Nature, 2023 & 2030 (USD Million)
    3. 3.3. Conventional
      1. 3.3.1. Global Conventional Dried Blueberries Market, 2020-2030 (USD Million)
    4. 3.4. Organic
      1. 3.4.1. Global Organic Dried Blueberries Market, 2020-2030 (USD Million)
  4. CHAPTER 4. Dried Blueberries market – Distribution Channel Analysis
    1. 4.1. Global Dried Blueberries Market – Distribution Channel Overview
    2. 4.2. Global Dried Blueberries Market Share, by Distribution Channel, 2023 & 2030 (USD Million)
    3. 4.3. Convenience Stores
      1. 4.3.1. Global Convenience Stores Dried Blueberries Market, 2020-2030 (USD Million)
    4. 4.4. Independent Small Groceries
      1. 4.4.1. Global Independent Small Groceries Dried Blueberries Market, 2020-2030 (USD Million)
    5. 4.5. Supermarkets
      1. 4.5.1. Global Supermarkets Dried Blueberries Market, 2020-2030 (USD Million)
    6. 4.6. Online Retailing
      1. 4.6.1. Global Online Retailing Dried Blueberries Market, 2020-2030 (USD Million)
    7. 4.7. Forecourt Retailers
      1. 4.7.1. Global Forecourt Retailers Dried Blueberries Market, 2020-2030 (USD Million)
    8. 4.8. Specialty Stores
      1. 4.8.1. Global Specialty Stores Dried Blueberries Market, 2020-2030 (USD Million)
    9. 4.9. Hypermarkets
      1. 4.9.1. Global Hypermarkets Dried Blueberries Market, 2020-2030 (USD Million)
    10. 4.10. Others
      1. 4.10.1. Global Others Dried Blueberries Market, 2020-2030 (USD Million)
  5. CHAPTER 5. Dried Blueberries market – End-User Analysis
    1. 5.1. Global Dried Blueberries Market – End-User Overview
    2. 5.2. Global Dried Blueberries Market Share, by End-User, 2023 & 2030 (USD Million)
    3. 5.3. Bakery Products
      1. 5.3.1. Global Bakery Products Dried Blueberries Market, 2020-2030 (USD Million)
    4. 5.4. Dairy Products
      1. 5.4.1. Global Dairy Products Dried Blueberries Market, 2020-2030 (USD Million)
    5. 5.5. Dietary Supplements
      1. 5.5.1. Global Dietary Supplements Dried Blueberries Market, 2020-2030 (USD Million)
    6. 5.6. Foodservice Providers
      1. 5.6.1. Global Foodservice Providers Dried Blueberries Market, 2020-2030 (USD Million)
    7. 5.7. Confectionaries
      1. 5.7.1. Global Confectionaries Dried Blueberries Market, 2020-2030 (USD Million)
    8. 5.8. Cereals & Snack Bars
      1. 5.8.1. Global Cereals & Snack Bars Dried Blueberries Market, 2020-2030 (USD Million)
    9. 5.9. Beverages
      1. 5.9.1. Global Beverages Dried Blueberries Market, 2020-2030 (USD Million)
    10. 5.10. Personal Care & Cosmetic Products
      1. 5.10.1. Global Personal Care & Cosmetic Products Dried Blueberries Market, 2020-2030 (USD Million)
    11. 5.11. Retailer
      1. 5.11.1. Global Retailer Dried Blueberries Market, 2020-2030 (USD Million)
    12. 5.12. Others
      1. 5.12.1. Global Others Dried Blueberries Market, 2020-2030 (USD Million)
  6. CHAPTER 6. Dried Blueberries market – Regional Analysis
    1. 6.1. Global Dried Blueberries Market Regional Overview
    2. 6.2. Global Dried Blueberries Market Share, by Region, 2023 & 2030 (Value)
    3. 6.3. North America
      1. 6.3.1. North America Dried Blueberries Market size and forecast, 2020-2030
      2. 6.3.2. North America Dried Blueberries Market, by Country, 2023 & 2030 (USD Million)
      3. 6.3.3. North America Dried Blueberries Market, by Form, 2020-2030
        1. 6.3.3.1. North America Dried Blueberries Market, by Form, 2020-2030 (USD Million)
      4. 6.3.4. North America Dried Blueberries Market, by Nature, 2020-2030
        1. 6.3.4.1. North America Dried Blueberries Market, by Nature, 2020-2030 (USD Million)
      5. 6.3.5. North America Dried Blueberries Market, by Distribution Channel, 2020-2030
        1. 6.3.5.1. North America Dried Blueberries Market, by Distribution Channel, 2020-2030 (USD Million)
      6. 6.3.6. North America Dried Blueberries Market, by End-User, 2020-2030
        1. 6.3.6.1. North America Dried Blueberries Market, by End-User, 2020-2030 (USD Million)
      7. 6.3.7. U.S.
        1. 6.3.7.1. U.S. Market size and forecast, 2020-2030 (USD Million)
      8. 6.3.8. Canada
        1. 6.3.8.1. Canada Market size and forecast, 2020-2030 (USD Million)
      9. 6.3.9. Mexico
        1. 6.3.9.1. Mexico Market size and forecast, 2020-2030 (USD Million)
    4. 6.4. Europe
      1. 6.4.1. Europe Dried Blueberries Market size and forecast, 2020-2030
      2. 6.4.2. Europe Dried Blueberries Market, by Country, 2023 & 2030 (USD Million)
      3. 6.4.3. Europe Dried Blueberries Market, by Form, 2020-2030
        1. 6.4.3.1. Europe Dried Blueberries Market, by Form, 2020-2030 (USD Million)
      4. 6.4.4. Europe Dried Blueberries Market, by Nature, 2020-2030
        1. 6.4.4.1. Europe Dried Blueberries Market, by Nature, 2020-2030 (USD Million)
      5. 6.4.5. Europe Dried Blueberries Market, by Distribution Channel, 2020-2030
        1. 6.4.5.1. Europe Dried Blueberries Market, by Distribution Channel, 2020-2030 (USD Million)
      6. 6.4.6. Europe Dried Blueberries Market, by End-User, 2020-2030
        1. 6.4.6.1. Europe Dried Blueberries Market, by End-User, 2020-2030 (USD Million)
      7. 6.4.7. Germany
        1. 6.4.7.1. Germany Market size and forecast, 2020-2030 (USD Million)
      8. 6.4.8. France
        1. 6.4.8.1. France Market size and forecast, 2020-2030 (USD Million)
      9. 6.4.9. U.K.
        1. 6.4.9.1. U.K. Market size and forecast, 2020-2030 (USD Million)
      10. 6.4.10. Italy
        1. 6.4.10.1. Italy Market size and forecast, 2020-2030 (USD Million)
      11. 6.4.11. Spain
        1. 6.4.11.1. Spain Market size and forecast, 2020-2030 (USD Million)
      12. 6.4.12. Nordic Countries
        1. 6.4.12.1. Nordic Countries Market size and forecast, 2020-2030 (USD Million)
      13. 6.4.13. Benelux Union
        1. 6.4.13.1. Benelux Union Market size and forecast, 2020-2030 (USD Million)
      14. 6.4.14. Rest of Europe
        1. 6.4.14.1. Rest of Europe Market size and forecast, 2020-2030 (USD Million)
    5. 6.5. Asia Pacific
      1. 6.5.1. Asia Pacific Dried Blueberries Market size and forecast, 2020-2030
      2. 6.5.2. Asia Pacific Dried Blueberries Market, by Country, 2023 & 2030 (USD Million)
      3. 6.5.3. Asia Pacific Dried Blueberries Market, by Form, 2020-2030
        1. 6.5.3.1. Asia Pacific Dried Blueberries Market, by Form, 2020-2030 (USD Million)
      4. 6.5.4. Asia Pacific Dried Blueberries Market, by Nature, 2020-2030
        1. 6.5.4.1. Asia Pacific Dried Blueberries Market, by Nature, 2020-2030 (USD Million)
      5. 6.5.5. Asia Pacific Dried Blueberries Market, by Distribution Channel, 2020-2030
        1. 6.5.5.1. Asia Pacific Dried Blueberries Market, by Distribution Channel, 2020-2030 (USD Million)
      6. 6.5.6. Asia Pacific Dried Blueberries Market, by End-User, 2020-2030
        1. 6.5.6.1. Asia Pacific Dried Blueberries Market, by End-User, 2020-2030 (USD Million)
      7. 6.5.7. China
        1. 6.5.7.1. China Market size and forecast, 2020-2030 (USD Million)
      8. 6.5.8. Japan
        1. 6.5.8.1. Japan Market size and forecast, 2020-2030 (USD Million)
      9. 6.5.9. India
        1. 6.5.9.1. India Market size and forecast, 2020-2030 (USD Million)
      10. 6.5.10. New Zealand
        1. 6.5.10.1. New Zealand Market size and forecast, 2020-2030 (USD Million)
      11. 6.5.11. Australia
        1. 6.5.11.1. Australia Market size and forecast, 2020-2030 (USD Million)
      12. 6.5.12. South Korea
        1. 6.5.12.1. South Korea Market size and forecast, 2020-2030 (USD Million)
      13. 6.5.13. South-East Asia
        1. 6.5.13.1. South-East Asia Market size and forecast, 2020-2030 (USD Million)
      14. 6.5.14. Rest of Asia Pacific
        1. 6.5.14.1. Rest of Asia Pacific Market size and forecast, 2020-2030 (USD Million)
    6. 6.6. Latin America
      1. 6.6.1. Latin America Dried Blueberries Market size and forecast, 2020-2030
      2. 6.6.2. Latin America Dried Blueberries Market, by Country, 2023 & 2030 (USD Million)
      3. 6.6.3. Latin America Dried Blueberries Market, by Form, 2020-2030
        1. 6.6.3.1. Latin America Dried Blueberries Market, by Form, 2020-2030 (USD Million)
      4. 6.6.4. Latin America Dried Blueberries Market, by Nature, 2020-2030
        1. 6.6.4.1. Latin America Dried Blueberries Market, by Nature, 2020-2030 (USD Million)
      5. 6.6.5. Latin America Dried Blueberries Market, by Distribution Channel, 2020-2030
        1. 6.6.5.1. Latin America Dried Blueberries Market, by Distribution Channel, 2020-2030 (USD Million)
      6. 6.6.6. Latin America Dried Blueberries Market, by End-User, 2020-2030
        1. 6.6.6.1. Latin America Dried Blueberries Market, by End-User, 2020-2030 (USD Million)
      7. 6.6.7. Brazil
        1. 6.6.7.1. Brazil Market size and forecast, 2020-2030 (USD Million)
      8. 6.6.8. Argentina
        1. 6.6.8.1. Argentina Market size and forecast, 2020-2030 (USD Million)
      9. 6.6.9. Rest of Latin America
        1. 6.6.9.1. Rest of Latin America Market size and forecast, 2020-2030 (USD Million)
    7. 6.7. The Middle-East and Africa
      1. 6.7.1. The Middle-East and Africa Dried Blueberries Market size and forecast, 2020-2030
      2. 6.7.2. The Middle-East and Africa Dried Blueberries Market, by Country, 2023 & 2030 (USD Million)
      3. 6.7.3. The Middle-East and Africa Dried Blueberries Market, by Form, 2020-2030
        1. 6.7.3.1. The Middle-East and Africa Dried Blueberries Market, by Form, 2020-2030 (USD Million)
      4. 6.7.4. The Middle-East and Africa Dried Blueberries Market, by Nature, 2020-2030
        1. 6.7.4.1. The Middle-East and Africa Dried Blueberries Market, by Nature, 2020-2030 (USD Million)
      5. 6.7.5. The Middle-East and Africa Dried Blueberries Market, by Distribution Channel, 2020-2030
        1. 6.7.5.1. The Middle-East and Africa Dried Blueberries Market, by Distribution Channel, 2020-2030 (USD Million)
      6. 6.7.6. The Middle-East and Africa Dried Blueberries Market, by End-User, 2020-2030
        1. 6.7.6.1. The Middle-East and Africa Dried Blueberries Market, by End-User, 2020-2030 (USD Million)
      7. 6.7.7. Saudi Arabia
        1. 6.7.7.1. Saudi Arabia Market size and forecast, 2020-2030 (USD Million)
      8. 6.7.8. UAE
        1. 6.7.8.1. UAE Market size and forecast, 2020-2030 (USD Million)
      9. 6.7.9. Egypt
        1. 6.7.9.1. Egypt Market size and forecast, 2020-2030 (USD Million)
      10. 6.7.10. Kuwait
        1. 6.7.10.1. Kuwait Market size and forecast, 2020-2030 (USD Million)
      11. 6.7.11. South Africa
        1. 6.7.11.1. South Africa Market size and forecast, 2020-2030 (USD Million)
      12. 6.7.12. Rest of Middle-East Africa
        1. 6.7.12.1. Rest of Middle-East Africa Market size and forecast, 2020-2030 (USD Million)
  7. CHAPTER 7. Dried Blueberries market – Competitive Landscape
    1. 7.1. Competitor Market Share – Revenue
    2. 7.2. Market Concentration Rate Analysis, Top 3 and Top 5 Players
    3. 7.3. Strategic Development
      1. 7.3.1. Acquisitions and Mergers
      2. 7.3.2. New Products
      3. 7.3.3. Research & Development Activities
  8. CHAPTER 8. Company Profiles
    1. 8.1. Eden Foods
      1. 8.1.1. Company Overview
      2. 8.1.2. Eden Foods Revenue and Gross Margin
      3. 8.1.3. Product portfolio
      4. 8.1.4. Recent initiatives
    2. 8.2. OSKRI Corporation
      1. 8.2.1. Company Overview
      2. 8.2.2. OSKRI Corporation Revenue and Gross Margin
      3. 8.2.3. Product portfolio
      4. 8.2.4. Recent initiatives
    3. 8.3. CAL-SAN Enterprises Ltd.
      1. 8.3.1. Company Overview
      2. 8.3.2. CAL-SAN Enterprises Ltd. Revenue and Gross Margin
      3. 8.3.3. Product portfolio
      4. 8.3.4. Recent initiatives
    4. 8.4. Kiantama Oy
      1. 8.4.1. Company Overview
      2. 8.4.2. Kiantama Oy Revenue and Gross Margin
      3. 8.4.3. Product portfolio
      4. 8.4.4. Recent initiatives
    5. 8.5. True Blue Farms
      1. 8.5.1. Company Overview
      2. 8.5.2. True Blue Farms Revenue and Gross Margin
      3. 8.5.3. Product portfolio
      4. 8.5.4. Recent initiatives
    6. 8.6. Bergin Fruit and Nut Company
      1. 8.6.1. Company Overview
      2. 8.6.2. Bergin Fruit and Nut Company Revenue and Gross Margin
      3. 8.6.3. Product portfolio
      4. 8.6.4. Recent initiatives
    7. 8.7. Del Monte Food Inc.
      1. 8.7.1. Company Overview
      2. 8.7.2. Del Monte Food Inc. Revenue and Gross Margin
      3. 8.7.3. Product portfolio
      4. 8.7.4. Recent initiatives
    8. 8.8. MEDURI FARMS
      1. 8.8.1. Company Overview
      2. 8.8.2. MEDURI FARMS Revenue and Gross Margin
      3. 8.8.3. Product portfolio
      4. 8.8.4. Recent initiatives
    9. 8.9. Traina Foods
      1. 8.9.1. Company Overview
      2. 8.9.2. Traina Foods Revenue and Gross Margin
      3. 8.9.3. Product portfolio
      4. 8.9.4. Recent initiatives
    10. 8.10. KAREN'S NATURALS
      1. 8.10.1. Company Overview
      2. 8.10.2. KAREN'S NATURALS Revenue and Gross Margin
      3. 8.10.3. Product portfolio
      4. 8.10.4. Recent initiatives
    11. 8.11. Oregon Berry Packing Inc.
      1. 8.11.1. Company Overview
      2. 8.11.2. Oregon Berry Packing Inc. Revenue and Gross Margin
      3. 8.11.3. Product portfolio
      4. 8.11.4. Recent initiatives
    12. 8.12. Shoreline Fruit
      1. 8.12.1. Company Overview
      2. 8.12.2. Shoreline Fruit Revenue and Gross Margin
      3. 8.12.3. Product portfolio
      4. 8.12.4. Recent initiatives
    13. 8.13. Naturipe Farms LLC.
      1. 8.13.1. Company Overview
      2. 8.13.2. Naturipe Farms LLC. Revenue and Gross Margin
      3. 8.13.3. Product portfolio
      4. 8.13.4. Recent initiatives
    14. 8.14. Angas Park Fruit Co.
      1. 8.14.1. Company Overview
      2. 8.14.2. Angas Park Fruit Co. Revenue and Gross Margin
      3. 8.14.3. Product portfolio
      4. 8.14.4. Recent initiatives
    15. 8.15. Helsu Foods
      1. 8.15.1. Company Overview
      2. 8.15.2. Helsu Foods Revenue and Gross Margin
      3. 8.15.3. Product portfolio
      4. 8.15.4. Recent initiatives
    16. 8.16. Tesco.com
      1. 8.16.1. Company Overview
      2. 8.16.2. Tesco.com Revenue and Gross Margin
      3. 8.16.3. Product portfolio
      4. 8.16.4. Recent initiatives
    17. 8.17. Graceland Fruit
      1. 8.17.1. Company Overview
      2. 8.17.2. Graceland Fruit Revenue and Gross Margin
      3. 8.17.3. Product portfolio
      4. 8.17.4. Recent initiatives
    18. 8.18. Beprepared
      1. 8.18.1. Company Overview
      2. 8.18.2. Beprepared Revenue and Gross Margin
      3. 8.18.3. Product portfolio
      4. 8.18.4. Recent initiatives
    19. 8.19. Royal Nut Company
      1. 8.19.1. Company Overview
      2. 8.19.2. Royal Nut Company Revenue and Gross Margin
      3. 8.19.3. Product portfolio
      4. 8.19.4. Recent initiatives
  9. CHAPTER 9. Dried Blueberries — Industry Analysis
    1. 9.1. Dried Blueberries Market – Key Trends
      1. 9.1.1. Market Drivers
      2. 9.1.2. Market Restraints
      3. 9.1.3. Market Opportunities
    2. 9.2. Value Chain Analysis
    3. 9.3. Technology Roadmap and Timeline
    4. 9.4. Dried Blueberries Market – Attractiveness Analysis
      1. 9.4.1. By Form
      2. 9.4.2. By Nature
      3. 9.4.3. By Distribution Channel
      4. 9.4.4. By End-User
      5. 9.4.5. By Region
  10. CHAPTER 10. Marketing Strategy Analysis, Distributors
    1. 10.1. Marketing Channel
    2. 10.2. Direct Marketing
    3. 10.3. Indirect Marketing
    4. 10.4. Marketing Channel Development Trend
    5. 10.5. Economic/Political Environmental Change
  11. CHAPTER 11. Report Conclusion
  12. CHAPTER 12. Research Approach & Methodology
    1. 12.1. Report Description
    2. 12.2. Research Scope
    3. 12.3. Research Methodology
      1. 12.3.1. Secondary Research
      2. 12.3.2. Primary Research
      3. 12.3.3. Models
        1. 12.3.3.1. Company Share Analysis Model
        2. 12.3.3.2. Revenue Based Modeling
        3. 12.3.3.3. Research Limitations

        List of Figures

        FIG. 1 Global Dried Blueberries Market, 2020-2030 (USD Million)
        FIG. 2 Global Dried Blueberries Market Share, by Form, 2023 & 2030 (USD Million)
        FIG. 3 Global Whole Dried Fruits Dried Blueberries Market, 2020-2030 (USD Million)
        FIG. 4 Global Granules & Slices Dried Blueberries Market, 2020-2030 (USD Million)
        FIG. 5 Global Powder Dried Blueberries Market, 2020-2030 (USD Million)
        FIG. 6 Global Dried Blueberries Market Share, by Nature, 2023 & 2030 (USD Million)
        FIG. 7 Global Conventional Dried Blueberries Market, 2020-2030 (USD Million)
        FIG. 8 Global Organic Dried Blueberries Market, 2020-2030 (USD Million)
        FIG. 9 Global Dried Blueberries Market Share, by Distribution Channel, 2023 & 2030 (USD Million)
        FIG. 10 Global Convenience Stores Dried Blueberries Market, 2020-2030 (USD Million)
        FIG. 11 Global Independent Small Groceries Dried Blueberries Market, 2020-2030 (USD Million)
        FIG. 12 Global Supermarkets Dried Blueberries Market, 2020-2030 (USD Million)
        FIG. 13 Global Online Retailing Dried Blueberries Market, 2020-2030 (USD Million)
        FIG. 14 Global Forecourt Retailers Dried Blueberries Market, 2020-2030 (USD Million)
        FIG. 15 Global Specialty Stores Dried Blueberries Market, 2020-2030 (USD Million)
        FIG. 16 Global Hypermarkets Dried Blueberries Market, 2020-2030 (USD Million)
        FIG. 17 Global Others Dried Blueberries Market, 2020-2030 (USD Million)
        FIG. 18 Global Dried Blueberries Market Share, by End-User, 2023 & 2030 (USD Million)
        FIG. 19 Global Bakery Products Dried Blueberries Market, 2020-2030 (USD Million)
        FIG. 20 Global Dairy Products Dried Blueberries Market, 2020-2030 (USD Million)
        FIG. 21 Global Dietary Supplements Dried Blueberries Market, 2020-2030 (USD Million)
        FIG. 22 Global Foodservice Providers Dried Blueberries Market, 2020-2030 (USD Million)
        FIG. 23 Global Confectionaries Dried Blueberries Market, 2020-2030 (USD Million)
        FIG. 24 Global Cereals & Snack Bars Dried Blueberries Market, 2020-2030 (USD Million)
        FIG. 25 Global Beverages Dried Blueberries Market, 2020-2030 (USD Million)
        FIG. 26 Global Personal Care & Cosmetic Products Dried Blueberries Market, 2020-2030 (USD Million)
        FIG. 27 Global Retailer Dried Blueberries Market, 2020-2030 (USD Million)
        FIG. 28 Global Others Dried Blueberries Market, 2020-2030 (USD Million)
        FIG. 29 Global Dried Blueberries Market Share, by Region, 2023 & 2030
        FIG. 30 North America Dried Blueberries Market, 2020-2030
        FIG. 31 U.S. Dried Blueberries Market, 2020-2030
        FIG. 32 Canada Dried Blueberries Market, 2020-2030
        FIG. 33 Mexico Dried Blueberries Market, 2020-2030
        FIG. 34 Europe Dried Blueberries Market, 2020-2030
        FIG. 35 Germany Dried Blueberries Market, 2020-2030
        FIG. 36 France Dried Blueberries Market, 2020-2030
        FIG. 37 U.K. Dried Blueberries Market, 2020-2030
        FIG. 38 Italy Dried Blueberries Market, 2020-2030
        FIG. 39 Spain Dried Blueberries Market, 2020-2030
        FIG. 40 Nordic Countries Dried Blueberries Market, 2020-2030
        FIG. 41 Benelux Union Dried Blueberries Market, 2020-2030
        FIG. 42 Rest of Europe Dried Blueberries Market, 2020-2030
        FIG. 43 Asia Pacific Dried Blueberries Market, 2020-2030
        FIG. 44 China Dried Blueberries Market, 2020-2030
        FIG. 45 Japan Dried Blueberries Market, 2020-2030
        FIG. 46 India Dried Blueberries Market, 2020-2030
        FIG. 47 New Zealand Dried Blueberries Market, 2020-2030
        FIG. 48 Australia Dried Blueberries Market, 2020-2030
        FIG. 49 South  Korea Dried Blueberries Market, 2020-2030
        FIG. 50 South-East Asia Dried Blueberries Market, 2020-2030
        FIG. 51 Rest of Asia Pacific Dried Blueberries Market, 2020-2030
        FIG. 52 Latin America Dried Blueberries Market, 2020-2030
        FIG. 53 Brazil Dried Blueberries Market, 2020-2030 
        FIG. 54 Argentina Dried Blueberries Market, 2020-2030 
        FIG. 55 Rest of Latin America Dried Blueberries Market, 2020-2030 
        FIG. 56 The Middle-East and Africa Dried Blueberries Market, 2020-2030 
        FIG. 57 Saudi Arabia Dried Blueberries Market, 2020-2030 
        FIG. 58 UAE Dried Blueberries Market, 2020-2030 
        FIG. 59 Egypt Dried Blueberries Market, 2020-2030 
        FIG. 60 Kuwait Dried Blueberries Market, 2020-2030 
        FIG. 61 South Africa Dried Blueberries Market, 2020-2030 
        FIG. 62 Rest of Middle-East Africa Dried Blueberries Market, 2020-2030 
        FIG. 63 Competitor Market Share – Revenue 
        FIG. 64 Eden Foods Revenue and Growth Rate 
        FIG. 65 Eden Foods Market Share 
        FIG. 66 OSKRI Corporation Revenue and Growth Rate 
        FIG. 67 OSKRI Corporation Market Share 
        FIG. 68 CAL-SAN Enterprises Ltd. Revenue and Growth Rate 
        FIG. 69 CAL-SAN Enterprises Ltd. Market Share 
        FIG. 70 Kiantama Oy Revenue and Growth Rate 
        FIG. 71 Kiantama Oy Market Share 
        FIG. 72 True Blue Farms Revenue and Growth Rate 
        FIG. 73 True Blue Farms Market Share 
        FIG. 74 Bergin Fruit and Nut Company Revenue and Growth Rate 
        FIG. 75 Bergin Fruit and Nut Company Market Share 
        FIG. 76 Del Monte Food Inc. Revenue and Growth Rate 
        FIG. 77 Del Monte Food Inc. Market Share 
        FIG. 78 MEDURI FARMS Revenue and Growth Rate 
        FIG. 79 MEDURI FARMS Market Share 
        FIG. 80 Traina Foods Revenue and Growth Rate 
        FIG. 81 Traina Foods Market Share 
        FIG. 82 KAREN'S NATURALS Revenue and Growth Rate 
        FIG. 83 KAREN'S NATURALS Market Share 
        FIG. 84 Oregon Berry Packing Inc. Revenue and Growth Rate 
        FIG. 85 Oregon Berry Packing Inc. Market Share 
        FIG. 86 Shoreline Fruit Revenue and Growth Rate 
        FIG. 87 Shoreline Fruit Market Share 
        FIG. 88 Naturipe Farms LLC. Revenue and Growth Rate 
        FIG. 89 Naturipe Farms LLC. Market Share 
        FIG. 90 Angas Park Fruit Co. Revenue and Growth Rate 
        FIG. 91 Angas Park Fruit Co. Market Share 
        FIG. 92 Helsu Foods Revenue and Growth Rate 
        FIG. 93 Helsu Foods Market Share 
        FIG. 94 Tesco.com Revenue and Growth Rate 
        FIG. 95 Tesco.com Market Share 
        FIG. 96 Graceland Fruit Revenue and Growth Rate 
        FIG. 97 Graceland Fruit Market Share 
        FIG. 98 Beprepared Revenue and Growth Rate 
        FIG. 99 Beprepared Market Share 
        FIG. 100 Royal Nut Company Revenue and Growth Rate 
        FIG. 101 Royal Nut Company Market Share 
        FIG. 102 Market Dynamics 
        FIG. 103 Global Dried Blueberries – Value Chain Analysis 
        FIG. 104 Technology Roadmap and Timeline 
        FIG. 105 Market Attractiveness Analysis – By Form 
        FIG. 106 Market Attractiveness Analysis – By Nature 
        FIG. 107 Market Attractiveness Analysis – By Distribution Channel 
        FIG. 108 Market Attractiveness Analysis – By End-User 
        FIG. 109 Market Attractiveness Analysis – By Region 
        FIG. 110 Market Channel 
        FIG. 111 Marketing Channel Development Trend 
        FIG. 112 Growth in World Gross Product, 2008-2018 


        List of Tables

        TABLE 1 Global Coffee Machines Market, 2023 & 2030 (USD Million) 20
        TABLE 2 Global Coffee Machines market, by Product, 2020-2030 (USD Million) 22
        TABLE 3 Global Coffee Machines market, by Application, 2020-2030 (USD Million) 28
        TABLE 4 Global Coffee Machines market, by Region, 2020-2030 (USD Million) 31
        TABLE 5 North America Coffee Machines Market, by Product, 2020-2030 (USD Million) 35
        TABLE 6 North America Coffee Machines Market, by Application, 2020-2030 (USD Million) 36
        TABLE 7 Europe Coffee Machines Market, by Product, 2020-2030 (USD Million) 42
        TABLE 8 Europe Coffee Machines Market, by Application, 2020-2030 (USD Million) 43
        TABLE 9 Asia Pacific Coffee Machines Market, by Product, 2020-2030 (USD Million) 54
        TABLE 10 Asia Pacific Coffee Machines Market, by Application, 2020-2030 (USD Million) 55
        TABLE 11 Latin America Coffee Machines Market, by Product, 2020-2030 (USD Million) 66
        TABLE 12 Latin America Coffee Machines Market, by Application, 2020-2030 (USD Million) 67
        TABLE 13 The Middle-East and Africa Coffee Machines Market, by Product, 2020-2030 (USD Million) 73
        TABLE 14 The Middle-East and Africa Coffee Machines Market, by Application, 2020-2030 (USD Million) 74
        TABLE 15 Global Coffee Machines Market - Company Revenue Analysis 2020-2022 (USD Million) 81
        TABLE 16 Global Coffee Machines Market - Company Revenue Share Analysis 2020-2022(%) 83
        TABLE 17 Acquisitions and Mergers 84
        TABLE 18 New Product/Service Launch 84
        TABLE 19 Research & Development Activities 84
        TABLE 20 Market Drivers 107
        TABLE 21 Market Restraints 107
        TABLE 22 Market Opportunities 108

Industry Major Market Players

  • Eden Foods
  • OSKRI Corporation
  • CAL-SAN Enterprises Ltd.
  • Kiantama Oy
  • True Blue Farms
  • Bergin Fruit and Nut Company
  • Del Monte Food Inc.
  • MEDURI FARMS
  • Traina Foods
  • KAREN'S NATURALS
  • Oregon Berry Packing Inc.
  • Shoreline Fruit
  • Naturipe Farms LLC.
  • Angas Park Fruit Co.
  • Helsu Foods
  • Tesco.com
  • Graceland Fruit
  • Beprepared
  • Royal Nut Company