![]()
Search Market Research Report
Composites Market Size, Share Global Analysis Report, 2020–2026

Composites Market By Fiber Type (Glass Fiber Composites, Carbon Fiber Composites, Natural Fiber Composites, and Others), By Resin Type (Thermoset Composites and Thermoplastic Composites), By Manufacturing Process (Lay-up, Filament Winding, Injection Molding, Pultrusion, Compression Molding, RTM, and Others), By End-Use Industry (Aerospace & Defense, Wind Energy, Transportation, Construction &Infrastructure, Marine, Pipe & Tank, Electrical & Electronics, and Others), and By Region: Global Industry Outlook, Market Size, Business Intelligence, Consumer Preferences, Statistical Surveys, Comprehensive Analysis, Historical Developments, Current Trends, and Forecast 2020–2026
Industry Insights
This specialized and expertise oriented industry research report scrutinizes the technical and commercial business outlook of the Composites industry. The report analyzes and declares the historical and current trends analysis of the Compositesindustry and subsequently recommends the projected trends anticipated to be observed in the Composites market during the upcoming years.
The Composites market report analyzes and notifies the industry statistics at the global as well as regional and country levels in order to acquire a thorough perspective of the entire Composites market. The historical and past insights are provided for FY 2016 to FY 2019 whereas projected trends are delivered for FY 2020 to FY 2026. The quantitative and numerical data is represented in terms of both volume (Kiloton) and value (USD Billion) from FY 2016 – 2026.
The quantitative data is further underlined and reinforced by comprehensive qualitative data which comprises various across-the-board market dynamics. The rationales which directly or indirectly impact the Compositesindustry are exemplified through parameters such as growth drivers, restraints, challenges, and opportunities among other impacting factors.
Throughout our research report, we have encompassed all the proven models and tools of industry analysis and extensively illustrated all the key business strategies and business models adopted in the Composites industry. The report provides an all-inclusive and detailed competitive landscape prevalent in the Composites market.
The report utilizes established industry analysis tools and models such as Porter’s Five Forces framework to analyze and recognize critical business strategies adopted by various stakeholders involved in the entire value chain of the Composites industry. The Composites market report additionally employs SWOT analysis and PESTLE analysis models for further in-depth analysis.
The report study further includes an in-depth analysis of industry players' market shares and provides an overview of leading players' market position in the Composites sector. Key strategic developments in the Composites market competitive landscape such as acquisitions & mergers, inaugurations of different products and services, partnerships & joint ventures, MoU agreements, VC & funding activities, R&D activities, and geographic expansion among other noteworthy activities by key players of the Composites market are appropriately highlighted in the report.
The demand for composites is rising due to the demand for lightweight materials in the automotive and aerospace industries. In addition, the advancements taking place in the aerospace and defense sector such as Boeing and Airbus in the U.S. and Europe are likely to propel the growth of the global Composites market. Furthermore, the surging backward and forward integration of the composites market is likely to profit from various raw material manufacturers. The low production cost of composites and the development of rare end products is predicted to enhance the profitability of the composites on a global level. The rising use of composites in Carbon Fiber Reinforced Plastic (CFRP) applications depending on grades and the quality of precursor will further boost the market growth. In addition, the presence of key market players, advancements in the mode of transportation, developments in wind energy, construction & infrastructure industries, and others help expand the Composites market.
 Report Scope
Report Attribute |
Details |
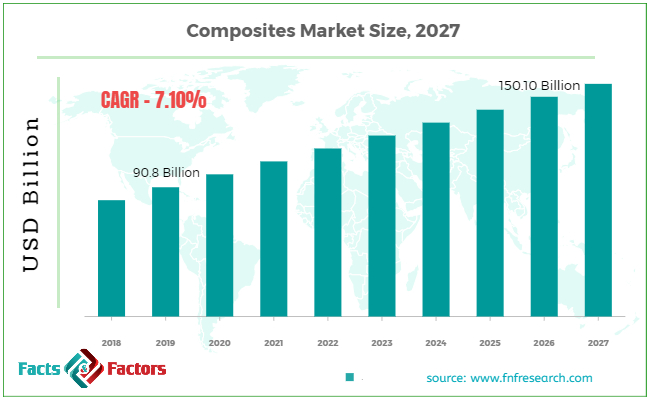
Market Size in 2019 |
USD 90.8 Billion |
Projected Market Size in 2026 |
USD 150.10 Billion |
CAGR Growth Rate |
7.10% CAGR |
Base Year |
2019 |
Forecast Years |
2020-2026 |
Key Market Players |
Toray Industries Inc., Owens Corning, Teijin Limited, Hexcel Corporation, Huntsman International LLC., SGL Group, Solvay, Nippon Electrical Glass Co. Ltd., Koninklijke Ten Cate bv., Mitsubishi Chemical Holdings Corporation., and Others |
Key Segment |
By Fiber Type, Resin Type, Manufacturing Process, End-Use Industry, and Region |
Major Regions Covered |
North America, Europe, Asia Pacific, Latin America, and the Middle East & Africa |
Purchase Options |
Request customized purchase options to meet your research needs. Explore purchase options |
The Composites market research report delivers an acute valuation and taxonomy of the Compositesindustry by practically splitting the market on the basis of different fiber types, resin type, manufacturing process, and end-use industry, and regions. Through the analysis of the historical and projected trends, all the segments and sub-segments were evaluated through the bottom-up approach, and different market sizes have been projected for FY 2020 to FY 2026. The regional segmentation of the Compositesindustry includes the complete classification of all the major continents including North America, Latin America, Europe, Asia Pacific, and Middle East & Africa. Further, country-wise data for the Compositesindustry is provided for the leading economies of the world.
The Composites market is segmented based on Fiber Type, Resin Type, Manufacturing Process, and End-Use Industry. By fiber type, the global Composites market is sectored into Glass Fiber Composites, Carbon Fiber Composites, Natural Fiber Composites, and Others. On the basis of resin type, the market is divided into Thermoset Composites and Thermoplastic Composites. Based on the manufacturing process, the market for composites is categorized into Lay-up, Filament Winding, Injection Molding, Pultrusion, Compression Molding, RTM, and Others. In terms of end-use industry, the market is segregated into Aerospace & Defense, Wind Energy, Transportation, Construction &Infrastructure, Marine, Pipe & Tank, Electrical & Electronics, and Others.
Some of the essential players operating in the Composites market, but not restricted to include
- Toray Industries Inc.
- Owens Corning
- Teijin Limited
- Hexcel Corporation
- Huntsman International LLC.
- SGL Group
- Solvay
- Electrical Glass Co. Ltd
- Koninklijke Ten Cate bv.
- Mitsubishi Chemical Holdings Corporation
The taxonomy of the global Composites Market by its scope and segmentation is as follows:
Fiber Type Segmentation Analysis
- Glass Fiber Composites
- Carbon Fiber Composites
- Natural Fiber Composites
- Others
Resin Type Segmentation Analysis
- Thermoset Composites
- Thermoplastic Composites
Manufacturing Process Segmentation Analysis
- Lay-up
- Filament Winding
- Injection Molding
- Pultrusion
- Compression Molding
- Resin Transfer Molding (RTM)
- Others
End-Use Industry Segmentation Analysis
- Aerospace & defense
- Wind Energy
- Transportation
- Construction & Infrastructure
- Marine
- Pipe & Tank
- Electrical & Electronics
- Others
Regional Segmentation Analysis
- North America
- The U.S.
- Canada
- Europe
- Germany
- The UK
- France
- Spain
- Italy
- Rest of Europe
- Asia Pacific
- China
- Japan
- India
- South Korea
- Southeast Asia
- Rest of Asia Pacific
- Latin America
- Brazil
- Mexico
- Rest of Latin America
- Middle East & Africa
- GCC
- South Africa
- Rest of Middle East & Africa
Table of Content
Industry Major Market Players
- Toray Industries Inc.
- Owens Corning
- Teijin Limited
- Hexcel Corporation
- Huntsman International LLC.
- SGL Group


Copyright © 2025 - 2026, All Rights Reserved, Facts and Factors